Abstract
The role of free fatty acid receptor 1 (FFAR1/GPR40) in glucose homeostasis is still incompletely understood. Small receptor agonists stimulating insulin secretion are undergoing investigation for the treatment of type 2 diabetes. Surprisingly, genome-wide association studies did not discover diabetes risk variants in FFAR1. We reevaluated the role of FFAR1 in insulin secretion using a specific agonist, FFAR1-knockout mice and human islets. Nondiabetic individuals were metabolically phenotyped and genotyped. In vitro experiments indicated that palmitate and a specific FFAR1 agonist, TUG-469, stimulate glucose-induced insulin secretion through FFAR1. The proapoptotic effect of chronic exposure of β-cells to palmitate was independent of FFAR1. TUG-469 was protective, whereas inhibition of FFAR1 promoted apoptosis. In accordance with the proapoptotic effect of palmitate, in vivo cross-sectional observations demonstrated a negative association between fasting free fatty acids (NEFAs) and insulin secretion. Because NEFAs stimulate secretion through FFAR1, we examined the interaction of genetic variation in FFAR1 with NEFA and insulin secretion. The inverse association of NEFA and secretion was modulated by rs1573611 and became steeper for carriers of the minor allele. In conclusion, FFAR1 agonists support β-cell function, but variation in FFAR1 influences NEFA effects on insulin secretion and therefore could affect therapeutic efficacy of FFAR1 agonists.
Free fatty acids (also called nonesterified fatty acids [NEFAs]) regulate insulin secretion in β-cells. An acute increase in NEFA potentiates glucose-induced insulin secretion, an effect mediated by free fatty acid receptor 1 (FFAR1; formerly G-protein–coupled receptor 40 [GPR40]) (1–3). Targeting FFAR1 with specific agonists is a promising way of enhancing insulin secretion in patients with type 2 diabetes and results from clinical phase 2 trials have already appeared (4).
Previously, we also described small compounds that stimulate insulin secretion as selective FFAR1 agonists (5,6). For this reason, and because of its exceptionally high expression in β-cells, FFAR1 would be an ideal candidate gene to associate with diabetes and insulin secretion. Surprisingly, from the 53 glycemic trait–related genes hitherto discovered in genome-wide association studies, none is located in or near FFAR1 (7).
In contrast to the stimulatory effect of an acute increase in NEFA, long-term exposure of insulin-secreting cells to NEFA is believed to cause a reduction in β-cell mass attributable to increased apoptosis (8–10). In humans, several studies demonstrated reduced insulin secretion after prolonged exposure to NEFAs (11,12), but these findings were not unequivocal. The effect seemed to depend on the metabolic status or the individual predisposition of tested individuals (13,14). Animal studies suggested that the deleterious effect of prolonged NEFA elevation is independent of FFAR1 activation, because mice deficient in FFAR1 were not protected against high-fat diet–induced glucose intolerance (15).
The current study uses a translational approach to examine the role of FFAR1 in the Janus-faced effect of NEFAs on β-cell function. First, we analyzed effects of a synthetic FFAR1 agonist (TUG-469) and an antagonist (TUG-761) on insulin secretion and apoptosis. Second, we analyzed a precisely phenotyped human study population to answer the question of how NEFAs relate to insulin secretion and whether it is influenced by common variation in the FFAR1 gene.
RESEARCH DESIGN AND METHODS
Culture and treatment of islets and insulin-secreting cells.
Human islets were cultured in CMRL1066 medium (Biochrom, Berlin, Germany) containing 5.5 mmol/L glucose supplemented with 2 mmol/L L-glutamine, 10 mmol/L Hepes, and 10% FCS (Biochrom). Human islets were provided through the Juvenile Diabetes Research Foundation award 31-2008-413 to the European Consortium for Islet Transplantation (Basic Research program), and their use was approved by the local Ethics Committee of the University Hospital, Tübingen, Germany (533/2010BO2). Preparations of mouse islets from wild-type (WT) and FFAR1 knockout (KO) littermates and preparations of single cells are described in the Supplemental Materials (16). All animal experiments were performed in accordance with the accepted standard of human care of animals and were approved by the local Animal Care and Use Committee. INS-1E cells were cultured as previously described (17).
Isolation of mouse islets and preparation of single islet cells.
Islets were isolated from WT and FFAR1 littermates by collagenase digestion (3 mg in 3 mL PBS) at 37°C for 9 min. The islets were collected under a dissecting microscope and were sedimented twice through sterile culture medium and cultured overnight in nonadhesive Petri dishes. Cells were prepared from the islets by digestion with 0.001% trypsin in PBS for 3–6 min. After centrifugation in culture medium, 20-μL drops of the cell suspension were distributed onto culture dishes and, after 1 h of adhesion time, the dish was filled with medium.
Measurement of insulin secretion.
Isolated islets, after overnight culture, were preincubated for 1 h in modified Krebs-Ringer bicarbonate buffer containing the following (in mmol/L): 135 NaCl; 4.8 KCl; 1.2 MgSO4; 1.2 NaH2PO4; 4.8 Na2HPO4; 5 NaHCO3; 2.6 CaCl2; 10 Hepes; 2.8 glucose; and 0.05% (weight/volume) BSA (fatty acid–free; Sigma-Aldrich). Thereafter, batches of 10 islets/500 μL were incubated for 1 h in Krebs-Ringer bicarbonate buffer supplemented with test substances as indicated. INS-1E cells were cultured as previously described and insulin secretion was measured using the same Krebs-Ringer bicarbonate buffer as for islets (6). Insulin was measured by radioimmunoassay (Linco Research, St. Charles, MO).
Because the stimulation of FFAR1 by the small receptor agonists and by palmitate strongly depends on albumin, experiments with TUG-469 (19) and TUG-761 (5) were performed in the presence of low concentrations of BSA (0.05%) and serum (1.2%) (18). The palmitate concentration was adjusted accordingly. Palmitate (100 mmol/L in DMSO) was merged with FCS at concentrations of 1 and 6 mmol/L when 10% FCS was used. The solutions were further diluted when 1.2% FCS or 0.05% BSA were used.
Measurement of apoptotic cell death in mouse islet cells and INS-1E cells.
Apoptosis was quantified by TUNEL staining of isolated mouse and human islet and INS-1E cells after 1–2 days of culture in the presence of test substances using a commercial kit (Roche Diagnostics GmbH, Mannheim, Germany). Nuclei were counterstained with 1 μmol/L TO-PRO3 (Invitrogen GmbH, Karlsruhe, Germany).
Measurement of glycemic traits in humans.
We studied 2,110 nondiabetic subjects of European descent from the Tubingen Family Study. All participants gave written informed consent. The study was approved by the local ethics committee. This cross-sectional observational study enrolled individuals with increased risk of type 2 diabetes (positive family history, glucose intolerance, or overweight). All participants underwent an oral glucose tolerance test (OGTT). After an overnight fast, 75 g glucose was ingested at 8:00 a.m.; plasma glucose, insulin, C-peptide, and NEFA concentrations were determined after 0, 30, 60, 90, and 120 min.
Determination of blood parameters.
Plasma glucose was determined using a glucose analyzer (glucose oxidase method; Yellow Springs Instruments, Yellow Springs, OH). NEFA concentrations were measured enzymatically (WAKO Chemicals, Neuss, Germany) using the ADVIA 1800 analyzer (Siemens Healthcare Diagnostics, Eschborn, Germany). Insulin and C-peptide were analyzed using the ADVIA Centaur XP immunoassay system.
Selection of tagging single nucleotide polymorphisms in humans.
Based on publicly available data of the International HapMap Project derived from the Central European population (release 24, phase II, NCBI B36 assembly), we screened the FFAR1 gene, located on chromosome 19q13.12, and 5 kb of both flanking regions in silico. Sixteen informative HapMap single nucleotide polymorphisms (SNPs) were present in this range, but only 13 SNPs were present with minor allele frequencies (MAFs) ≥0.05 (HapMap data). Nine SNPs were selected as tagging SNPs covering all other common SNPs within the locus, with r2 > 0.8 (100% coverage) based on Tagger analysis using Haploview software.
Genotyping.
DNA was extracted from peripheral blood after cell lysis, protein precipitation, and purification steps. All SNPs were genotyped using the MassARRAY platform from Sequenom (Sequenom, San Diego, CA). Genotype calling was unsuccessful for rs12459138 and Hardy-Weinberg equilibrium was rejected for rs10423648 (P < 0.05); therefore, seven SNPs went into analysis. MAFs and P for Hardy-Weinberg equilibrium are provided in Supplementary Table 1.
Calculations and statistics.
Insulin sensitivity was assessed from glucose and insulin values during the five-point OGTT with the Matsuda index (19). Area under the curve (AUC) was calculated with the trapezoid method. Insulin secretion was estimated by AUC0–30Insulin/AUC0–30Glucose and AUC0–30C-peptide/AUC0–30Glucose. These two parameters, based on independent measurements and representing early insulin secretion, have been shown to provide an excellent assessment of genetically determined β-cell function from OGTT data (20).
To test genotype effects on β-cell function, linear regression models were constructed with parameters of β-cell function as outcome variables. Genotypes were coded as continuous variables with an additive model or with a dominant model in which heterozygous and homozygous carriers of the minor allele were pooled. Sex, age, BMI, and insulin sensitivity were used as covariates. Interaction with NEFA was tested by adding fasting NEFA and the interaction term fasting NEFA × SNP to the model. Variables with skewed distribution were transformed to their natural logarithm before linear regression analyses. To reduce the risk of type I error with multiple testing, the Bonferroni method was used, accepting 0.05/7 = 0.007 as the significance level for α, for which the null hypothesis is rejected. Effect sizes are displayed with the regression coefficient β.
For the insulin-based outcome parameter, the study was sufficiently powered (sensitivity 80%) to detect an effect size of 3.3% in the lowest MAF variant. The needed minimum effect size was 1.7% in the case of the highest MAF variant.
Power analysis was performed with Quanto V1.2.4 (21). All other statistical analyses were conducted with JMP10 (SAS).
RESULTS
A small synthetic agonist of FFAR1 mimics palmitate-induced insulin secretion but antagonizes palmitate-induced β-cell death.
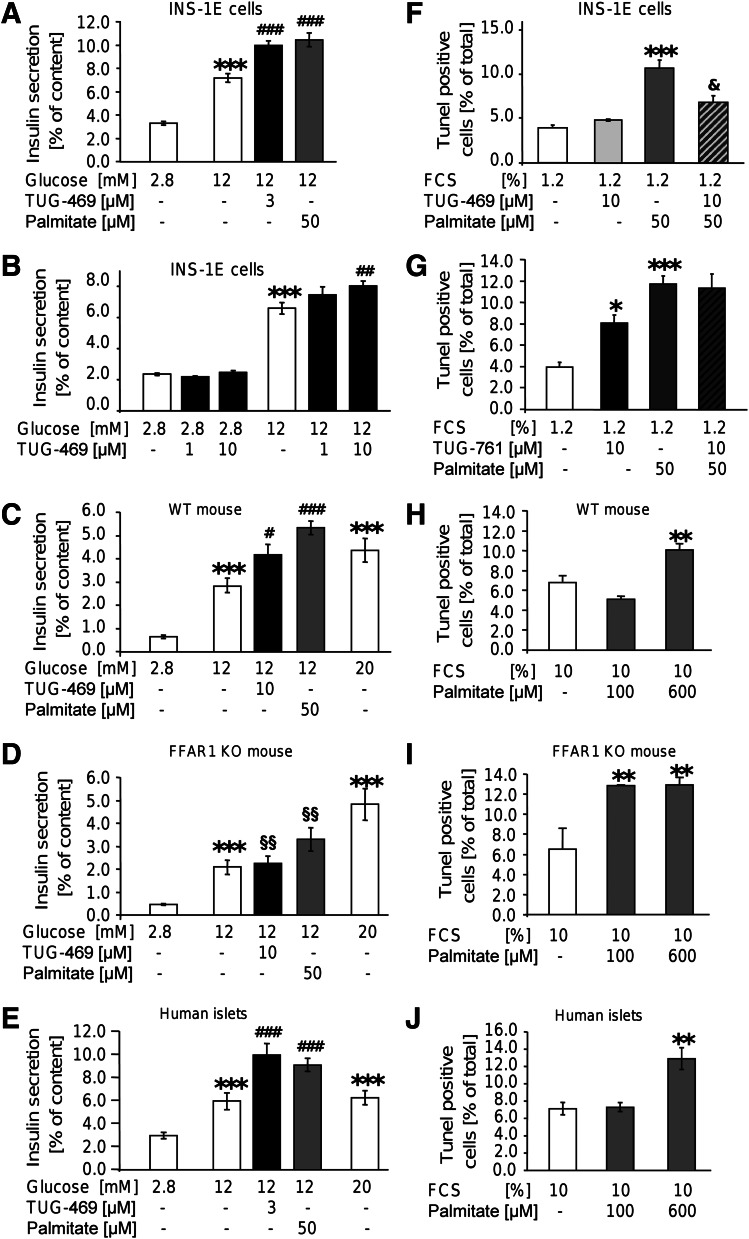
Effects of FFAR1 activation were examined with a synthetic receptor agonist, TUG-469. This small molecule concentration-dependently stimulated hGPR40/hFFAR1 (22). TUG-469 maximally stimulated insulin secretion of INS-1E cells at 3 and 10 μmol/L, whereas 1 μmol/L TUG-469 had no effect (Fig. 1A, B). That TUG-469 exerts insulinotropic effects through FFAR1 was corroborated in islets from FFAR1-deficient mice (Fig. 1C, D). Whereas glucose stimulated insulin secretion in FFAR1 KO mouse islets as efficiently as in islets of WT mice, the stimulatory effect of TUG-469 (10 μmol/L) was abrogated and the effect of palmitate (50 μmol/L) was significantly reduced in FFAR1-deficient islets compared with WT islets. Finally, in three human islet preparations, TUG-469 (3 μmol/L) robustly augmented insulin secretion (Fig. 1E).
FIG. 1.
FFAR1 contributes to palmitate-induced insulin secretion but not palmitate-induced β-cell death. INS-1E cells (A, B, F, G), mouse islets (C, D, H, I), and human islets (E, J) were incubated with test substances as indicated and described in RESEARCH DESIGN AND METHODS. Results are expressed as means ± SEM of n = 4 independent experiments. Statistical analysis was performed with ANOVA, followed by Newman-Keuls multiple comparison test as post hoc test. *P < 0.05, **P < 0.01, and ***P < 0.001 are significant in controls (first bar of each chart). #P < 0.05, ##P < 0.01, and ###P < 0.001 indicate significance in secretion at 12 mmol/L glucose. §§P < 0.05 indicates significance in secretion of WT mouse islets at the same condition. & indicates significance in palmitate-induced apoptosis.
Next, we examined whether prolonged exposure to the FFAR1 agonist affects cell survival. Although palmitate (50 μmol/L) for 1 day in culture medium containing 1.2% FCS significantly increased the amount of TUNEL-stained nuclei, TUG-469 (10 μmol/L) was without effect. Moreover, TUG-469 efficiently antagonized palmitate-induced β-cell death (Fig. 1F). The FFAR1 antagonist TUG-761 (10 μmol/L) significantly increased the percentage of TUNEL-positive cells. TUG-761, however, did not significantly augment palmitate-induced cell death (Fig. 1G and Supplementary Fig. 1). The role of FFAR1 for palmitate-induced β-cell death was further analyzed using WT and FFAR1 KO mice (Fig. 1H, I). In WT mouse islet cells, increased number of TUNEL-positive nuclei was detected after 2 days of culture in the presence of 10% FCS and 600 μmol/L, but not of 100 μmo/L, palmitate. In islet cell cultures of FFAR1 KO mice, palmitate already maximally induced cell death at 100 µmol/L, supporting the prosurvival role of FFAR1. In accordance, TUG-469 (3 μmol/L) abolished palmitate-induced apoptosis in WT, but not in FFAR1 KO, islet cells (Supplementary Fig. 3). Furthermore, the antagonist TUG-761 (10 μmol/L) increased the percentage of TUNEL-positive cells from WT, but not from FFAR1 KO, mice (Supplementary Fig. 3). Pharmacological efficacy of TUG-761 applied alone can be rationalized with the assumption that FFAR1 displays constitutive activity in vivo, a notion that is corroborated in FFAR1-HEK293 cells (Supplementary Fig. 1). These results suggest that FFAR1 agonists are suitable insulinotropic agents because they stimulate insulin secretion and counter the adverse effects on β-cell survival.
Characteristics of the human cohort and association of fasting NEFA with insulin secretion.
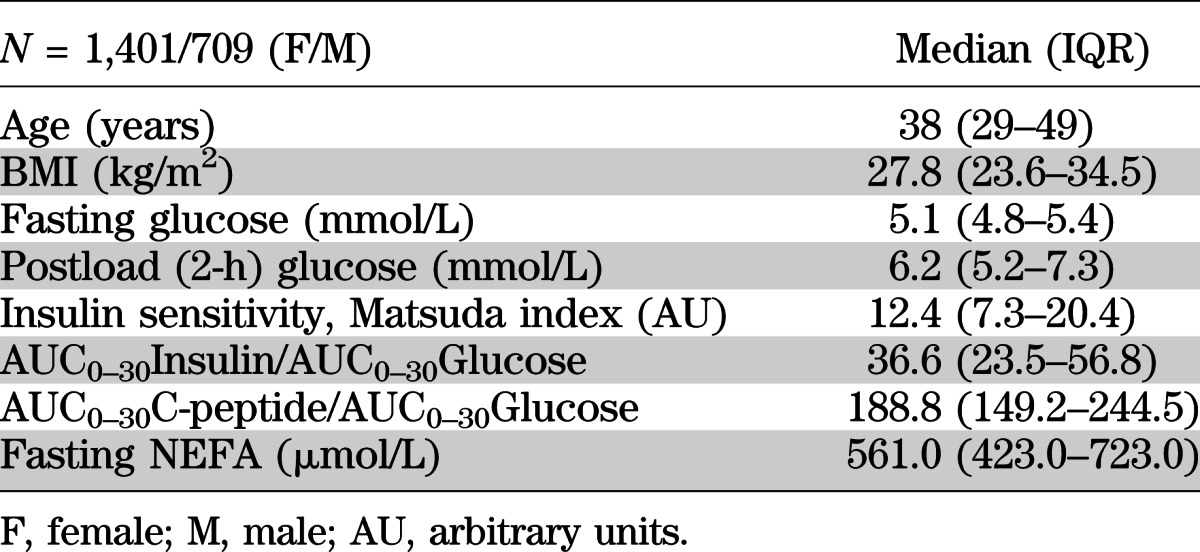
Because physiological stimulation of FFAR1 is mediated by NEFA, including the major plasma fatty acids palmitate, stearate, oleate, and linoleate, the correlation of glucose-induced insulin secretion with plasma NEFA was evaluated in the cross-sectional Tubingen Family Study cohort (for basic cohort characteristics, see Table 1). Two independent secretion parameters, AUC0–30Insulin/AUC0–30Glucose and AUC0–30C-peptide/AUC0–30Glucose, associated negatively with fasting NEFA after adjustment for sex, age, BMI, and insulin sensitivity (β = −0.12, P < 0.0001, and β = −0.09, P < 0.0001, respectively).
TABLE 1.
Basic demographic and metabolic characteristics of the study cohort

Genetic variation in FFAR1 and its association with insulin secretion in humans.
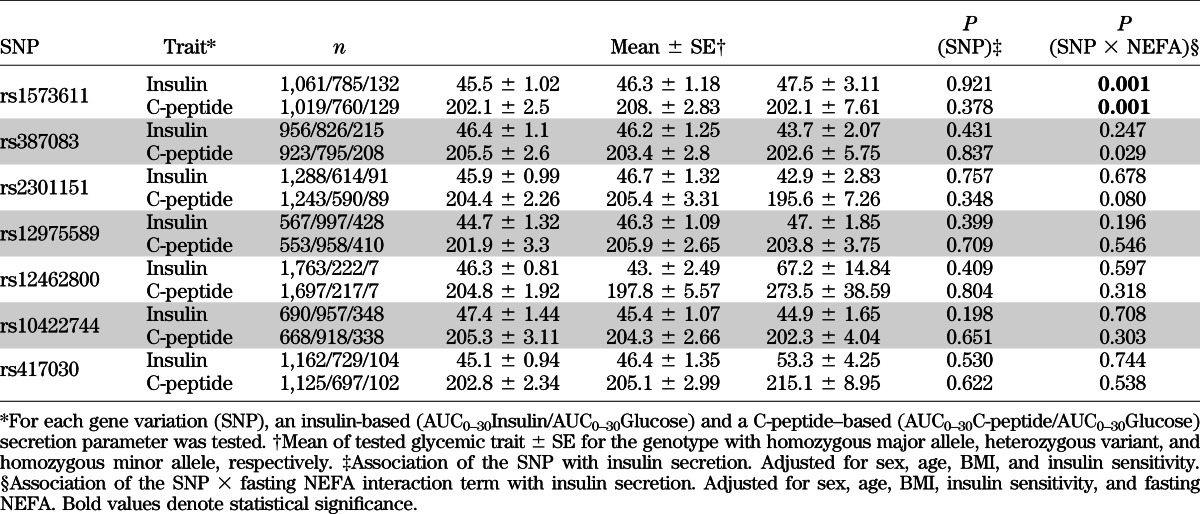
After adjusting for sex, age, BMI, and insulin sensitivity, one of seven tagging SNPs of FFAR1 was associated with either parameter of β-cell function, insulin, or C-peptide (Table 2; P value for SNP effects).
TABLE 2.
Association of common variants in FFAR1 with insulin secretion and their interaction with fasting NEFA

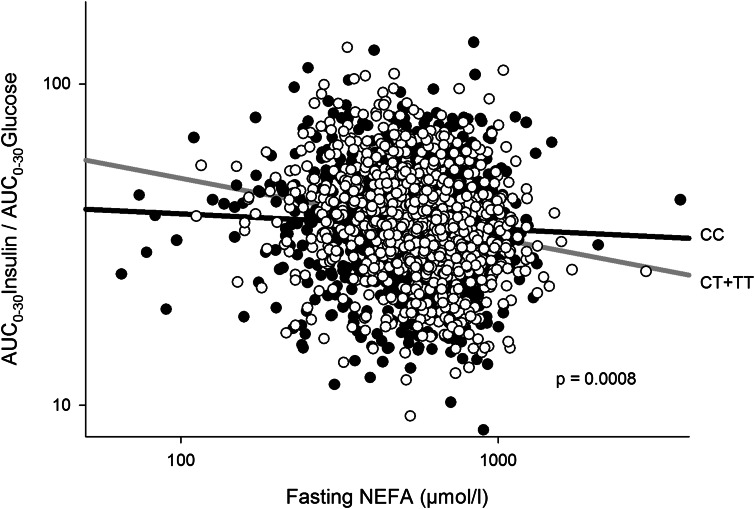
Given the physiological role of NEFA in the stimulation of insulin secretion through FFAR1, we analyzed the interaction of fasting NEFA and the investigated SNPs on insulin secretion. Significant interactions were found for both the insulin-based and C-peptide–based outcome parameter in rs1573611 (Table 2, first row). This implied that the regression coefficients (β) of the model explaining insulin secretion by NEFA levels were significantly different for each genotype after adjustment for sex, age, BMI, and insulin sensitivity. The negative slope of the regression line between fasting NEFA and AUC0–30Insulin/AUC0–30Glucose was more pronounced in carriers of the minor allele (Fig. 2; CC: β = −0.061 ± 0.03; CT: β = −0.19 ± 0.04; TT: β = −0.23 ± 0.09). This has the consequence that carriers of the major allele of rs1573611 are protected at least to some extent from the negative effect of NEFAs on insulin secretion.
FIG. 2.
Interaction of fasting NEFA (in µmol/L) with genotypes of rs1573611 on insulin secretion. Both axes are log-scaled. AUC0–30Insulin/AUC0–30Glucose is adjusted for sex, age, BMI, and insulin sensitivity. Filled circles correspond to the CC genotype (homozygous major allele) and empty circles correspond to carriers of the T allele (CT and TT genotypes).
DISCUSSION
The current study provides evidence that effective stimulation of insulin secretion through FFAR1 in humans requires specific genetic and metabolic predispositions. Previously, a study analyzing two SNPs in FFAR1 found clues for a possible association between genotypes and insulin secretion (23). However, no association between FFAR1 and insulin secretion could be shown in genome-wide association studies for the SNPs rs387083, rs2301151, rs12975589, rs12462800, rs417030, and rs1573611 in up to 46,186 individuals (24). In agreement with the genome-wide association studies results, our analysis of seven tagging SNPs in FFAR1 utilizing OGTT-based insulin secretion parameters could not unravel significant effects on insulin secretion either. Instead, we demonstrated that the inverse association between NEFAs and reduced insulin secretion is modulated by the genetic variation in rs1573611. This interaction was robustly significant and consistent for two independently measured secretion parameters (AUC of insulin and C-peptide). The SNP rs1573611 is located in the FFAR1 locus, 341 bases upstream from the exon, pointing to a possible effect of the SNP on the modulation of FFAR1 transcription (Supplementary Fig. 2).
Our findings strongly suggest that FFAR1 activation does not mimic proapoptotic effects of palmitate, but that it mediates a protective effect on β cells in addition to the stimulation of insulin secretion. In line with our observation, it has been described previously that the protective effect of oleate is lost in FFAR1-deficient cells (25). Moreover, pharmacological inhibition of FFAR1 by TUG-761 induced apoptosis.
Chronically elevated NEFAs deteriorate insulin secretion in humans (14,26). This is a consequence of FFAR1-independent reduction of β-cell function, which overwhelms FFAR1-mediated stimulation of insulin secretion. The FFAR1-dependent change in the NEFA–insulin secretion regression slope could reflect different stimulatory potentials for NEFA-induced insulin secretion and different grades of β-cell protection against chronic noxious effects of NEFA.
These data also clearly demonstrate that the therapeutic efficacy of specific FFAR1 agonists could be subject to pharmacogenomic interactions. Genotype-dependent dose–response analysis of FFAR1 agonists would provide information about the individual efficacy of FFAR1 agonists in clinical trials.
The demonstration of an interaction between rs1573611 and NEFA shows for the first time that a frequent variant of FFAR1 has a measurable effect on the biological function of the receptor in humans.
Supplementary Material
ACKNOWLEDGMENTS
The study was supported by DFG grants UL140/7-2 and GRK1302/1, by the German Federal Ministry of Education and Research (DLR01GI0925), and by the Danish Council for Independent Research, Technology, and Production (grant 09-070364).
No potential conflicts of interest relevant to this article were reported.
R.W. and S.U. researched data and wrote the manuscript. G.K., F.G., E.C., M.E.D.-H., M.G., F.M., A.P., and A.F. researched data and edited the manuscript. E.K., T.U., and H.-U.H. edited the manuscript and contributed to the discussion. R.W. is the guarantor of this work and, as such, had full access to all the data in the study and takes responsibility for the integrity of the data and the accuracy of the data analysis.
Parts of the study were previously presented in poster form at the 71st Scientific Sessions of the American Diabetes Association, San Diego, California, 24–28 June 2011.
The authors thank Sieglinde Haug (German Center for Diabetes Research at the University of Tübingen) and Elisabeth Metzinger (Department of Internal Medicine IV, University of Tübingen) for excellent technical help. The authors thank Claes B. Wollheim (University of Geneva, Switzerland) for providing INS-1E cells.
Footnotes
This article contains Supplementary Data online at http://diabetes.diabetesjournals.org/lookup/suppl/doi:10.2337/db12-1249/-/DC1.
REFERENCES
- 1.Briscoe CP, Tadayyon M, Andrews JL, et al. The orphan G protein-coupled receptor GPR40 is activated by medium and long chain fatty acids. J Biol Chem 2003;278:11303–11311 [DOI] [PubMed] [Google Scholar]
- 2.Itoh Y, Kawamata Y, Harada M, et al. Free fatty acids regulate insulin secretion from pancreatic beta cells through GPR40. Nature 2003;422:173–176 [DOI] [PubMed] [Google Scholar]
- 3.Nolan CJ, Madiraju MS, Delghingaro-Augusto V, Peyot ML, Prentki M. Fatty acid signaling in the beta-cell and insulin secretion. Diabetes 2006;55(Suppl 2):S16–S23 [DOI] [PubMed] [Google Scholar]
- 4.Burant CF, Viswanathan P, Marcinak J, et al. TAK-875 versus placebo or glimepiride in type 2 diabetes mellitus: a phase 2, randomised, double-blind, placebo-controlled trial. Lancet 2012;379:1403–1411 [DOI] [PubMed] [Google Scholar]
- 5.Christiansen E, Urban C, Grundmann M, et al. Identification of a potent and selective free fatty acid receptor 1 (FFA1/GPR40) agonist with favorable physicochemical and in vitro ADME properties. J Med Chem 2011;54:6691–6703 [DOI] [PubMed] [Google Scholar]
- 6.Christiansen E, Urban C, Merten N, et al. Discovery of potent and selective agonists for the free fatty acid receptor 1 (FFA(1)/GPR40), a potential target for the treatment of type II diabetes. J Med Chem 2008;51:7061–7064 [DOI] [PubMed] [Google Scholar]
- 7.Scott RA, Lagou V, Welch RP, et al. DIAbetes Genetics Replication and Meta-analysis (DIAGRAM) Consortium Large-scale association analyses identify new loci influencing glycemic traits and provide insight into the underlying biological pathways. Nat Genet 2012;44:991–1005 [DOI] [PMC free article] [PubMed] [Google Scholar]
- 8.Maedler K, Spinas GA, Dyntar D, Moritz W, Kaiser N, Donath MY. Distinct effects of saturated and monounsaturated fatty acids on beta-cell turnover and function. Diabetes 2001;50:69–76 [DOI] [PubMed] [Google Scholar]
- 9.Sargsyan E, Bergsten P. Lipotoxicity is glucose-dependent in INS-1E cells but not in human islets and MIN6 cells. Lipids Health Dis 2011;10:115–121 [DOI] [PMC free article] [PubMed] [Google Scholar]
- 10.Eitel K, Staiger H, Brendel MD, et al. Different role of saturated and unsaturated fatty acids in beta-cell apoptosis. Biochem Biophys Res Commun 2002;299:853–856 [DOI] [PubMed] [Google Scholar]
- 11.Paolisso G, Gambardella A, Amato L, et al. Opposite effects of short- and long-term fatty acid infusion on insulin secretion in healthy subjects. Diabetologia 1995;38:1295–1299 [DOI] [PubMed] [Google Scholar]
- 12.Carpentier A, Mittelman SD, Lamarche B, Bergman RN, Giacca A, Lewis GF. Acute enhancement of insulin secretion by FFA in humans is lost with prolonged FFA elevation. Am J Physiol 1999;276:E1055–E1066 [DOI] [PubMed] [Google Scholar]
- 13.Carpentier A, Mittelman SD, Bergman RN, Giacca A, Lewis GF. Prolonged elevation of plasma free fatty acids impairs pancreatic beta-cell function in obese nondiabetic humans but not in individuals with type 2 diabetes. Diabetes 2000;49:399–408 [DOI] [PubMed] [Google Scholar]
- 14.Kashyap S, Belfort R, Gastaldelli A, et al. A sustained increase in plasma free fatty acids impairs insulin secretion in nondiabetic subjects genetically predisposed to develop type 2 diabetes. Diabetes 2003;52:2461–2474 [DOI] [PubMed] [Google Scholar]
- 15.Lan H, Hoos LM, Liu L, et al. Lack of FFAR1/GPR40 does not protect mice from high-fat diet-induced metabolic disease. Diabetes 2008;57:2999–3006 [DOI] [PMC free article] [PubMed] [Google Scholar]
- 16.Ranta F, Avram D, Berchtold S, et al. Dexamethasone induces cell death in insulin-secreting cells, an effect reversed by exendin-4. Diabetes 2006;55:1380–1390 [DOI] [PubMed] [Google Scholar]
- 17.Ullrich S, Berchtold S, Ranta F, et al. Serum- and glucocorticoid-inducible kinase 1 (SGK1) mediates glucocorticoid-induced inhibition of insulin secretion. Diabetes 2005;54:1090–1099 [DOI] [PubMed] [Google Scholar]
- 18.Christiansen E, Due-Hansen ME, Urban C, et al. Free fatty acid receptor 1 (FFA1/GPR40) agonists: mesylpropoxy appendage lowers lipophilicity and improves ADME properties. J Med Chem 2012;55:6624–6628 [DOI] [PubMed] [Google Scholar]
- 19.Matsuda M, DeFronzo RA. Insulin sensitivity indices obtained from oral glucose tolerance testing: comparison with the euglycemic insulin clamp. Diabetes Care 1999;22:1462–1470 [DOI] [PubMed] [Google Scholar]
- 20.Herzberg-Schäfer SA, Staiger H, Heni M, et al. Evaluation of fasting state-/oral glucose tolerance test-derived measures of insulin release for the detection of genetically impaired β-cell function. PLoS ONE 2010;5:e14194. [DOI] [PMC free article] [PubMed] [Google Scholar]
- 21.Gauderman W, Morrison J. QUANTO 1.1: A computer program for power and sample size calculations for genetic-epidemiology studies. Available at: http://hydra.usc.edu/gxe/
- 22.Christiansen E, Due-Hansen ME, Urban C, et al. Structure-activity study of dihydrocinnamic acids and discovery of the potent FFA1 (GPR40) agonist TUG-469. ACS Med Chem Lett 2010;1:345–349 [DOI] [PMC free article] [PubMed] [Google Scholar]
- 23.Kalis M, Levéen P, Lyssenko V, Almgren P, Groop L, Cilio CM. Variants in the FFAR1 gene are associated with beta cell function. PLoS ONE 2007;2:e1090. [DOI] [PMC free article] [PubMed] [Google Scholar]
- 24.Dupuis J, Langenberg C, Prokopenko I, et al. DIAGRAM Consortium. GIANT Consortium. Global BPgen Consortium. Anders Hamsten on behalf of Procardis Consortium. MAGIC investigators New genetic loci implicated in fasting glucose homeostasis and their impact on type 2 diabetes risk. Nat Genet 2010;42:105–116 [DOI] [PMC free article] [PubMed] [Google Scholar]
- 25.Zhang Y, Xu M, Zhang S, et al. The role of G protein-coupled receptor 40 in lipoapoptosis in mouse beta-cell line NIT-1. J Mol Endocrinol 2007;38:651–661 [DOI] [PubMed] [Google Scholar]
- 26.Salgin B, Ong KK, Thankamony A, Emmett P, Wareham NJ, Dunger DB. Higher fasting plasma free fatty acid levels are associated with lower insulin secretion in children and adults and a higher incidence of type 2 diabetes. J Clin Endocrinol Metab 2012;97:3302–3309 [DOI] [PubMed] [Google Scholar]
Associated Data
This section collects any data citations, data availability statements, or supplementary materials included in this article.


