

Abstract
Purpose
To investigate the influence of portal pressure on the shear stiffness of the liver and spleen in a well-controlled in vivo porcine model with MR Elastography (MRE). A significant correlation between portal pressure and tissue stiffness could be used to noninvasively assess increased portal venous pressure (portal hypertension), which is a frequent clinical condition caused by cirrhosis of the liver and is responsible for the development of many lethal complications.
Materials and Methods
During multiple intra-arterial infusions of Dextran-40 in three adult domestic pigs in vivo, 3-D abdominal MRE was performed with left ventricle and portal catheters measuring blood pressure simultaneously. Least-squares linear regressions were used to analyze the relationship between tissue stiffness and portal pressure.
Results
Liver and spleen stiffness have a dynamic component that increases significantly following an increase in portal or left ventricular pressure. Correlation coefficients with the linear regressions between stiffness and pressure exceeded 0.8 in most cases.
Conclusion
The observed stiffness-pressure relationship of the liver and spleen could provide a promising noninvasive method for assessing portal pressure. Using MRE to study the tissue mechanics associated with portal pressure may provide new insights into the natural history and pathophysiology of hepatic diseases and may have significant diagnostic value in the future.
Keywords: MR Elastography, liver, spleen, portal pressure, shear stiffness
Introduction
Portal hypertension is a common clinical syndrome defined by a pathological increase in portal venous pressure. Cirrhosis of the liver is the most common cause of portal hypertension (1), which can also result in esophageal variceal bleeding and even death. Currently, the hepatic venous pressure gradient (HVPG) is the gold standard for evaluating patients with portal hypertension. Although HVPG is a direct measurement of portal hypertension, it is not used routinely to evaluate patients with portal hypertension, due to its invasiveness (2). There are also several technical considerations that demand rigorous attention to obtain valid HVPG measurements (3). The availability of a noninvasive method to estimate portal pressure would likely be very useful in clinical practice. Ultrasonography is widely used for assessing the presence or absence of portal hypertension. However, there is limited correlation between HVPG and Doppler ultrasound findings (4). For instance, portal hypertension cannot be ruled out if ultrasound findings are negative (5).
MR Elastography (MRE) is an MRI-based noninvasive technique for quantitatively assessing the mechanical properties of soft tissues by studying the propagation of shear waves through the tissue (6). Multiple studies have reported on developments of MRE to quantitatively assess the mechanical properties of the liver (7–10) and spleen (11). Among these applications, hepatic MRE has recently been adopted as a tool for clinical diagnosis for detecting fibrosis. Studies have shown that both liver and spleen stiffness, assessed using either ultrasound or MR-based elastography techniques, can be altered by portal hypertension in patients with hepatic fibrosis (11–13). It was also found in a porcine model that liver stiffness is influenced by central venous pressure (14); and a postprandial increase in hepatic stiffness has been found that is higher in patients with hepatic fibrosis than in normal volunteers and may indicate alterations in portal pressure due to fibrosis (15–17). These findings indicate that tissue stiffness may have two components: a static component reflecting the intrinsic mechanical properties of the tissue, and a dynamic component reflecting hemodynamic effects on the free extracellular fluid. It has been demonstrated ex vivo that hepatic shear stiffness increases with changes in interstitial pressure under unconstrained conditions (18).
We hypothesize that portal hypertension will lead to increased liver stiffness. However, large animal models that have the typical features of portal hypertension have not been well established. In this study, we created an acute portal hypertension porcine model with Dextran-40 infusions. The Dextran-40 infusions have colloid osmotic pressures as high as 150 mmHg and can cause osmosis of fluid out of the interstitial fluid spaces into the blood and thereby create negative pressures in the interstitial spaces as great as -30 to -100 mmHg (19,20). Subsequently, changes in the extracellular fluid pressure can profoundly alter blood flow, intravascular pressure and transcapillary fluid exchange within the gastrointestinal tract, which eventually results in increased portal pressure.
To gain additional insight into the correlation between hepatic stiffness and portal pressure, we performed a preliminary study using an in vivo porcine model of progressive portal hypertension produced by multiple intra-arterial infusions of Dextran-40 (21). The purpose of this study was 1) to demonstrate a well-controlled in vivo porcine model in which persistent elevation of portal pressure could be achieved without additional factors related to chronic liver disease processes; and 2) to investigate the influence of portal pressure on the shear stiffness of the liver and spleen with MRE-assessed liver stiffness measurements. This study was designed to detect transient changes in gross mechanical properties induced by artificially increasing tissue pressure in normal hepatic and splenic parenchyma. These mechanical changes do not reflect intrinsic alterations of the architecture or structure of the parenchyma associated with liver diseases, such as fat infiltration or fibrosis deposition. Instead, they reflect the nonlinear properties of the parenchyma itself. If the correlation between pressure and stiffness is understood, then, in the future, pressure-induced stiffness changes could be an important independent predictor of the development and complications of portal hypertension in chronic liver diseases.
Materials and Methods
Animal Preparation
Three 38.4 ± 4.1 kg adult domestic pigs were used in this study, which was approved by our Institutional Animal Care and Use Committee (IACUC). After fasting overnight, each animal underwent general isoflurane inhalation anesthesia in the MR scanner. Prior to the MRI acquisition, two fluid-filled pressure sensors (M1006B, Philips Medical Systems, Andover, MA) were placed into left ventricle (LV) and portal vein (PV) catheters and calibrated as baselines. Both the arterial and venous sheaths were then connected to a pressure monitoring system. During the MRI acquisition, each animal underwent repeated intra-arterial infusions of Dextran-40 in increments of 20% until reaching 80–120% of their blood volume, which was calculated based on their body weight (blood weight was estimated to be 8% of the body weight and the number of infusions was limited by vital life signs from the monitoring system). Immediately after each infusion, abdominal MRE data were acquired while both the LV and PV blood pressures were measured simultaneously. Blood pressure waveforms were sampled at a rate of 1 kHz and recorded using a notebook computer (Core-2 Duo processor, Lenovo, Morrisville, NC) during the MRE acquisition.
MRE Acquisition
All image acquisitions were performed on a 1.5-Tesla MRI scanner (Signa EXCITE, GE Healthcare, Milwaukee, WI) with an 8-channel phased-array torso coil. As shown in the left diagram of Figure 1, the pigs were imaged in the supine position and placed feet first in the scanner. Two acoustic pressure-activated drivers were placed against the body wall, one over the liver and another over the spleen. An elastic belt was used to secure the drivers to the body wall. During the MRE acquisition, the passive drivers supplied continuous 60-Hz vibrations which generated shear waves throughout the entire abdominal area. A multislice single-shot, spin-echo, echo-planar MRE sequence was used to collect 3-D/3-axis wave images as shown in the right diagram of Figure 1. Imaging parameters included FOV = 26 cm, slice thickness = 6 mm, image acquisition matrix = 80×80 (reconstructed to 128×128), 40 slices, 4 time offsets, 6 motion-encoding directions (±X, ±Y, ±Z), TR/TE = 1667/48 ms, parallel imaging acceleration factor = 3, motion sensitivity = 17 μm/π radians, receiver bandwidth = ±250 kHz. Heart rate and blood pressure were monitored to ensure proper depth of anesthesia. A ventilator was used to suspend the respiration during data acquisition. After the MRI exam, the pigs were euthanatized immediately by administering Sleepaway IV (Fort Dodge Laboratories, Fort Dodge, Iowa, USA).
Figure 1. Experimental setup and MRE sequence.
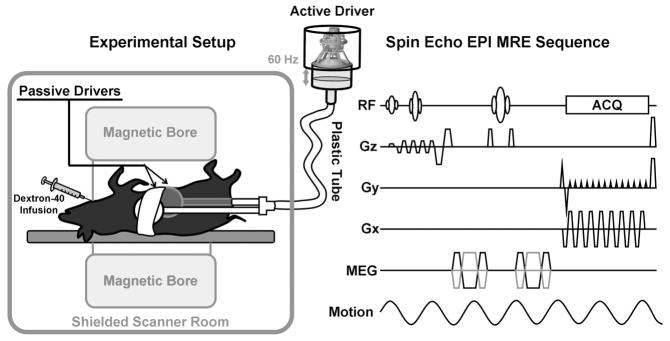
The experimental setup is shown in the left diagram. An active driver located outside the shielded scanner room produced varying acoustic pressure at 60 Hz. A plastic tube was used to conduct the vibrations to two passive drivers which were secured to the anterior body wall of the animal in the supine position. One driver was placed on the right chest wall over the liver. The other was placed on the left lower abdominal wall over the spleen. The right diagram is an illustration of the pulse sequence used for the MRE data acquisition. The sequence was a flow-compensated spin-echo echo planar imaging (EPI) sequence with additional motion-encoding gradients (MEG) applied along each direction (±Gx, ±Gy and ±Gz) to detect the cyclic motion in the three orthogonal directions. The MEGs were designed with nulled zeroth and first gradient moments. Superior and inferior spatial presaturation bands were applied to suppress the blood signal flowing into the acquired volume of tissue during the multislice axial MRE acquisition.
MRE Processing
Images of tissue stiffness (elastograms) were calculated with a 3-D local frequency estimation (LFE) (22) inversion algorithm with 20 evenly-spaced 3-D directional filters incorporating a fourth-order Butterworth bandpass filter (23). The bandpass component of the directional filters was applied to remove undesired low-frequency wave information due to background phase artifacts, longitudinal waves and bulk motion, and to remove high-frequency information due to noise. Based on preliminary studies of liver and spleen MRE in pigs, the cut-off frequencies of the bandpass filter were chosen to be away from the dominant spatial frequencies of the shear waves observed in previous MRE studies (7–11) (the high-end spatial frequency cut-off value was 1.54 cm−1, corresponding to stiffness values less than 0.152 kPa, while the low-end cut-off was 0.154 cm−1, corresponding to stiffness values above 15.2 kPa). The elastograms were analyzed by measuring the mean shear stiffness of large, manually specified regions of interests (ROIs) defined in each slice that included the entire hepatic/splenic parenchyma, while excluding major blood vessels and areas with insufficient wave amplitude.
Statistical Analysis
Shear stiffness measurements of the liver and spleen were expressed as means and standard deviations over the regions of interest selected on multiple imaging planes. The end-diastolic pressure in the LV was expressed as a minimum value, while the portal pressure in the portal vein was expressed as a mean value. A least-squares linear regression analysis was performed in each individual animal and across all animals with the correlation coefficient R value used to evaluate the goodness of the fit to the data. The linear correlations between the liver and spleen stiffness in each animal and across all animals were also reported. A correlation greater than 0.8 was considered a strong correlation, whereas a correlation less than 0.5 was considered weak.
Results
The MRE driver system with the double passive drivers generated shear waves that could be readily imaged throughout the liver and spleen tissues in all three animals. MRE wave images at three different time points are shown in Figure 2 (baseline, 20% infusion, 40% infusion). It is apparent that the wavelength of the shear waves increases (indicative of an increase in stiffness) with the increase in the volume of Dextran-40 infused. Corresponding changes can also be seen in the elastograms. The blood pressure and stiffness measurements for all time points in one pig are shown in Figure 3. We observed that both the LV end-diastolic pressure and the portal pressure increased gradually with time (i.e., increased infusion volume) from 0 to 32 mmHg and 8 to 34 mmHg, respectively. The changes in the blood pressure averaged about 7 mmHg per infusion. The liver and spleen stiffness increased progressively from 2.3 kPa to 6.4 kPa and 2.3 to 5.6 kPa, respectively. Both stiffness measurements were substantially increased (>0.5 kPa) by each of the first four infusions, but smaller increments (<0.2 kPa) for the last two infusions. All four curves showed the same general trend with increased infusion.
Figure 2. MR Elastography of the liver (a) and the spleen (b).

MRE images of the liver (a) and spleen (b) are shown at 3 infusion levels. The top, middle and bottom rows in each case show the results of the baseline acquisition (BL) and after the first (D1) and second (D2) Dextran-40 infusions, respectively. In each case, an example MR magnitude image is shown in the left column, elastograms are shown in the second column, and the displacements measured in the X, Y and Z directions are shown in the last three columns.
Figure 3. Tissue stiffness and blood pressure measurements in one pig.
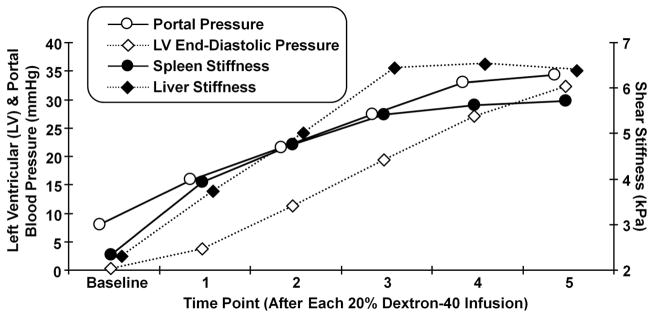
Tissue stiffness and blood pressure measurements are shown for pig #2. The measurements correspond to the baseline measurements and those obtained after each 20% Dextran-40 infusion. The left axis indicates the blood pressure for the portal pressure (hollow circle) and the left ventricular end-diastolic blood pressure (hollow diamond) measurements. The right axis indicates the shear stiffness measured in the spleen (solid circle) and the liver (solid diamond).
The linear regression analysis of liver and spleen stiffness changes compared to LV and portal pressure changes is shown in Figure 4. Both the mean liver and spleen data correlate to the blood pressures very well. For the liver, most data from individual animal had a strong correlation with R≥0.8 except the portal pressure data from pig #3 (R=0.59), as shown in the gray circles of (b). After consolidating the data from all 3 pigs, the liver stiffness versus pressure data still had strong correlations with R=0.86 as shown by the solid lines in (a) and (b). For the spleen, some individual subject data correlated to the blood pressures well with R≥0.89 except for the portal pressure data from pig #3 (R=0.47) and the LV end diastolic pressure data from #1 and #3 (R=0.67, R=0.68). The consolidated spleen stiffness versus pressure data also had acceptable correlations with R 0.75 as shown by the solid lines in (c) and (d). Overall, excellent correlations of R≥0.8 were found in 11 of the 16 stiffness-pressure relationships. The spleen stiffness for each pig was highly correlated with the liver stiffness in each pig (R≥0.9) with increasing Dextran-40 infusions as shown in Figure 5. After consolidating the data from all 3 pigs, the spleen stiffness was still highly correlated with the liver stiffness (R≥0.9).
Figure 4. Regression analysis for the tissue stiffness and blood pressure measurements.
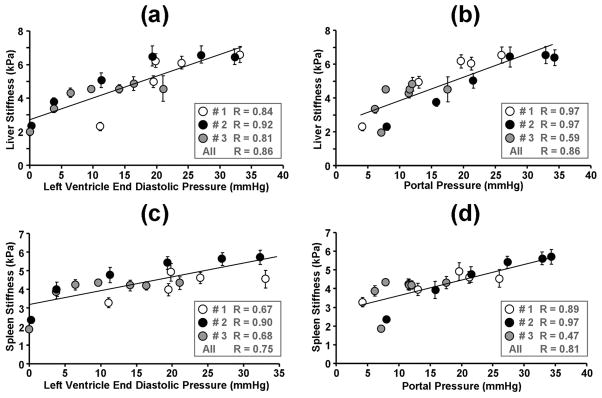
The liver (a, b) and spleen (c, d) stiffness for all three pigs are shown as a function of the LV end-diastolic pressure (a, c) and the portal pressure (b, d). The different symbols (white, black and gray circles) represent different animals. The standard deviations of the liver stiffness over multiple slices are shown as the error bars. The solid lines represent the regression results for the pooled results from all three animals. The correlation coefficient values for each individual animal and pooled animals are listed in the boxes.
Figure 5. Correlation between the liver and spleen stiffness.

Linear regressions show significant correlations between the liver and spleen stiffness in each individual animal and pooled animals as the perfusion was varied.
Discussion
These results have shown that the shear stiffness of the liver and spleen strongly correlate with the LV end-diastolic pressure and portal pressure over a wide range of pressures in this disease-free acute portal hypertension porcine model. This supports the hypothesis that both the liver and spleen stiffness include a dynamic component that reflects increased blood pressures which causes increased tissue tension. These results are also consistent with the results found in an in situ clamped-vasculature, animal liver model assessed with a transient ultrasound elastography technique(14).
It has been well established that MRE-assessed liver stiffness is highly correlated with hepatic fibrosis extent in patients with chronic liver diseases (7,24,25). Based on this study, both increased hepatic fibrosis and elevated portal pressure may contribute to the high liver stiffness in patients with chronic liver disease. Using a similar imaging technique, spleen stiffness has been found to be significantly correlated with liver stiffness in patients with varying degrees of biopsy-proven hepatic fibrosis (11). Those results are consistent with the result from this study that a strong linear correlation exists between the liver and spleen stiffness due to changes in blood pressure in this animal model.
Dynamic liver and spleen stiffness change could be a predictor of intrahepatic pressure and portal pressure changes. Recent studies have demonstrated that liver stiffness could have, in addition to a static component determined by the extent of hepatic fibrosis, a dynamic component affected by transient changes in the perfusion caused by food intake or decompensated congestive heart failure (14,15,26). Most liver diseases include some degree of inflammation that can also lead to increased perfusion or pressure in the liver. Many investigators have observed that inflammatory conditions increase liver stiffness irrespective of fibrosis (27,28). Therefore, in patients with hepatic fibrosis, liver stiffness measurements may reflect not only fibrosis extent but also coexisting inflammation and portal hypertension, which can elevate intrahepatic sinusoidal resistance and tissue tension via increased portal pressure. In order to accurately assess hepatic fibrosis in patients with chronic liver diseases, the measured liver stiffness must be decomposed into the static tissue/fibrosis-dependent stiffness and the dynamic pressure-dependent stiffness. This may explain some discordance in the liver stiffness measurement and biopsy-proven fibrosis stage found in some studies (29–32). The current study has removed the effect of fibrosis and has only measured the dynamic pressure-dependent stiffness.
The dynamic aspects of tissue stiffness determined by portal pressure cannot be detected by liver biopsy. However, their direct relation to the mechanical stretching of hepatic tissue, a stimulus of tissue/fibrosis deposition, could serve as a new marker of cellular changes within the liver because the observed dynamic components of liver stiffness may represent transient changes in the mechanical state of cells with contractile characteristics, such as vascular smooth muscle cells and activated hepatic stellate cells in the perisinusoidal spaces. Such research is now ongoing to definitively identify mechanotransduction pathways in hepatic stellate cells as well as other cells of the liver (33–36). It is unknown what potential role tissue stiffness may play in early fibrosis development since the early increase in tissue stiffness, which can be influenced by tissue tension, could lead to the first wave of hepatic stellate cell transdifferentiation. The mechanosensitive mechanism and recent insights about matrix stiffness as a potential determinant in liver development, fibrosis, regeneration, and malignancy have profound implications for the study of the liver and the diagnosis and treatment of liver disease.
Limitations of this study include conditional baseline calibrations, variability in the pressure measurements, the small number of animals and the lack of a definitive nonlinear or poroelastic model capable modeling the observed hepatic and splenic behavior. Both the calibrations and pressure measurements were performed outside the MR scanner room via a 10-meter-long piping system connected to the catheters in the scanner. Any overlooked bubbles or clamps in this very long piping system can affect the accuracy of baseline calibrations and the subsequent pressure measurements. An improper placement of the catheters (e.g., not placing them in the middle of the lumen but touching the vascular wall) can alter the pressure readings due to pulsation effects. This may explain the poor correlations observed with the portal pressure measurements in pig #3 while better correlations (R≥0.8) were found for the other individual stiffness-pressure relationships. This may also be why somewhat different relationships were found for each animal. While excellent correlation was observed between pressure and stiffness in these liver and spleen measurements, additional research is still required to determine an appropriate pressure-stiffness model for hepatic and splenic tissues.
In conclusion, these results provide strong evidence that MRE-assessed liver and spleen stiffness in an animal model of hypertension has a dynamic component that can increase significantly following an acute increase in portal pressure in a short time. The use of MRE to assess changes in tissue mechanics associated with the portal pressure could provide new insights into the development and pathophysiology of hepatic diseases. Diagnostic and longitudinal MRE studies should take into account these dynamic pressure effects on tissue stiffness to control for this variability in the measured stiffness and its diagnostic interpretation. Overall, the results also provide motivation for further research to develop a suitable empirical or analytic pressure-stiffness model that would allow MRE-based measurements of splenic stiffness to be used to derive a clinically-useful noninvasive estimate of portal venous pressure.
Acknowledgments
This work has been supported by NIH grant EB001981, Mayo CR20 and AHA 09POST2250081. The authors thank Joseph A. Rysavy and Diane M. Sauter for technical assistance.
References
- 1.Guturu P, Shah V. New insights into the pathobiology of portal hypertension. Hepatol Res. 2009;39(10):1016–1019. doi: 10.1111/j.1872-034X.2009.00553.x. [DOI] [PubMed] [Google Scholar]
- 2.Vorobioff JD. Hepatic venous pressure in practice: how, when, and why. Journal of clinical gastroenterology. 2007;41 (Suppl 3):S336–343. doi: 10.1097/MCG.0b013e31814684d3. [DOI] [PubMed] [Google Scholar]
- 3.Parikh S. Hepatic venous pressure gradient: worth another look? Digestive diseases and sciences. 2009;54(6):1178–1183. doi: 10.1007/s10620-008-0491-8. [DOI] [PubMed] [Google Scholar]
- 4.Berzigotti A, Piscaglia F. Ultrasound in portal hypertension--part 1. Ultraschall Med. 2011;32(6):548–568. doi: 10.1055/s-0031-1281856. quiz 569–571. [DOI] [PubMed] [Google Scholar]
- 5.Baik SK. Haemodynamic evaluation by Doppler ultrasonography in patients with portal hypertension: a review. Liver Int. 2010;30(10):1403–1413. doi: 10.1111/j.1478-3231.2010.02326.x. [DOI] [PubMed] [Google Scholar]
- 6.Muthupillai R, Lomas DJ, Rossman PJ, Greenleaf JF, Manduca A, Ehman RL. Magnetic resonance elastography by direct visualization of propagating acoustic strain waves. Science (New York, NY. 1995;269(5232):1854–1857. doi: 10.1126/science.7569924. [DOI] [PubMed] [Google Scholar]
- 7.Asbach P, Klatt D, Hamhaber U, et al. Assessment of liver viscoelasticity using multifrequency MR elastography. Magn Reson Med. 2008;60(2):373–379. doi: 10.1002/mrm.21636. [DOI] [PubMed] [Google Scholar]
- 8.Huwart L, Peeters F, Sinkus R, et al. Liver fibrosis: non-invasive assessment with MR elastography. NMR in biomedicine. 2006;19(2):173–179. doi: 10.1002/nbm.1030. [DOI] [PubMed] [Google Scholar]
- 9.Rouviere O, Yin M, Dresner MA, et al. MR elastography of the liver: preliminary results. Radiology. 2006;240(2):440–448. doi: 10.1148/radiol.2402050606. [DOI] [PubMed] [Google Scholar]
- 10.Salameh N, Peeters F, Sinkus R, et al. Hepatic viscoelastic parameters measured with MR elastography: correlations with quantitative analysis of liver fibrosis in the rat. J Magn Reson Imaging. 2007;26(4):956–962. doi: 10.1002/jmri.21099. [DOI] [PubMed] [Google Scholar]
- 11.Talwalkar JA, Yin M, Venkatesh S, et al. Feasibility of in vivo MR elastographic splenic stiffness measurements in the assessment of portal hypertension. AJR Am J Roentgenol. 2009;193(1):122–127. doi: 10.2214/AJR.07.3504. [DOI] [PMC free article] [PubMed] [Google Scholar]
- 12.Rockey DC. Noninvasive assessment of liver fibrosis and portal hypertension with transient elastography. Gastroenterology. 2008;134(1):8–14. doi: 10.1053/j.gastro.2007.11.053. [DOI] [PubMed] [Google Scholar]
- 13.Bureau C, Metivier S, Peron JM, et al. Transient elastography accurately predicts presence of significant portal hypertension in patients with chronic liver disease. Aliment Pharmacol Ther. 2008;27(12):1261–1268. doi: 10.1111/j.1365-2036.2008.03701.x. [DOI] [PubMed] [Google Scholar]
- 14.Millonig G, Friedrich S, Adolf S, et al. Liver stiffness is directly influenced by central venous pressure. Journal of hepatology. 52(2):206–210. doi: 10.1016/j.jhep.2009.11.018. [DOI] [PubMed] [Google Scholar]
- 15.Yin M, Talwalkar JA, Venkatesh SK, Ehman RL. MR Elastography of Dynamic Postprandial Hepatic Stiffness Augmentation in Chronic Liver Disease. Proceedings of the International Society for Magnetic Resonance in Medicine. Proceedings of the International Society for Magnetic Resonance in Medicine; Honolulu, Hawaii, USA. 2009. p. 110. [Google Scholar]
- 16.Mederacke I, Wursthorn K, Kirschner J, et al. Food intake increases liver stiffness in patients with chronic or resolved hepatitis C virus infection. Liver Int. 2009;29(10):1500–1506. doi: 10.1111/j.1478-3231.2009.02100.x. [DOI] [PubMed] [Google Scholar]
- 17.Hines CD, Lindstrom MJ, Varma AK, Reeder SB. Effects of postprandial state and mesenteric blood flow on the repeatability of MR elastography in asymptomatic subjects. J Magn Reson Imaging. 2011;33(1):239–244. doi: 10.1002/jmri.22354. [DOI] [PubMed] [Google Scholar]
- 18.Rotemberg V, Palmeri M, Nightingale R, Rouze N, Nightingale K. The impact of hepatic pressurization on liver shear wave speed estimates in constrained versus unconstrained conditions. Physics in medicine and biology. 2012;57(2):329–341. doi: 10.1088/0031-9155/57/2/329. [DOI] [PMC free article] [PubMed] [Google Scholar]
- 19.Guyton AC. A concept of negative interstitial pressure based on pressures in implanted perforated capsules. Circulation research. 1963;12:399–414. doi: 10.1161/01.res.12.4.399. [DOI] [PubMed] [Google Scholar]
- 20.Guyton AC. Pressure-volume relationships in the interstitial spaces. Investigative ophthalmology. 1965;4(6):1075–1084. [PubMed] [Google Scholar]
- 21.Najafi H, Battung V, Sarfatis P, Hirose M, DeWall RA. Hemodynamic changes associated with total body perfusion. The Journal of thoracic and cardiovascular surgery. 1966;51(4):590–596. [PubMed] [Google Scholar]
- 22.Manduca A, Oliphant TE, Dresner MA, et al. Magnetic resonance elastography: non-invasive mapping of tissue elasticity. Med Image Anal. 2001;5(4):237–254. doi: 10.1016/s1361-8415(00)00039-6. [DOI] [PubMed] [Google Scholar]
- 23.Manduca A, Lake DS, Kruse SA, Ehman RL. Spatio-temporal directional filtering for improved inversion of MR elastography images. Med Image Anal. 2003;7(4):465–473. doi: 10.1016/s1361-8415(03)00038-0. [DOI] [PubMed] [Google Scholar]
- 24.Yin M, Talwalkar JA, Glaser KJ, et al. Assessment of hepatic fibrosis with magnetic resonance elastography. Clinical Gastroenterology and Hepatology. 2007;5(10):1207–1213. doi: 10.1016/j.cgh.2007.06.012. [DOI] [PMC free article] [PubMed] [Google Scholar]
- 25.Huwart L, Sempoux C, Vicaut E, et al. Magnetic resonance elastographyfor the noninvasive staging of liver fibrosis. Gastroenterology. 2008;135(1):32–40. doi: 10.1053/j.gastro.2008.03.076. [DOI] [PubMed] [Google Scholar]
- 26.Yin M, Chen J, Glaser KJ, Talwalkar JA, Ehman RL. Abdominal magnetic resonance elastography. Top Magn Reson Imaging. 2009;20(2):79–87. doi: 10.1097/RMR.0b013e3181c4737e. [DOI] [PMC free article] [PubMed] [Google Scholar]
- 27.Arena U, Vizzutti F, Corti G, et al. Acute viral hepatitis increases liver stiffness values measured by transient elastography. Hepatology. 2008;47(2):380–384. doi: 10.1002/hep.22007. [DOI] [PubMed] [Google Scholar]
- 28.Sagir A, Erhardt A, Schmitt M, Haussinger D. Transient elastography is unreliable for detection of cirrhosis in patients with acute liver damage. Hepatology. 2008;47(2):592–595. doi: 10.1002/hep.22056. [DOI] [PubMed] [Google Scholar]
- 29.Kim SU, Seo YS, Cheong JY, et al. Factors that affect the diagnostic accuracy of liver fibrosis measurement by Fibroscan in patients with chronic hepatitis B. Alimentary pharmacology & therapeutics. 32(3):498–505. doi: 10.1111/j.1365-2036.2010.04353.x. [DOI] [PubMed] [Google Scholar]
- 30.Wong VW, Vergniol J, Wong GL, et al. Diagnosis of fibrosis and cirrhosis using liver stiffness measurement in nonalcoholic fatty liver disease. Hepatology (Baltimore, Md. 51(2):454–462. doi: 10.1002/hep.23312. [DOI] [PubMed] [Google Scholar]
- 31.Calvaruso V, Camma C, Di Marco V, et al. Fibrosis staging in chronic hepatitis C: analysis of discordance between transient elastography and liver biopsy. Journal of viral hepatitis. 17(7):469–474. doi: 10.1111/j.1365-2893.2009.01199.x. [DOI] [PubMed] [Google Scholar]
- 32.Lucidarme D, Foucher J, Le Bail B, et al. Factors of accuracy of transient elastography (fibroscan) for the diagnosis of liver fibrosis in chronic hepatitis C. Hepatology. 2009;49(4):1083–1089. doi: 10.1002/hep.22748. [DOI] [PubMed] [Google Scholar]
- 33.Tomasek JJ, Gabbiani G, Hinz B, Chaponnier C, Brown RA. Myofibroblasts and mechano-regulation of connective tissue remodelling. Nat Rev Mol Cell Biol. 2002;3(5):349–363. doi: 10.1038/nrm809. [DOI] [PubMed] [Google Scholar]
- 34.Li Z, Dranoff JA, Chan EP, Uemura M, Sevigny J, Wells RG. Transforming growth factor-beta and substrate stiffness regulate portal fibroblast activation in culture. Hepatology. 2007;46(4):1246–1256. doi: 10.1002/hep.21792. [DOI] [PubMed] [Google Scholar]
- 35.Buxboim A, Ivanovska IL, Discher DE. Matrix elasticity, cytoskeletal forces and physics of the nucleus: how deeply do cells ‘feel’ outside and in? Journal of cell science. 123(Pt 3):297–308. doi: 10.1242/jcs.041186. [DOI] [PMC free article] [PubMed] [Google Scholar]
- 36.Wells RG, Discher DE. Matrix elasticity, cytoskeletal tension, and TGF-beta: the insoluble and soluble meet. Sci Signal. 2008;1(10):pe13. doi: 10.1126/stke.110pe13. [DOI] [PMC free article] [PubMed] [Google Scholar]