

Abstract
Design and Methods
Skeletal muscle adipose tissue (AT) infiltration (myosteatosis) increases with aging and may contribute to the development of type 2 diabetes mellitus (T2DM). It remains unclear if myosteatosis is associated to glucose and insulin homeostasis independent of total and central adiposity. We evaluated the association between intermuscular AT (IMAT) in the abdominal skeletal muscles (total, paraspinal and psoas) and fasting serum glucose, insulin, and homeostasis model assessment of insulin resistance (HOMA-IR) in 393 non-diabetic Caucasian men aged 65+. Abdominal IMAT, visceral (VAT) and subcutaneous (SAT) AT (cm3) were measured by quantitative computed tomography at the L4-L5 intervertebral space.
Results
In age, study site, height and muscle volume adjusted regression analyses, total abdominal and psoas (but not paraspinal) IMAT were positively associated with glucose, insulin and HOMA-IR (all P < 0.003). The associations between total abdominal and psoas IMAT and insulin and HOMA-IR remained significant after further adjusting for lifestyle factors, as well as DXA total body fat, VAT or SAT in separate models (all P <0.009).
Conclusions
Our study indicates a previously unreported, independent association between abdominal myosteatosis and hyperinsulinemia and insulin resistance among older Caucasian men. These associations may be specific for particular abdominal muscle depots, illustrating the potential importance of separately studying specific muscle groups.
Keywords: Myosteatosis, intermuscular fat, skeletal muscle, fat distribution, insulin, insulin resistance
Introduction
Emerging evidence indicates that, independent of general obesity, adipose tissue (AT) infiltration in skeletal muscle (known as myosteatosis) is an important fat depot which increases with aging, and is associated with higher levels of fasting glucose and insulin, and a greater prevalence of type 2 diabetes mellitus (T2DM) and insulin resistance [1–7]. Myosteatosis may contribute to glucose and insulin abnormalities by impairing insulin action and insulin diffusion capacity, and inducing changes in local muscle metabolism and insulin sensitivity [6, 8].
Most studies to date that examined myosteatosis have evaluated thigh or the calf muscle [6]. Thus, our knowledge of myosteatosis in relation to insulin and glucose is incomplete. Studies examining the possible association of abdominal myosteatosis and myosteatosis in specific abdominal muscle groups with glucose and insulin homeostasis are lacking. Moreover, it is still unclear whether associations of myosteatosis with insulin resistance or levels of glucose and insulin are independent of other AT depots known to be associated with glucose, insulin and insulin resistance, including abdominal visceral and subcutaneous adiposity [9].
We addressed the question of whether abdominal muscle myosteatosis is related to glucose, insulin and insulin resistance in a cohort of elderly men without T2DM who had abdominal imaging and fasting insulin and glucose levels. Our objectives were to: 1) quantify the association of intermuscular AT (i.e. AT beneath the fascia) in all abdominal muscles with glucose, insulin and insulin resistance; 2) determine the association of intermuscular AT in specific abdominal muscle groups (paraspinal and psoas) with glucose, insulin and insulin resistance, and; 3) test if the observed associations are independent of total body, visceral and subcutaneous adiposity.
Materials and Methods
Study population
The Osteoporotic Fractures in Men (MrOS) Study is a prospective multi-center study that enrolled 5994 men aged 65 years and older from 6 geographic regions (Birmingham, AL; Minneapolis, MN; Palo Alto, CA; Pittsburgh, PA; Portland, OR; and San Diego, CA) in the US between March 2000 and April 2002. Details of the study have been previously described [10]. The study was designed to determine risk factors for bone loss, fractures and other conditions of aging among elderly men. To participate in MrOS, men had to be able to walk without assistance from another person, and could not have had a bilateral hip replacement surgery. Men were recruited primarily through community-based mailing lists. Advertisements in local and senior newspapers and presentations to community groups were used to supplement recruitment efforts. The study was approved by the Institutional Review Boards at all study sites, and written informed consent was obtained from participants prior to data collection.
Selection for QCT scanning at baseline
Quantitative computed tomography (QCT) is considered a gold standard for assessing adipose tissue distribution in the subcutaneous and visceral compartments [9] and provides valid measurements of skeletal muscle [11]. The MrOS QCT cohort was comprised of 3786 (or 63% of the parent cohort) who were referred for hip and lumbar spine scans as part of their baseline visit as described previously [12]. All QCT scans were obtained using a standardized protocol. Men were scanned in the supine position and a calibration standard was scanned with each man. For the abdominal QCT scans, the region of interest encompassed the mid-L3 to the mid-L5 vertebra, which was scanned at settings of 90 kVp, 140 mA, and 512 × 512 matrix in spiral reconstruction mode.
QCT abdominal body composition reading was later proposed and funded to investigate its relationship with different aging-related end points. Due to the relatively high cost to perform QCT image analysis, a random sample of the QCT cohort was targeted for abdominal body composition assessments. Our sampling strategy was performed as follows. Within the cohort, biologic assays including insulin and glucose had been performed in a random sample of 1,000 men prior to our funding for abdominal body composition measurement. To make efficient use of biologic and imaging resources, we selected the 667 men who had abdominal QCT in this original random sample. Within this sample, abdominal scans were unavailable for 18 men, bringing the total number of QCT abdominal scans available for image processing to 649.
Measurements of abdominal adipose and muscle volumes from QCT scans
The 649 abdominal scans were processed on workstations equipped with sensitive digitizing pens (Wacom Technology Corp., Vancouver, WA) and Analyze biomedical imaging software (AnalyzeDirect Inc., Overland Park, KS). Image processing was completed by two readers at Oregon Health & Science University in Portland using a standardized protocol. The image processing protocol described below produced volumes of subcutaneous AT, visceral AT, total abdominal skeletal muscle, psoas muscle and paraspinal muscle (Figure 1). Inter- and intra-reader reliability were monitored throughout image processing with intraclass correlations coefficients (ICC). Final ICCs were all ≥0.94 for each tissue measure.
Figure 1. Representation of abdominal adiposity measures derived from computed tomography scans in the MrOS cohort.
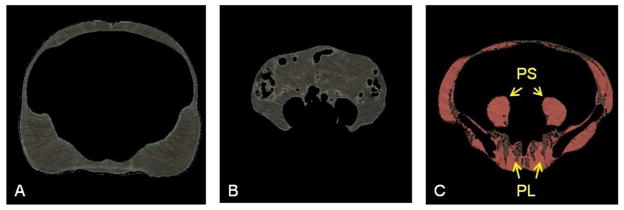
The morphologically discrete tissues measured during image processing are: A. subcutaneous adipose tissue which lies between the dermis and the fascia of the abdominal muscles; B. visceral adipose tissue which forms around the internal organs in the visceral cavity; and C. abdominal skeletal muscle (colored pink) and intermuscular adipose tissue (colored brown). The specific muscle groups denoted by yellow arrows are psoas muscles (PS) (lateral to the vertebral body) and paraspinal muscles (PL) (posterior to the vertebral body).
In the available scans, the 5-mm slice at L4-5 intervertebral space was identified, verified on the scout view, and extracted from the scan series for processing. To account for variation between scanners used at the enrollment sites, we rescaled the native Hounsfield units (HU) in each scan so that an average of 0 HU was obtained for the 0mg/cm3 hydroxyapatite portion of the calibration standard. Voxels within the slice were then separated into color-coded objects containing adipose tissue (−190 to −30 HU) [13, 14] and muscle (0 to 100 HU) [15, 16]. The fascial borders of the skeletal muscles were traced manually and segmented out of the image. A closed contour was then drawn in the space created by removal of the skeletal muscle wall. Subcutaneous adipose tissue (SAT) was defined as voxels outside of the contour and with HU in the range for adipose tissue (Figure 1). Visceral adipose tissue (VAT) was defined as voxels within the contour and with HU in the adipose tissue range (Figure 1). For each depot, volumes (cm3) were computed automatically by the software as the number of voxels multiplied by the voxel volume.
Following measurement of the AT depots, we conducted further processing to produce the muscle measures. In the image obtained from muscle segmentation, we inactivated all voxels within the vertebral body or iliac crest. Total abdominal muscle was defined from the remaining voxels with HU in the ranges for muscle or adipose tissue. Total volumes of all abdominal skeletal muscle, and of the psoas and paraspinal muscle groups separately, are computed as the sum of the muscle tissue and the intermuscular adipose tissue (IMAT) volumes [15]. The IMAT volume was computed for each muscle group (Figure 1).
During image processing, a total of 75 (12%) scans failed processing because part of the abdomen or the calibration standard was outside the field of view (n=53) or the scan did not contain the appropriate region of interest (n=22). In another 28 (4%) scans, not all measures could be produced because fascial borders were obscured by beam hardening artifact (n=20), movement during the scan (n=7), or other reason (n=1). Thus, complete abdominal AT and muscle measures were produced for 546 (82%) of the original random sample. Importantly, there were no differences in total body fat, glucose or insulin levels between men whose QCT scans could not be processed and the men whose QCT scans were successfully processed.
Other Baseline Measures
Height was measured with wall-mounted Harpenden stadiometers, and weight was measured on standard balance beam or digital scales using standard protocols. Whole body scan DXA measurements were performed using a Hologic QDR 4500W densitometer (Hologic Inc., Bedford MA), and using a uniform procedure that included centralized standardization and monitoring of quality. Scans were analyzed with QDR software version 8.26a. Information on lifestyle habits (current smoking, alcohol use, and physical activity), demographic information, and medical conditions were assessed using self-administered questionnaires. Alcohol use was categorized as <14 (low/moderate use) and ≥14 (high use) drinks per week. Physical activity was measured by the Physical Activity Scale for the Elderly (PASE) (unitless relative measure of physical activity) which measures total, occupational, household, and leisure physical activities over the previous seven days. Participants were instructed to bring in all prescription medications taken in the past 30 days to their clinic visit, and study coordinators recorded the medications and data were stored in an electronic medications inventory database (San Francisco Coordinating Center, San Francisco, CA). The Iowa Drug Information Service Drug Vocabulary (College of Pharmacy, University of Iowa, Iowa City, IA) was used to identify ingredient(s) in the medications [17]. Fasting morning serum samples were collected at baseline and stored at −70 °Celsius. Previously unthawed serum was assayed for glucose using a hexokinase method and insulin using a two-site immune-enzymometeric assay with auto-analyzers (Northwest Lipid Metabolism and Diabetes Research Laboratories, Seattle, WA). Inter-assay coefficients of 111 variation (CV) based on blind duplicates was <3% for glucose and <10% for insulin. The degree of insulin resistance was estimated by the homeostatic model assessment (HOMA-IR) according to the method described by Matthews et al [18]. T2DM was defined as fasting serum glucose ≥126mg/dl or current use of diabetes medication(s). Obesity was defined as BMI ≥30 kg/m2.
Statistical methods
Before analysis, we further excluded men with T2DM (n=51), non-white men (n=44), men who were missing DXA measures (n=39), or metabolic assay data (n=19) from the 546 men with complete abdominal AT and muscle measures, leaving an analytic cohort of 393 Caucasian men. Since African and Asian ancestry individuals have more intermuscular AT compared to Caucasians, even after adjustment for differences in total adiposity and lifestyle factors [19–22], and because of the sample size of nonwhite men with available QCT scans was too small to enable meaningful analyses, we excluded non-white men.
Analysis of covariance (ANCOVA) was conducted using the general linear model procedure (GLM) to test for differences in adjusted mean characteristics of men by 5-year age groups. Spearman correlation coefficients among total body, visceral and subcutaneous adiposity and abdominal IMAT volumes were calculated and are shown in Table 2. Prior to the regression analysis we examined multi-collinearity by assessing the variance inflation factor (VIF). A VIF greater than 2.5 for the linear regression model was used as an indicator of multi-collinearity. None of the VIF values for our variables in any of the models exceeded the value of 2.5. Using multivariable linear regression analysis, we estimated the extent to which insulin, glucose or the HOMA-IR were associated with total abdominal, paraspinal and psoas IMAT volume. Separate models were fit for each metabolic measure as the dependent variable. The relationships between abdominal muscle IMAT and T2DM related biomarkers were expressed as percent increase in fasting glucose, insulin and insulin resistance per 1 SD increase in mean values of abdominal muscle IMAT volumes, along with 95% confidence intervals (CIs). The formula used to calculate the percent difference in metabolic measures per SD change of abdominal muscle IMAT was as follows: [(b coefficient X SD)/mean metabolic measure] X 100. The corresponding CIs were calculated as follows: {[(b coefficient ± 1.96 X SE) X SD]/mean metabolic measure} X 100]. Model fitting proceeded as follows. Initial analyses were adjusted for age, study site, height and muscle volume (model 1). We further added potentially important lifestyle factors (PASE score as a measure of physical activity, current smoking, and current alcohol use) into the analysis (model 2). To address whether the association of abdominal myosteatosis and metabolic risk factors exceeds that of total or central adiposity, analyses were further adjusted for DXA total body fat percent (model 3), visceral AT (model 4), DXA total body fat percent and visceral AT (model 5) and subcutaneous AT (model 6). The Statistical Analysis System (SAS, version 9.1.2.; SAS Institute, Cary, NC) was used for statistical analysis.
Table 2.
Interrelationship of all adiposity measures used in our analyses (spearman correlation coefficients)
| Total Body Fat (%) | Visceral AT Volume (cm3) | Subcutaneous AT Volume (cm3) | Abdominal Muscle IMAT Volume (cm3) | Paraspinal IMAT Volume (cm3) | Psoas IMAT Volume (cm3) | |
|---|---|---|---|---|---|---|
| Total Body Fat (%) | ||||||
| Visceral AT Volume (cm3) | 0.56 c | |||||
| Subcutaneous AT Volume (cm3) | 0.77 c | 0.41 c | ||||
| Abdominal Muscle | ||||||
| IMAT Volume (cm3) | 0.47 c | 0.41 c | 0.27 c | |||
| Paraspinal IMAT Volume (cm3) | 0.24 c | 0.28 c | 0.12 a | 0.73 c | ||
| Psoas IMAT Volume (cm3) | 0.34 c | 0.26 c | 0.15 b | 0.73 c | 0.30 c | |
p<0.05;
p <=0.01;
p<=0.0001
Results
Table 1 shows the characteristics of 393 men. The mean age was 74 years. Participants were slightly overweight on average (BMI 26.6 kg/m2). Around 13% of the men were obese (BMI of ≥30 kg/m2).
Table 1.
Subject Characteristics (N=393)
| Characteristics | Mean ± SD or N (%) |
|---|---|
| Age (years) | 74.3 ± 5.9 |
| BMI (kg/m2) | 26.6 ± 3.0 |
| DXA Total % Fat | 25.8 ± 5.2 |
| PASE SCORE | 149.8 ± 67.9 |
| Currently Smoke (%) | 16 (4.1) |
| Alcohol Intake (%) ≥ 14 drinks/week | 53 (13.5) |
| Obesity a (%) | 52 (13.2) |
| Fasting serum glucose (mg/dl) | 98.8 ± 9.8 |
| Insulin (uIU/mL) | 8.3 ± 5.0 |
| HOMA-IR | 2.1 ± 1.4 |
| Visceral AT volume (cm3) | 66.3 ± 25.3 |
| Subcutaneous AT volume (cm3) | 92.9 ± 32.0 |
| Abdominal Muscle IMAT Volume (cm3) | 15.8 ± 6.0 |
| Abdominal Muscle Volume (cm3) | 48.0 ± 10.2 |
| Paraspinal IMAT Volume (cm3) | 6.6 ± 2.7 |
| Paraspinal Muscle Volume (cm3) | 12.0 ± 3.4 |
| Psoas IMAT Volume (cm3) | 1.1 ± 0.9 |
| Psoas Muscle Volume (cm3) | 10.0 ± 3.2 |
BMI ≥30 kg/m2
Table 2 shows correlation coefficients between total body, visceral and subcutaneous adiposity and abdominal IMAT volumes used in our analyses. All the correlation coefficients were positive and significant (All P ≤0.02). The majority of the adiposity phenotypes demonstrated moderate to high correlation (r=0.24 to 0.77), except for the weaker correlation between SAT and paraspinal IMAT (r=0.12, P=0.02), and between SAT and psoas IMAT (r=0.15, P=0.003).
We further examined the mean values of QCT abdominal intermuscular adiposity variables by 5-year age-groups while adjusting for study site, height, muscle volume, and DXA total body fat percent (Table 3). Total abdominal and paraspinal IMAT volumes increased with advancing age (both P ≤0.003). In contrast, psoas IMAT showed no differences across the age groups.
Table 3.
QCT measured abdominal myosteatosis measures across 5-year age-groups (N=393)
| Age group (years)
|
P Value for Trend | ||||
|---|---|---|---|---|---|
| 65 – 69 (N = 102) | 70 – 74 (N = 105) | 75 – 79 (N = 112) | 80+ (N = 74) | ||
| Abdominal Muscle IMAT Volume *(cm3) | 15.3 (14.4,16.1) | 15.3 (14.4,16.1) | 15.9 (15.0,16.7) | 17.6 (16.6,18.6) | 0.003 |
| Paraspinal IMAT Volume ** (cm3) | 5.8 (5.3,6.2) | 6.3 (5.9,6.8) | 6.7 (6.2,7.1) | 7.9 (7.3,8.4) | <0.0001 |
| Psoas IMAT Volume ***(cm3) | 1.3 (1.1,1.4) | 1.1 (1.0,1.2) | 1.1 (1.0,1.3) | 1.1 (1.0,1.2) | 0.09 |
Values are means (95% CI) adjusted for study site, height, muscle volume (*abdominal, **paraspinal or ***psoas), and DXA total body fat percent
The results from multiple regression analyses are shown in Table 4. After adjusting for age, study site, height, and corresponding muscle volume, total abdominal and psoas IMAT volumes were positively associated with fasting glucose, insulin and HOMA-IR (all P≤0.004). Paraspinal muscle IMAT volume was not associated with any of the T2DM related biomarkers. The directions and strength of these associations remained very similar after additionally including physical activity, current smoking, and current alcohol intake into the models (all P≤0.003). We further tested for the relation between abdominal IMAT volumes and the T2DM related biomarkers independent of total and central adiposity. The association between total abdominal and psoas IMAT with fasting glucose levels was in general weaker than an association with insulin and HOMA-IR, and disappeared after including total body fat percent or VAT as a covariate. Total abdominal and psoas muscle IMAT volumes remained positively associated with fasting insulin and HOMA-IR (all P≤0.009) independent of total, visceral and subcutaneous adiposity, added as covariates in three separate models. For example, independent of total body fat percent, each SD (6.1 cm3) increase in total abdominal muscle IMAT was associated with 14.5% and 15.8% greater insulin and HOMA-IR, respectively. Similarly, independent of total body fat percent, each SD (0.9 cm3) increase in psoas IMAT was associated with 19.9% and 21.9% greater insulin and HOMA-IR, respectively. There remained a significant association between total abdominal and psoas IMAT volumes and insulin and HOMA-IR after adjusting for visceral adiposity (all P≤0.009), but slightly attenuated in case of total abdominal IMAT. Independent of visceral adiposity, each SD (6.1 cm3) increase in total abdominal muscle IMAT was associated with 11.6% and 12% greater insulin and HOMA-IR, respectively, whereas each SD (0.9 cm3) increase in psoas IMAT was associated with 19.2% and 20.7% greater insulin and HOMA-IR, respectively. To examine whether the effects of abdominal IMAT volumes on insulin and HOMA-IR are due to both total body and visceral adiposity or to just one (total or visceral adiposity) we added a model with both VAT and total body fat percent (Table 4, Model 5). We observed a slight attenuation of the association between both total abdominal and psoas IMAT volumes with fasting insulin and HOMA-IR (all P≤0.05). For example, independent of both total body fat and visceral adiposity, each SD (6.1 cm3) increase in total abdominal muscle IMAT was associated with 8.7% and 9.1% greater insulin and HOMA-IR, respectively, whereas each SD (0.9 cm3) increase in psoas IMAT was now associated with 16.4% and 17.9% greater insulin and HOMA-IR, respectively.
Table 4.
Percent increase in fasting glucose and insulin levels and HOMA-IR per 1 SD (95% CI) increase in total abdominal, paraspinal and psoas intermuscular adipose tissue
| Mean | SD | ||||
|---|---|---|---|---|---|
|
| |||||
| Abdominal Muscle IMAT Volume * | 15.8 cm3 | 6.0 cm3 | Glucose | Insulin | HOMA-IR |
| Model 1 | 2.2 c (0.9, 3.6) | 23.7 d (15.6, 31.7) | 25.7 d (17.0, 34.4) | ||
| Model 2 | 2.3 c (0.90, 3.7) | 23.7 d (15.7, 31.6) | 25.7d (17.1, 34.4) | ||
| Model 3 | 1.4 (−0.09, 2.9) | 14.5 c (61.1, 22.8) | 15.8 c (6.7, 24.9) | ||
| Model 4 | 0.67 (−0.80, 2.2) | 11.6 b (3.3, 19.9) | 12.0 b (3.0, 21.0) | ||
| Model 5 | 0.5 (−0.99, 2.0) | 8.7 a (0.35, 17.3) | 9.1 a (0.01, 18.2) | ||
| Model 6 | 1.7 (0.26, 3.1) a | 18.3 d (10.1, 26.4) | 20.0 d (11.1, 28.8) | ||
|
| |||||
| Paraspinal IMAT Volume** | 6.6 cm3 | 2.7 cm3 | Glucose | Insulin | HOMA-IR |
|
| |||||
| Model 1 | 0.36 (−0.7, 1.4) | 3.5 (−3.1, 10.1) | 3.7 (−3.5, 10.9) | ||
| Model 2 | 0.36 (−0.7, 1.5) | 4.1 (−2.4, 10.6) | 4.2 (−2.9, 11.3) | ||
| Model 3 | −0.12 (−1.2, 0.98) | −0.64 (−6.9, 5.6) | −0.92 (−7.7, 5.9) | ||
| Model 4 | −0.41 (−1.5, 0.7) | −2.2 (−8.3, 3.9) | −2.8 (−9.4, 3.8) | ||
| Model 5 | −0.46 (−1.5, 0.62) | −3.0 (−9.1, 3.0) | −3.7 (−10.2, 2.9) | ||
| Model 6 | 0.10 (−0.99, 1.2) | 1.7 (−4.6, 8.0) | 1.6 (−5.2, 8.5) | ||
|
| |||||
| Psoas IMAT Volume*** | 1.1 cm3 | 0.9 cm3 | Glucose | Insulin | HOMA-IR |
|
| |||||
| Model 1 | 2.3 b (0.7, 3.8) | 30.4 d (21.4, 39.5) | 33.1 d (23.3, 42.9) | ||
| Model 2 | 2.4 b (0.8, 3.9) | 28.9 d (19.9, 38.0) | 31.7 d (21.8, 41.5) | ||
| Model 3 | 1.5 (−0.2, 3.1) | 19.9 d (10.7, 29.2) | 21.9 d (11.8, 32.0) | ||
| Model 4 | 1.1 (−0.5, 2.7) | 19.2 d (10.4, 28.1) | 22.0 d (11.1, 30.3) | ||
| Model 5 | 0.96 (−0.7, 2.6) | 16.4 c (7.3, 25.5) | 17.9 c (8.1, 27.7) | ||
| Model 6 | 1.8 a (0.2, 3.4) | 23.9 d (14.9, 33.0) | 26.3 d (16.4, 36.2) | ||
Bold indicates p < 0.05
p <0.05;
p <=0.01;
p<=0.001;
p<=0.0001
Model 1 (basic model) = adjusted for age, study site, height and skeletal muscle volume (*abdominal, **paraspinal or ***psoas)
Model 2=model 1 + PASE score, current smoking, current alcohol intake ≥ 14 drinks/week
Model 3= model 2 + DXA total body fat
Model 4=model 2+ visceral AT
Model 5= model 2 + visceral AT + DXA total body fat
Model 6 =model 2+ subcutaneous AT
Finally, we repeated the analyses of psoas IMAT volume association with metabolic measures after further adjusting for total abdominal IMAT (data not shown). The association between the psoas IMAT volume and fasting insulin and HOMA-IR remained positive and significant (all P≤0.002) and very similar to the association observed in Table 4. For example, independent of total body fat percent, visceral adiposity, and total abdominal IMAT volume, each SD (0.9 cm3) increase in psoas IMAT was associated with 16.7% and 18.4% greater insulin and HOMA-IR, respectively.
Discussion
In this study, we comprehensively assessed adipose tissue infiltration in abdominal skeletal muscle groups (i.e. abdominal myosteatosis) using QCT, and examined its association with fasting glucose, insulin, and insulin resistance among older Caucasian men without T2DM. Our study describes a previously unrecognized association between abdominal myosteatosis and hyperinsulinemia and also between abdominal myosteatosis and insulin resistance. For the first time we report that the association between myosteatosis and insulin and insulin resistance is independent of total body fat, visceral or subcutaneous adiposity. Moreover, we found that these relationships may be specific for particular abdominal muscle groups, illustrating the potential importance of separately studying myosteatosis in specific muscle groups.
Based on previous studies, there is consistent evidence that both intra- and inter- muscular fat in leg skeletal muscles are significantly associated with glucose and insulin abnormalities. Earlier studies have reported a positive association between intramyocellular fat and insulin resistance among obese, older, sedentary lean and diabetic individuals [23], as well as among healthy individuals [24]. Goodpaster et al. have reported a positive association between intermuscular fat measured in the mid-thigh and T2DM among 2964 elderly men and women [3]. Another study conducted in 1249 middle-aged and older men of African ancestry reported intermuscular fat, measured in the calf, to be positively associated with T2DM, independent of total adiposity, even in a subset of lean men [7]. A study of 249 Caucasian men and women has recently reported that intermuscular fat is associated with insulin resistance in both genders [1]. A positive association of intermuscular fat with insulin and insulin resistance [1], and with T2DM [2] has been reported in a few other small studies. Whether the relation of myosteatosis with insulin and insulin resistance is part of the causal link between myosteatosis and T2DM remains to be established in large longitudinal studies.
Although, our understanding of the mechanisms linking myosteatosis, and in particular, intermuscular AT with hyperinsulinemia and insulin resistance, is still very limited, some have proposed that intermuscular AT may impair nutritive blood flow to muscle, and thus, contribute to insulin resistance by impairing insulin action and insulin diffusion capacity [25]. Another possible mechanism linking intermuscular AT with hyperinsulinemia and insulin resistance may be through impaired secretion of adipokines [26]. Increased accumulation of intermuscular AT could induce changes in muscle metabolism and insulin sensitivity via local secretion of inflammatory adipokines from fat cells surrounding muscle fibers [26].A recent study reported that increased number of intermuscular adipocytes has a direct local impact on skeletal myocyte metabolism, causing increased myotube mRNA expression of genes involved in oxidative metabolism, and thus, influencing metabolic outcomes [8]. The study suggests that even the relatively small amount of intermuscular AT may be sufficient to drive myotubes into lipid oxidation and affect muscle metabolism locally. While more studies are needed to elucidate the molecular connection between increased intermuscular AT and muscle metabolic dysfunction, these recent findings support the hypothesis that even a relatively small amount of adipose tissue located in the skeletal muscle may be sufficient to affect muscle metabolism locally.
The observation of previous studies that CT measures of abdominal myosteatosis seem to be only moderately correlated with CT measures of thigh myosteatosis [27] prompted us to examine the link between abdominal myosteatosis in separate muscle groups and glucose, insulin, and insulin resistance. After taking into consideration total and central adiposity measures, as well as myosteatosis of the total abdominal muscle, we were further able to confirm a positive independent association between psoas myosteatosis and hyperinsulinemia and insulin resistance, but we found no such association with paraspinal myosteatosis. Similar to the findings from our study, a positive association between psoas myosteatosis and hyperinsulinemia and insulin resistance was previously described in HIV-positive patients with lipodystrophy [28]. Although adipose tissue content of paraspinal muscles has been explored, all of the previous studies have tested the association with chronic lower back pain and low back stability [29], and not with metabolic disorders. A study in 333 patients with nonalcoholic fatty liver disease has shown that CT measured myosteatosis in the paraspinal muscles is strongly associated with liver steatosis and may actually reflect the severity of the disorder [30], however, the association with glucose and insulin was not described.
A significant association between psoas, but not paraspinal myosteatosis, and fasting insulin levels as well as insulin resistance, illustrate that AT content in different depots may differ. Previous small reports have suggested that a correlation of AT content in various non-adipose tissues, such as between the AT depots in the liver, pancreas and heart may not always be strong [31, 32], and that their individual relationship with metabolic disturbances may differ [33]. The results of previous studies, in addition to our findings, suggest that it is possible that the clinical consequences of AT depots depend on the function of the organ, and could vary by anatomical region. The psoas and paraspinal muscles indeed have different functions, and also different skeletal muscle morphology [34, 35]. The psoas muscle covers the anterolateral aspects of the lumbar spine and inserts on the femur, and acts as a flexor for the lumbar spine, rotator of the thigh, and as a hip flexor [35]. Lumbar paraspinal muscles are located on each side of the lumbar spine, attached to the vertebrae, providing necessary levels of trunk stability and trunk movement, and assisting in extension and lateral flexion of the spine [34]. Furthermore, AT content of the muscle vary with fiber type, with type I muscle fibers having a 2–3 times greater fat content than type II fibers in physiologic conditions [34]. Additionally, type I muscle fibers are more insulin sensitive than type II muscle fibers [36], and the distribution of muscle fiber types across various skeletal muscles in T2DM individuals is shifted toward faster, type II muscle fibers [37]. A recent study conducted in patients undergoing spinal surgery has shown that the lumbar paraspinal muscles are composed of relatively high percent of insulin sensitive type I fibers (63%), compared to type IIA (19%) and type IIB (18%) fibers, consistent with a postural function [38]. In contrast, compared to paraspinal muscles, the psoas muscle was found to be composed of a lower percentage of type I fibers (42%) and a higher percentage of type IIA (33%) and IIB fibers (26%), similar to the appendicular muscles. We speculate that due to a different function and morphology of psoas and paraspinal muscles, increased AT infiltration in paraspinal muscles may be found in normal physiologic conditions and may not have a harmful effect on metabolic risk factors as increased AT infiltration in psoas muscle has.
Our results also support the hypothesis that remodeling of AT distribution in abdominal muscles occurs with advancing age, independent of total body fat and muscle volume. Total abdominal and paraspinal increased across age groups, while psoas IMAT remained similar across age groups. The observation that abdominal IMAT increases across age groups, is in agreement with a previous large longitudinal study of myosteatosis in leg muscles, which reported an increase in thigh intermuscular AT with aging in older men and women, irrespective of changes in weight [39]. Similar to our findings, it was previously shown that paraspinal muscle volume uniformly decreases, and paraspinal myosteatosis increases with age [40]. In contrast, although psoas muscle also declined in volume with age, this was not accompanied with a corresponding increase in myosteatosis [40]. Future longitudinal studies are needed to better delineate the effects of aging on AT infiltration in the abdominal skeletal muscles.
The present study has some limitations. First, our study was cross-sectional in design and our analyses may be subject to the limitations of cross-sectional studies such as cohort effects and biases introduced by selective survivorship. A longitudinal study is critically needed to delineate the effects of AT infiltration in the skeletal muscle on metabolic risk factors, and the effects of aging on AT infiltration in the abdominal skeletal muscles. Second, our findings may not apply to younger men, younger and older women, and other ethnicities. Third, as we only had measures of fasting glucose and not 2-hour oral glucose tolerance test we were not able to exclude everyone with T2DM. Fourth, we used the homeostasis model assessment for insulin resistance (HOMA-IR), which is not as accurate as the hyperinsulinemic-euglycemic clamp for assessment of insulin sensitivity. As we had no clinical measures of insulin sensitivity in the abdominal muscles under study, but rather just an estimate of an overall insulin resistance as assessed by the HOMA-IR, our study cannot be interpreted as representing a relation between the AT infiltration in the abdominal skeletal muscles and insulin sensitivity in these muscles. Finally, AT depots in other non-adipose tissues and organs, such as AT infiltration in the thigh, or in the liver, pancreas, and heart, was not assessed, and thus, we were not able to test if the observed associations are independent of other ectopic AT depots. In particular, future studies should include measures of liver AT infiltration as it is possible that the observed association between abdominal myosteatosis and insulin resistance, as measured by HOMA-IR, may be driven, in part, by increased ectopic AT infiltration in the liver.
In summary, our findings suggest that total abdominal and psoas muscle adipose tissue infiltration is independently associated with hyperinsulinemia and insulin resistance among older Caucasian men. Longitudinal studies are needed to better characterize the possible effects of adipose tissue infiltration within the total abdominal skeletal muscle as well as within specific abdominal muscle groups on the development of T2DM and associated metabolic abnormalities.
Acknowledgments
Dr. Miljkovic is supported by the Mentored Research Scientist Development Award from the National Institute of Diabetes and Digestive and Kidney Diseases (grant K01DK083029). The Osteoporotic Fractures in Men Study were supported by the Oregon Medical Research Foundation, National Institute of Arthritis and Musculoskeletal and Skin Diseases, the National Institute on Aging, National Institute of Diabetes and Digestive and Kidney Diseases, National Heart, Lung, and Blood Institute, National Center for Research Resources, American Diabetes Association, and NIH Roadmap for Medical Research under the following grant numbers: U01 AR45580, U01 AR45614, U01 AR45632, U01 AR45647, U01 AR45654, U01 AR45583, U01 AG18197, U01-AG027810, UL1 RR024140, R21 DK066224, R01 HL084183, P60 AR05473101, UL1 RR024140, and ADA 104-JF46.
Footnotes
Competing interests: The authors have no competing interests.
The authors’ responsibilities were as follows-I.M.: project development and writing of the manuscript; P.Y.W.: statistical analyses; J.A.C., K.F.H., C.G.L., Y.S., E.B-C, A.R.H., C.B.L., E.S.O., M.L.S., and E.L.S.: review of the manuscript; L.M.M.: supervision of the progress of this project, assistance with data interpretation, review of the manuscript, and contribution to discussion; and all authors: suggestions, advice, and consultation on the preparation of the manuscript.
References
- 1.Boettcher M, Machann J, Stefan N, Thamer C, Haring HU, Claussen CD, et al. Intermuscular adipose tissue (IMAT): association with other adipose tissue compartments and insulin sensitivity. J Magn Reson Imaging. 2009;29(6):1340–5. doi: 10.1002/jmri.21754. [DOI] [PubMed] [Google Scholar]
- 2.Gallagher D, Kelley DE, Yim JE, Spence N, Albu J, Boxt L, et al. Adipose tissue distribution is different in type 2 diabetes. Am J Clin Nutr. 2009;89(3):807–14. doi: 10.3945/ajcn.2008.26955. [DOI] [PMC free article] [PubMed] [Google Scholar]
- 3.Goodpaster BH, Krishnaswami S, Resnick H, Kelley DE, Haggerty C, Harris TB, et al. Association between regional adipose tissue distribution and both type 2 diabetes and impaired glucose tolerance in elderly men and women. Diabetes Care. 2003;26(2):372–9. doi: 10.2337/diacare.26.2.372. [DOI] [PubMed] [Google Scholar]
- 4.Goodpaster BH, Thaete FL, Kelley DE. Thigh adipose tissue distribution is associated with insulin resistance in obesity and in type 2 diabetes mellitus. Am J Clin Nutr. 2000;71(4):885–92. doi: 10.1093/ajcn/71.4.885. [DOI] [PubMed] [Google Scholar]
- 5.Lee S, Guerra N, Arslanian S. Skeletal muscle lipid content and insulin sensitivity in black versus white obese adolescents: is there a race differential? J Clin Endocrinol Metab. 2010;95(5):2426–32. doi: 10.1210/jc.2009-2175. [DOI] [PMC free article] [PubMed] [Google Scholar]
- 6.Miljkovic I, Zmuda JM. Epidemiology of myosteatosis. Curr Opin Clin Nutr Metab Care. 2010;13(3):260–4. doi: 10.1097/MCO.0b013e328337d826. [DOI] [PMC free article] [PubMed] [Google Scholar]
- 7.Miljkovic-Gacic I, Gordon CL, Goodpaster BH, Bunker CH, Patrick AL, Kuller LH, et al. Adipose tissue infiltration in skeletal muscle: age patterns and association with diabetes among men of African ancestry. Am J Clin Nutr. 2008;87(6):1590–1595. doi: 10.1093/ajcn/87.6.1590. [DOI] [PMC free article] [PubMed] [Google Scholar]
- 8.Kovalik J-P, Slentz D, Stevens RD, Kraus WE, Houmard JA, Nicoll JB, et al. Metabolic Remodeling of Human Skeletal Myocytes by Cocultured Adipocytes Depends on the Lipolytic State of the System. Diabetes. 2011;60(7):1882–1893. doi: 10.2337/db10-0427. [DOI] [PMC free article] [PubMed] [Google Scholar]
- 9.Wajchenberg BL. Subcutaneous and visceral adipose tissue: their relation to the metabolic syndrome. Endocr Rev. 2000;21(6):697–738. doi: 10.1210/edrv.21.6.0415. [DOI] [PubMed] [Google Scholar]
- 10.Orwoll E, Blank JB, Barrett-Connor E, Cauley J, Cummings S, Ensrud K, et al. Design and baseline characteristics of the osteoporotic fractures in men (MrOS) study--a large observational study of the determinants of fracture in older men. Contemp Clin Trials. 2005;26(5):569–85. doi: 10.1016/j.cct.2005.05.006. [DOI] [PubMed] [Google Scholar]
- 11.Mitsiopoulos N, Baumgartner RN, Heymsfield SB, Lyons W, Gallagher D, Ross R. Cadaver validation of skeletal muscle measurement by magnetic resonance imaging and computerized tomography. J Appl Physiol. 1998;85(1):115–22. doi: 10.1152/jappl.1998.85.1.115. [DOI] [PubMed] [Google Scholar]
- 12.Marshall LM, Lang TF, Lambert LC, Zmuda JM, Ensrud KE, Orwoll ES. Dimensions and volumetric BMD of the proximal femur and their relation to age among older U.S. men. J Bone Miner Res. 2006;21(8):1197–206. doi: 10.1359/jbmr.060506. [DOI] [PubMed] [Google Scholar]
- 13.Kvist H, Chowdhury B, Sjostrom L, Tylen U, Cederblad A. Adipose tissue volume determination in males by computed tomography and 40K. Int J Obes. 1988;12(3):249–66. [PubMed] [Google Scholar]
- 14.Rossner S, Bo WJ, Hiltbrandt E, Hinson W, Karstaedt N, Santago P, et al. Adipose tissue determinations in cadavers--a comparison between cross-sectional planimetry and computed tomography. Int J Obes. 1990;14(10):893–902. [PubMed] [Google Scholar]
- 15.Sjostrom L. A computer-tomography based multicompartment body composition technique and anthropometric predictions of lean body mass, total and subcutaneous adipose tissue. Int J Obes. 1991;15(Suppl 2):19–30. [PubMed] [Google Scholar]
- 16.Goodpaster BH, Kelley DE, Thaete FL, He J, Ross R. Skeletal muscle attenuation determined by computed tomography is associated with skeletal muscle lipid content. J Appl Physiol. 2000;89(1):104–10. doi: 10.1152/jappl.2000.89.1.104. [DOI] [PubMed] [Google Scholar]
- 17.Pahor M, Chrischilles EA, Guralnik JM, Brown SL, Wallace RB, Carbonin P. Drug data coding and analysis in epidemiologic studies. Eur J Epidemiol. 1994;10(4):405–11. doi: 10.1007/BF01719664. [DOI] [PubMed] [Google Scholar]
- 18.Matthews DR, Hosker JP, Rudenski AS, Naylor BA, Treacher DF, Turner RC. Homeostasis model assessment: insulin resistance and beta-cell function from fasting plasma glucose and insulin concentrations in man. Diabetologia. 1985;28(7):412–9. doi: 10.1007/BF00280883. [DOI] [PubMed] [Google Scholar]
- 19.Gallagher D, Kuznia P, Heshka S, Albu J, Heymsfield SB, Goodpaster B, et al. Adipose tissue in muscle: a novel depot similar in size to visceral adipose tissue. Am J Clin Nutr. 2005;81(4):903–10. doi: 10.1093/ajcn/81.4.903. [DOI] [PMC free article] [PubMed] [Google Scholar]
- 20.Albu JB, Kovera AJ, Allen L, Wainwright M, Berk E, Raja-Khan N, et al. Independent association of insulin resistance with larger amounts of intermuscular adipose tissue and a greater acute insulin response to glucose in African American than in white nondiabetic women. Am J Clin Nutr. 2005;82(6):1210–7. doi: 10.1093/ajcn/82.6.1210. [DOI] [PMC free article] [PubMed] [Google Scholar]
- 21.Miljkovic I, Cauley JA, Petit MA, Ensrud KE, Strotmeyer E, Sheu Y, et al. Greater adipose tissue infiltration in skeletal muscle among older men of African ancestry. J Clin Endocrinol Metab. 2009;94(8):2735–42. doi: 10.1210/jc.2008-2541. [DOI] [PMC free article] [PubMed] [Google Scholar]
- 22.Yim J-E, Heshka S, Albu JB, Heymsfield S, Gallagher D. Femoral-gluteal subcutaneous and intermuscular adipose tissues have independent and opposing relationships with CVD risk. Journal of Applied Physiology. 2008;104(3):700–707. doi: 10.1152/japplphysiol.01035.2007. [DOI] [PMC free article] [PubMed] [Google Scholar]
- 23.Goodpaster BH, He J, Watkins S, Kelley DE. Skeletal muscle lipid content and insulin resistance: evidence for a paradox in endurance-trained athletes. J Clin Endocrinol Metab. 2001;86(12):5755–61. doi: 10.1210/jcem.86.12.8075. [DOI] [PubMed] [Google Scholar]
- 24.Brehm A, Krssak M, Schmid AI, Nowotny P, Waldhausl W, Roden M. Increased lipid availability impairs insulin-stimulated ATP synthesis in human skeletal muscle. Diabetes. 2006;55(1):136–40. [PubMed] [Google Scholar]
- 25.Lee DE, Kehlenbrink S, Lee H, Hawkins M, Yudkin JS. Getting the message across: mechanisms of physiological cross talk by adipose tissue. Am J Physiol Endocrinol Metab. 2009;296(6):E1210–29. doi: 10.1152/ajpendo.00015.2009. [DOI] [PubMed] [Google Scholar]
- 26.Vettor R, Milan G, Franzin C, Sanna M, De Coppi P, Rizzuto R, et al. The origin of intermuscular adipose tissue and its pathophysiological implications. Am J Physiol Endocrinol Metab. 2009;297(5):E987–998. doi: 10.1152/ajpendo.00229.2009. [DOI] [PubMed] [Google Scholar]
- 27.Kuk JL, Church TS, Blair SN, Ross R. Associations between changes in abdominal and thigh muscle quantity and quality. Med Sci Sports Exerc. 2008;40(7):1277–81. doi: 10.1249/MSS.0b013e31816a2463. [DOI] [PubMed] [Google Scholar]
- 28.Torriani M, Hadigan C, Jensen ME, Grinspoon S. Psoas muscle attenuation measurement with computed tomography indicates intramuscular fat accumulation in patients with the HIV-lipodystrophy syndrome. J Appl Physiol. 2003;95(3):1005–10. doi: 10.1152/japplphysiol.00366.2003. [DOI] [PubMed] [Google Scholar]
- 29.Freeman MD, Woodham MA, Woodham AW. The role of the lumbar multifidus in chronic low back pain: a review. PM R. 2010;2(2):142–6. doi: 10.1016/j.pmrj.2009.11.006. [DOI] [PubMed] [Google Scholar]
- 30.Kitajima Y, Eguchi Y, Ishibashi E, Nakashita S, Aoki S, Toda S, et al. Age-related fat deposition in multifidus muscle could be a marker for nonalcoholic fatty liver disease. J Gastroenterol. 2010;45(2):218–24. doi: 10.1007/s00535-009-0147-2. [DOI] [PubMed] [Google Scholar]
- 31.McGavock JM, Lingvay I, Zib I, Tillery T, Salas N, Unger R, et al. Cardiac steatosis in diabetes mellitus: a 1H-magnetic resonance spectroscopy study. Circulation. 2007;116(10):1170–5. doi: 10.1161/CIRCULATIONAHA.106.645614. [DOI] [PubMed] [Google Scholar]
- 32.Lingvay I, Esser V, Legendre JL, Price AL, Wertz KM, Adams-Huet B, et al. Noninvasive quantification of pancreatic fat in humans. J Clin Endocrinol Metab. 2009;94(10):4070–6. doi: 10.1210/jc.2009-0584. [DOI] [PMC free article] [PubMed] [Google Scholar]
- 33.Heni M, Machann J, Staiger H, Schwenzer NF, Peter A, Schick F, et al. Pancreatic fat is negatively associated with insulin secretion in individuals with impaired fasting glucose and/or impaired glucose tolerance: a nuclear magnetic resonance study. Diabetes Metab Res Rev. 2010;26(3):200–5. doi: 10.1002/dmrr.1073. [DOI] [PubMed] [Google Scholar]
- 34.Leinonen V, Kankaanpaa M, Luukkonen M, Kansanen M, Hanninen O, Airaksinen O, et al. Lumbar paraspinal muscle function, perception of lumbar position, and postural control in disc herniation-related back pain. Spine (Phila Pa, 1976) 2003;28(8):842–8. [PubMed] [Google Scholar]
- 35.Sajko S, Stuber K. Psoas Major: a case report and review of its anatomy, biomechanics, and clinical implications. J Can Chiropr Assoc. 2009;53(4):311–8. [PMC free article] [PubMed] [Google Scholar]
- 36.Kern M, Wells JA, Stephens JM, Elton CW, Friedman JE, Tapscott EB, et al. Insulin responsiveness in skeletal muscle is determined by glucose transporter (Glut4) protein level. Biochem J. 1990;270(2):397–400. doi: 10.1042/bj2700397. [DOI] [PMC free article] [PubMed] [Google Scholar]
- 37.He J, Watkins S, Kelley DE. Skeletal muscle lipid content and oxidative enzyme activity in relation to muscle fiber type in type 2 diabetes and obesity. Diabetes. 2001;50(4):817–23. doi: 10.2337/diabetes.50.4.817. [DOI] [PubMed] [Google Scholar]
- 38.Regev GJ, Kim CW, Thacker BE, Tomiya A, Garfin SR, Ward SR, et al. Regional Myosin heavy chain distribution in selected paraspinal muscles. Spine (Phila Pa, 1976) 2010;35(13):1265–70. doi: 10.1097/BRS.0b013e3181bfcd98. [DOI] [PMC free article] [PubMed] [Google Scholar]
- 39.Delmonico MJ, Harris TB, Visser M, Park SW, Conroy MB, Velasquez-Mieyer P, et al. Longitudinal study of muscle strength, quality, and adipose tissue infiltration. Am J Clin Nutr. 2009;90(6):1579–85. doi: 10.3945/ajcn.2009.28047. [DOI] [PMC free article] [PubMed] [Google Scholar]
- 40.Parkkola R, Kormano M. Lumbar disc and back muscle degeneration on MRI: correlation to age and body mass. J Spinal Disord. 1992;5(1):86–92. doi: 10.1097/00002517-199203000-00011. [DOI] [PubMed] [Google Scholar]