

Abstract
While the role of auto-HCT is well established in neuroblastoma, the role of allo-HCT is controversial. The CIBMTR conducted a retrospective review of 143 allo-HCT for NBL reported in 1990-2007. Patients were categorized into two different groups: those who had not (Group 1) and had (Group 2) undergone a prior auto HCT (n=46 and 97, respectively). One-year and five-year overall survival (OS) were 59% and 29% for Group 1 and 50% and 7% for Group 2. Amongst donor types, disease free survival (DFS) and OS were significantly lower for unrelated transplants at 1 and 3 years but not 5 years post-HCT. Patients in complete response (CR) or very good partial response (VGPR) at transplant had lower relapse rates and better DFS and OS, compared to those not in CR or VGPR. Our analysis indicates that allo-HCT can cure some neuroblastoma patients, with lower relapse rates and improved survival in patients without a history of prior auto-HCT as compared to those patients who had previously undergone auto-HCT. Although the data do not address why either strategy was chosen for patients, allo-HCT after a prior auto-HCT appears to offer minimal benefit. Disease recurrence remains the most common cause of treatment failure.
Keywords: neuroblastoma, allogeneic HCT, autologous HCT, CIBMTR
INTRODUCTION
Neuroblastoma is the most common extracranial solid tumor of childhood. Most children have metastatic disease at diagnosis, and require aggressive therapy including chemotherapy, surgery and radiation, with autologous hematopoietic cell transplantation (auto-HCT) as consolidation 1, 2. In a randomized clinical trial conducted by the Children’s Cancer Group, auto-HCT resulted in better event-free survival than standard chemotherapy, which was confirmed on long-term follow-up of this cohort 3, 4. Neuroblastoma is one of the most common indications for auto-HCT in pediatrics; however, disease recurrence remains the main cause of treatment failure. Even when post-transplant anti-GD2 antibody therapy is incorporated, the 3-year disease-free survival rate from transplant is 65% at best5. Allo-HCT has been utilized as treatment for neuroblastoma. However, limited comparisons of autologous vs. allogeneic HCT have not shown an advantage for allo-HCT 6, 7, and a retrospective review by the EBMT suggested that successful outcomes after allo-HCT have been limited by unacceptably high rates of regimen- related mortality and disease recurrence 8. More recently, with improvements in supportive care, improved HLA typing and the advent of reduced intensity conditioning regimens, physicians have been re-exploring allo-HCT 9-12. We therefore performed a retrospective study to describe the use of allo-HCT for neuroblastoma and to evaluate the outcomes of recipients of allo-HCT for neuroblastoma among patients reported to the Center for International Blood and Marrow Transplant Research (CIBMTR).
METHODS
Data collection
CIBMTR is a research affiliation of the International Bone Marrow Transplant Registry (IBMTR), the Autologous Blood and Marrow Transplant Registry (ABMTR) and the National Marrow Donor Program (NMDP) that comprises a voluntary working group of more than 500 transplantation centers worldwide that contribute data on consecutive HCT to a Statistical Center at the Medical College of Wisconsin and the NMDP. Participating centers are required to report all consecutive transplants; compliance is monitored by on-site audits. Computerized checks for errors, physicians’ review of submitted data, and on-site audits of participating centers ensure data quality. Observational studies conducted by the CIBMTR are done with a waiver of informed consent and in compliance with HIPAA regulations as determined by the Institutional Review Board (IRB) and the Privacy Officer of the Medical College of Wisconsin.
Study population
There were 3528 transplants (autologous or allogeneic) registered to the CIBMTR between 1990 and 2007 for neuroblastoma. This study was restricted to subjects with neuroblastoma undergoing a first allo-HCT from 1990 to 2007. All surviving recipients who received transplants from unrelated donors (URD) included in this analysis were retrospectively contacted and provided informed consent for participation in the NMDP research program. Informed consent for retrospective data analysis was waived by the NMDP IRB for all deceased patients. Surviving patients who did not provide signed informed consent to allow analysis of their clinical data were excluded. To adjust for potential bias introduced by exclusion of non-consenting surviving patients, a corrective action plan (CAP)–modeling process randomly excluded approximately the same percentage of deceased patients using a biased coin randomization with exclusion probabilities based on characteristics associated with not providing consent for use of data in survivors. The classification of degree of HLA-match was based on the model proposed by Weisdorf et al 13. In this schema “well-matched” category included those with no defined mismatches and no untested HLA locus; partially-matched included those with only one untested or mismatched locus; and mismatched included those with two or more known or mismatched or untested HLA-loci.
The study population included 143 subjects with neuroblastoma (4% of all transplants for neuroblastoma performed during this time period). We categorized patients into 2 groups, based on whether they had a history of a prior auto-HCT, with 97 patients not having a prior autograft and 46 patients having a prior autograft, registered with CIBMTR. A subset of these patients had more detailed report forms available (n=66) and are described in Table 2. Definitions and categorization of donor recipient HLA-matching and conditioning regimens were assigned according to published CIBMTR criteria14, 15. Patient-, disease-, and transplant-related characteristics are listed in Table 1 for the entire group and in Table 2 for the subgroup that had report forms available.
Table 2.
Characteristics of patients receiving allogeneic transplantation for neuroblastoma between 1990-2007 and reported to the CIBMTR
| Characteristics of patients | Did not receive prior auto, N (%) |
Received prior auto, N (%) |
|---|---|---|
| Number of patientsa | 35 | 31 |
| Number of centers | 24 | 19 |
| Age at transplant, median (range), years | 5 (2-39) | 7 (1-32) |
| 0 – 5 | 18 (51) | 7 (23) |
| 6 -10 | 9 (26) | 20 (65) |
| 11 – 20 | 5 (14) | 3 (10) |
| > 20 | 3 ( 9) | 1 ( 3) |
| Male sex | 17 (49) | 12 (39) |
| Karnofsky score prior to TX | ||
| < 90% | 13 (37) | 9 (29) |
| ≥ 90% | 21 (60) | 20 (65) |
| Unknown | 1 (3) | 2 (6) |
| Time from diagnosis to allogeneic transplant | ||
| Median (range), months | 11 (5-97) | 27 (9-76) |
| 0 – 6 | 3 ( 9) | 0 |
| 7 12 | 17 (49) | 3 (10) |
| 13 – 24 | 7 (20) | 5 (16) |
| 25 – 36 | 2 (6) | 13 (42) |
| > 36 | 6 (17) | 10 (32) |
| Had prior autologous transplant Time from autologous transplant to allogeneic transplant |
||
| Median (range), months | 19 (1-68) | |
| 0 - 12 | NA | 8 (26) |
| 13 - 24 | 12 (39) | |
| 24 – 36 | 11 (35) | |
| Disease status prior to transplant | ||
| CR | 9 (26) | 5 (16) |
| Very good partial response | 3 ( 9) | 4 (13) |
| Partial response | 9 (26) | 7 (23) |
| Minimal response | 1 (3) | 1 (3) |
| No response | 4 (11) | 1 (3) |
| Progressive disease | 3 ( 9) | 5 (16) |
| Unknown | 6 (17) | 8 (26) |
| Conditioning regimen | ||
| TBI + other | 18 (51) | 10 (32) |
| Bu + CY ± other | 3 ( 9) | 1 ( 3) |
| CY + other | 4 (11) | 6 (19) |
| Bu + Fludara ± other | 2 ( 6) | 6 (19) |
| Bu + other | 1 ( 3) | 2 ( 6) |
| Fludara + Melphalan | 1 ( 3) | 6 (19) |
| Melphlan + other | 5 (14) | 0 |
| Etopside + Carboplatin | 1 ( 3) | 0 |
| Donor recipient HLA match | ||
| HLA-identical sibling | 18 (51) | 10 (32) |
| Other related donor | 3 ( 9) | 2 ( 6) |
| Matched unrelated donor | 0 | 5 (16) |
| Mismatched unrelated donor | 14 (40) | 13 (42) |
| Matching unknown, unrelated donor | 0 | 1 ( 3) |
| Graft source | ||
| BM | 16 (46) | 11 (35) |
| PBSC | 4 (11) | 8 (26) |
| Cord Blood | 15 (43) | 12 (39) |
| Year of transplant | ||
| 1990 – 1994 | 14 (40) | 1 ( 3) |
| 1995 – 1999 | 5 (14) | 8 (26) |
| 2000 – 2004 | 12 (34) | 9 (29) |
| 2005 – 2007 | 4 (11) | 13 (42) |
| GVHD prophylaxis | ||
| T-cell depletion | 3 ( 9) | 1 ( 3) |
| MTX + CSA ± other | 8 (23) | 7 (23) |
| MTX ± other | 4 (11) | 2 ( 6) |
| CSA ± Other | 17 (49) | 17 (55) |
| Fk506 ± Other | 0 | 2 (6) |
| Unknownb | 3 (9) | 2 (6) |
| Previous bone marrow involvement | ||
| No | 4 (11) | 6 (19) |
| Yes | 10 (29) | 14 (45) |
| Unknown | 21 (60) | 11 (35) |
| Previous CNS involvement | ||
| No | 12 (34) | 19 (61) |
| Yes | 2 (6) | 1 (3) |
| Unknown | 21 (60) | 11 (35) |
| Metastases present at diagnosis | ||
| No | 1 ( 3) | 2 ( 6) |
| Yes | 14 (40) | 16 (52) |
| Missing | 20 (57) | 13 (42) |
| disease INSS stage at diagnosis | ||
| Stage 1 | 1 ( 3) | 0 |
| Stage 3 | 4 (11) | 3 (10) |
| Stage 4 | 10 (29) | 14 (45) |
| Missing | 20 (57) | 14 (45) |
| Number of sites of disease at allogeneic transplant | ||
| 1 | 1 ( 3) | 3 (10) |
| 2 | 3 ( 9) | 3 (10) |
| 3 | 2 ( 6) | 2 ( 6) |
| 4 | 1 ( 3) | 2 ( 6) |
| Missing | 16 (46) | 12 (39) |
| NA (disease status was CR, VGPR) | 12 (34) | 9 (29) |
| Chemo sensitive to last line of therapy | ||
| No | 2 ( 6) | 1 ( 3) |
| Yes | 8 (23) | 12 (39) |
| did not receive chemotherapy as last line of therapy | 2 ( 6) | 0 |
| Missing | 23 (66) | 18 (58) |
| Radiotherapy given as part of initial treatment | ||
| No | 12 (34) | 12 (39) |
| Yes (primary tumor bed after resection as sit of radiotherapy) |
1 ( 3) | 2 ( 6) |
| Unknown | 22 (63) | 17 (55) |
| Donor-recipient sex match | ||
| M – M | 9 (26) | 4 (13) |
| M – F | 9 (26) | 7 (23) |
| F – M | 8 (23) | 6 (19) |
| F – F | 8 (23) | 10 (32) |
| Unknown | 1 ( 3) | 4 (13) |
| Donor-recipient CMV status | ||
| −/− | 17 (49) | 11 (35) |
| +/− | 3 ( 9) | 3 (10) |
| −/+ | 10 (29) | 9 (29) |
| +/+ | 3 ( 9) | 4 (13) |
| Unknown | 2 ( 6) | 4 (13) |
| Median (range) follow-up c, months | 72 (3-150) | 45 (3-58) |
Abbreviations: TBI = total body irradiation; CY = cyclophosphamide; CsA = cyclosporine; MTX = methotrexate; CMV = cytomegalovirus; GVHD = graft-versus-host disease; FK506 = tacrolimus.
Table 1.
Characteristics of patients receiving allogeneic transplantation for neuroblastoma between 1990-2007 and registered to the CIBMTR
| Characteristics of patients | Did not receive prior auto, N (%) |
Received prior auto, N (%) |
|---|---|---|
| Number of patients | 97 | 46 |
| Number of centers | 48 | 24 |
| Age at transplant, median (range), years | 5 (<1- 55) | 7 (2-32) |
| 0 – 5 | 51 (53) | 9 (20) |
| 6 -10 | 27 (28) | 31 (67) |
| 11 – 20 | 13 (13) | 5 (11) |
| > 20 | 6 ( 6) | 1 ( 2) |
| Male sex | 58 (60) | 23 (50) |
| Karnofsky score prior to TX | ||
| < 90% | 13 (13) | 11 (24) |
| ≥ 90% | 39 (40) | 28 (61) |
| Unknown | 45 (46) | 7 (15) |
| Time from diagnosis to allogeneic transplant | ||
| Median (range), months | 9 (<1-97) | 27 (8 - 76) |
| ≤ 6 | 12 (12) | 0 |
| 7 12 | 50 (52) | 3 ( 7) |
| 13 – 24 | 19 (20) | 10 (22) |
| 25 – 36 | 6 ( 6) | 18 (39) |
| > 36 | 9 ( 9) | 15 (33) |
| Missing | 1 ( 1) | 0 |
| Had prior autologous transplant | 46 (100) | |
| Time from autologous transplant to allogeneic transplant | ||
| Median (range), months | NA | 20 (1- 68) |
| 0 - 12 | 10 (22) | |
| 13 – 24 | 19 (41) | |
| 24 – 36 | 17 (37) | |
| Disease status prior to transplant | ||
| CR | 30 (31) | 8 (17) |
| Very good partial response | 8 ( 8) | 4 ( 9) |
| Partial response | 17 (18) | 8 (17) |
| Minimal response | 1 ( 1) | 1 ( 2) |
| No response | 17 (18) | 2 ( 4) |
| Progressive disease | 6 ( 6) | 11 (24) |
| Unknown | 18 (19) | 12 (26) |
| Conditioning regimen | ||
| TBI + other | 59 (61) | 15 (33) |
| Bu + CY ± Other | 4 ( 4) | 1 (2) |
| CY + other | 6 ( 6) | 7 (15) |
| Bu + Fludara ± Other | 3 ( 3) | 6 (13) |
| Bu + Other | 1 ( 1) | 3 ( 7) |
| Melphalan + Fludara ± other | 3 ( 3) | 9 (20) |
| Melphalan ± Other | 11 (11) | 0 |
| Othera | 2 ( 2) | 0 |
| Unknown | 8 ( 8) | 5 (11) |
| Donor type | ||
| HLA-identical sibling | 56 (58) | 18 (39) |
| Other related donor | 25 (26) | 4 (9) |
| Unrelated | 16 (16) | 24 (52) |
| Graft source | ||
| BM | 69 (71) | 16 (35) |
| PBSC | 10 (10) | 13 (28) |
| Cord Blood | 16 (16) | 17 (37) |
| Unknown | 2 (2) | 0 |
| Year of transplant | ||
| 1990 – 1994 | 38 (39) | 1 ( 2) |
| 1995 – 1999 | 26 (27) | 10 (22) |
| 2000 – 2004 | 24 (25) | 18 (39) |
| 2005 – 2007 | 9 ( 9) | 17 (37) |
| GVHD prophylaxis | ||
| T-cell depletion | 5 ( 5) | 1 ( 2) |
| MTX + CSA ± other | 21 (22) | 9 (20) |
| MTX ± other | 19 (20) | 3 (7) |
| CSA ± Other | 30 (31) | 23 (50) |
| Other | 1 ( 1) | 3 ( 7) |
| Unknownb | 21 (22) | 7 (15) |
| Median (range) follow-up c, months | 84 (<1- 191) | 45 (<1- 58) |
Abbreviations: TBI = total body irradiation; CY = cyclophosphamide; CsA = cyclosporine; MTX = methotrexate; CMV = cytomegalovirus; GVHD = graft-versus-host disease; FK506 = tacrolimus.
Endpoints and Definitions
The primary objective was to describe the overall (OS) and disease-free survival (DFS) after allo-HCT for neuroblastoma and to describe the usage of this modality. In addition, we analyzed time to engraftment, incidence of acute and chronic GVHD, relapse or disease progression and transplant related mortality (TRM). Neutrophil engraftment was defined as the first of three consecutive days with an absolute neutrophil count of ≥ 0.5 × 10⁹/L; platelet engraftment was defined as platelet count ≥ 20 × 109/L for seven consecutive days without transfusion support. TRM was defined as death from any cause in the first 28 days or death without evidence of disease progression/relapse. Relapse was defined as recurrence of neuroblastoma after a complete response (CR) or progression of disease at existing sites, or new sites of disease. For calculating DFS, patients were considered treatment failures at relapse or progression, or death. The OS interval variable was defined as the time from date of transplant to date of death or last contact. Acute GVHD was defined and graded based on the pattern and severity of organ involvement using established criteria16. Chronic GVHD was defined as the development of any chronic GVHD based on clinical criteria17.
Statistical analysis
Patient-, disease-, and transplant-related variables (Table 1) were described with median and range for continuous variables, and percent of total for categorical variables. Occurrence of acute and chronic GVHD, TRM, and disease recurrence/progression were calculated using cumulative incidence estimates, taking into account the competing risks. Probabilities of DFS and OS were estimated from the time of HCT using the Kaplan-Meier estimator. When possible, univariate analysis was performed to compare outcomes among the two groups of patients: patients without a prior auto-HCT (Group 1) and those with a prior auto-HCT (Group 2). All p-values were two-sided. All analyses were performed using SAS 9.1 (SAS Institute, Cary, NC).
RESULTS
Subjects, disease, transplant characteristics
Median age was 5 years (range, <1-55 years) in Group 1 and 7 years (range, 2-32 years) in group 2 (table 1). 40% of subjects in Group 1 and 61% of subjects in Group 2 had a Karnofsky/Lansky performance score > 90. The median time to allo-HCT from auto-HCT was 20 months (range, 1-68 months). A subgroup of 66 patients (35 in Group 1, 31 in Group 2) had more extensive data collected and was available for additional analysis (Table 2).
Graft-versus-host disease
The incidence of grade II-IV acute GVHD was 28% (95% CI 20-37%) by 100 days post HCT. The incidence of chronic GVHD was 14% (95% CI 8-21%) at 1 year (Table 3a). In an analysis of relapse evaluating the impact of GVHD, no effect of acute GVHD (p=0.6738) on relapse was observed. Effect of chronic GVHD could not be estimated because of the low incidence of chronic GVHD (14%). There was no difference in the cumulative incidence of acute or chronic GVHD between the two patient cohorts studied (Table 3b).
Table 3a.
Univariate probabilities of outcomes of all patients
| Outcome event | All patients with available outcome data | |
|---|---|---|
| N eval. | Prob (95% CI)a | |
| ANC > 0.5 × 10⁹/L | 111 | |
| @ 28 days | 83 (74-89) | |
| @100 days | 92 (85-96) | |
| Platelets > 20 × 109 /L | 95 | |
| @ 60 days | 57 (46-67) | |
| @100 days | 60 (49-70) | |
| Acute GVHD, Grades 2-4 | 103 | |
| @100 days | 28 (20-37) | |
| @ 180 days | 29 (21-38) | |
| Chronic GVHD | 112 | |
| @ 1 year | 14 (8-21) | |
| @ 3 years | 15 (9-22) | |
| @5 years | 15 (9-22) | |
| Transplant-related mortality | 115 | |
| @ 100days | 18 (12-26) | |
| @ 1 year | 25 (17-33) | |
| @ 3 years | 25 (18-34) | |
| @ 5 years | 25 (18-34) | |
| Relapse | 115 | |
| @ 1 year | 38 (29-47) | |
| @ 3 years | 52 (42-61) | |
| @ 5 years | 55 (45-64) | |
| Disease-free survival | 115 | |
| @ 1 year | 37 (28-46) | |
| @ 3 years | 23 (15-31) | |
| @ 5 years | 20 (13-27) | |
| Overall survival | 143 | |
| @ 1 year | 56 (47-64) | |
| @ 3 years | 29 (22-37) | |
| @ 5 years | 22 (15-30) | |
Table 3b.
Univariate probabilities of outcomes by whether received prior autologous transplant
| Did not receive prior auto | Received prior auto | P-value | |||
|---|---|---|---|---|---|
|
| |||||
| Outcome event | N eval. | Prob (95% CI)a | N eval. | Prob (95% CI)a | |
| ANC > 0.5 × 10⁹/L | 69 | 42 | |||
| @ 28 days | 78 (66-86) | 90 (76-96) | 0.0806 | ||
| @100 days | 88 (78-94) | 98 (84-100) | 0.0433 | ||
| Platelets > 20 × 109 /L | 54 | 41 | |||
| @ 60 days | 65 (50-76) | 47 (28-64) | 0.1309 | ||
| @100 days | 69 (54-79) | 50 (30-67) | 0.1115 | ||
| Acute GVHD, Grades 2-4 | 65 | 38 | |||
| @100 days | 23 (14-34) | 37 (22-52) | 0.1466 | ||
| @ 180 days | 25 (15-36) | 37 (22-52) | 0.202 | ||
| Chronic GVHD | 68 | 44 | |||
| @ 1 year | 10 (5-19) | 19 (9-32) | 0.2359 | ||
| @ 3 years | 12 (6-21) | 19 (9-32) | 0.3395 | ||
| @5 years | 12 (6-21) | 19 (9-32) | 0.3395 | ||
| Transplant-related mortality | 73 | 42 | |||
| @ 100days | 19 (11-29) | 17 (7-29) | 0.7332 | ||
| @ 1 year | 25 (16-35) | 24 (12-37) | 0.8916 | ||
| @ 3 years | 26 (17-37) | 24 (12-37) | 0.7572 | ||
| @ 5 years | 26 (17-37) | 24 (12-37) | 0.7572 | ||
| Relapse | 73 | 42 | |||
| @ 1 year | 27 (17-38) | 57 (41-70) | 0.0012 | ||
| @ 3 years | 43 (31-55) | 67 (50-79) | 0.0131 | ||
| @ 5 years | 46 (34-58) | 70 (53-82) | 0.0123 | ||
| Disease-free survival | 73 | 42 | |||
| @ 1 year | 48 (36-59) | 19 (9-32) | 0.0006 | ||
| @ 3 years | 30 (20-41) | 10 (3-21) | 0.0037 | ||
| @ 5 years | 27 (17-38) | 6 (1-17) | 0.0018 | ||
| Overall survival | 97 | 46 | |||
| @ 1 year | 59 (48-68) | 50 (35-64) | 0.3439 | ||
| @ 3 years | 36 (26-46) | 16 (7-28) | 0.0086 | ||
| @ 5 years | 29 (20-39) | 7 (1-18) | 0.0005 | ||
Relapse
Cumulative incidences of neuroblastoma progression or relapse at 1 and 5 years post-HCT were 38% (95% CI 29-47%) and 55% (95% CI 45-64%), respectively, for all subjects (Table 3a). GVHD did not correlate with disease progression or relapse. Disease recurrence at 1 year post allo-HCT was observed more often in patients in Group 2 compared to Group 1 (Table 3b) (57% versus 27% at 1year, p=0.0012). This observation persisted at 3 and 5 years post-allo-HCT.
Treatment-related mortality
TRM at 100 days post-HCT was 18% (95% CI 12-26%) for the entire study population. TRM was stable over the first 5 years after transplant: from 25% (95% CI 17-33%) at 1 year to 25% (95% CI 18-34%) at 3 years, to 25% (95% CI; 18-34%) at 5 years post-HCT. There was no difference in the cumulative incidence of TRM between the two patient cohorts studied (Table 3b).
Disease-free survival (DFS)
For the entire cohort, DFS was 37% (95% CI 28-46%) at 1 year post-HCT and 20% (95% CI 13-27%) at 5 years post-HCT (Table 3a). Neither acute nor chronic GVHD correlated with DFS. DFS was higher for patients in Group 1 compared to Group 2 (Table 3b) (48% versus 19% at 1 year, p=0.0006).
Overall Survival (OS)
Survival at 1 year post HCT was 56% (95% CI 47-64%) and 22% (95% CI 15-30%) at 5 years post-HCT for all patients (Table 3a). Survival was higher for patients in Group 1 compared to Group 2 (Table 3b) (36% versus 16% at 3 years, p=0.0086).
Cause of death
The most common cause of death among transplant recipients was disease recurrence (n=72, 68%). Other common causes included organ failure (n=8, 8%), infection (n=9, 8%), and GVHD (n=4, 4%) (Table 5). Of patients in Group 2, 87% died. Of patients in Group 1, 68% died.
Table 5.
Cause of death
| Did not receive prior auto, N (%) |
Received prior auto, N (%) |
All patients, N (%) |
|
|---|---|---|---|
| Number of patients | 97 | 46 | 143 |
| Number of death | 66 | 40 | 106 |
| Primary disease | 42 (64) | 30 (75) | 72 (68) |
| Infection | 7 (11) | 2 (5) | 9 (8) |
| ARDS | 3 (5) | 1 (3) | 4 (3) |
| Organ failure | 4 (6) | 4 (10) | 8 (8) |
| Graft failure | 1 (2) | 0 (.) | 1 (1) |
| Hemorrhage | 1 (2) | 1 (3) | 2 (2) |
| GVHD | 4 (5) | 0 (.) | 4 (4) |
| Vascular | 0 (.) | 1 (2) | 1 (1) |
| Unknown | 4 (5) | 1 (2) | 5 (5) |
Outcome by donor type
Time to neutrophil engraftment, platelet engraftment, acute GVHD, chronic GVHD, and TRM were unaffected by donor type (Table 3c). Relapse was consistently higher for recipients of URD grafts compared to other hematopoietic graft sources. Similarly, early DFS (at 1 year) and OS (at 1 and 3 years) was lower for URD grafts. A separate analysis of the 33 patients undergoing cord blood transplantation was performed (Table 6); 16 did not undergo prior auto-HCT. In this subgroup, the day 100 TRM was 19%, plateauing at 23% from 1 year to 5 year post-HCT. One-year DFS was 20%.
Table 3c.
Univariate probabilities of outcomes by donor type
| HLA-identical sibling | Other related | Unrelated | P-value | ||||
|---|---|---|---|---|---|---|---|
|
| |||||||
| Outcome event | N eval. |
Prob (95% CI)a | N eval. |
Prob (95% CI)a | N eval. |
Prob (95% CI)a | |
| ANC > 0.5 × 10⁹/L | 50 | 23 | 38 | ||||
| @ 28 days | 86 (72-93) | 87 (64-96) | 76 (59-87) | 0.4703 | |||
| @100 days | 92 (80-97) | 87 (64-96) | 95 (81-99) | 0.6149 | |||
| Platelets > 20 × 109 /L | 39 | 19 | 37 | ||||
| @ 60 days | 65 (48-78) | 63 (38-80) | 45 (27-61) | 0.199 | |||
| @100 days | 68 (50-81) | 63 (38-80) | 51 (32-66) | 0.3311 | |||
| Acute GVHD, Grades 2-4 | 51 | 19 | 33 | ||||
| @100 days | 25 (15-38) | 21 (7-41) | 36 (20-52) | 0.4306 | |||
| @ 180 days | 25 (15-38) | 21 (7-41) | 40 (23-56) | 0.2802 | |||
| Chronic GVHD | 53 | 21 | 38 | ||||
| @ 1 year | 12 (5-22) | 19 (6-38) | 14 (5-27) | 0.7333 | |||
| @ 3 years | 12 (5-22) | 24 (9-43) | 14 (5-27) | 0.489 | |||
| @5 years | 12 (5-22) | 24 (9-43) | 14 (5-27) | 0.489 | |||
| Transplant-related mortality | 55 | 21 | 39 | ||||
| @ 100days | 18 (9-29) | 19 (6-38) | 18 (8-31) | 0.9944 | |||
| @ 1 year | 24 (14-36) | 34 (15-54) | 21 (10-34) | 0.5397 | |||
| @ 3 years | 26 (15-38) | 34 (15-54) | 21 (10-34) | 0.5397 | |||
| @ 5 years | 26 (15-38) | 34 (15-54) | 21 (10-34) | 0.5436 | |||
| Relapse | 55 | 21 | 39 | ||||
| @ 1 year | 30 (18-42) | 15 (4-33) | 63 (46-76) | <.0001 | |||
| @ 3 years | 52 (38-64) | 25 (9-45) | 66 (49-79) | 0.0043 | |||
| @ 5 years | 56 (41-68) | 31 (13-51) | 66 (49-79) | 0.0263 | |||
| Disease-free survival | 55 | 21 | 39 | ||||
| @ 1 year | 47 (33-59) | 51 (28-70) | 16 (7-29) | 0.0007 | |||
| @ 3 years | 22 (12-34) | 41 (20-61) | 13 (5-26) | 0.079 | |||
| @ 5 years | 19 (10-30) | 35 (15-55) | 13 (5-26) | 0.2133 | |||
| Overall survival | 74 | 29 | 40 | ||||
| @ 1 year | 63 (51-73) | 60 (39-75) | 40 (25-55) | 0.0529 | |||
| @ 3 years | 30 (19-41) | 48 (28-65) | 16 (7-29) | 0.0175 | |||
| @ 5 years | 22 (13-33) | 33 (16-52) | 16 (7-29) | 0.3101 | |||
Table 6.
Outcomes of patients who had cord blood transplants
| Outcome event | ||
|---|---|---|
| N eval. | Prob (95% CI) | |
| Transplant-related mortality | ||
| @ 100days | 31 | 19 (8-35) |
| @ 1 year | 23 (10-39) | |
| @ 3 years | 23 (10-39) | |
| @ 5 years | 23 (10-39) | |
| Relapse | 31 | |
| @ 1 year | 57 (37-72) | |
| @ 3 years | 60 (41-75) | |
| @ 5 years | 60 (41-75) | |
| Disease-free survival | 31 | |
| @ 1 year | 20 (8-36) | |
| @ 3 years | 17 (6-32) | |
| @ 5 years | 17 (6-32) | |
| Overall survival | 33 | |
| @ 1 year | 39 (22-56) | |
| @ 3 years | 20 (8-35) | |
| @ 5 years | 20 (8-35) |
Abbreviations: CI: confidence interval.
Outcome by disease status at allogeneic HCT
Time to neutrophil engraftment, platelet engraftment, acute GVHD, chronic GVHD, and TRM were unaffected by disease status at allo-HCT (Table 3d). The incidence of relapse at one year was significantly lower for patients in complete response (CR) or very good partial response (VGPR) at allo-HCT, but this effect was not statistically significant at 3 and 5 years after allo-HCT. However, DFS and OS were consistently significantly higher for patients transplanted in CR or VGPR compared to patients with more advanced disease. This observation held throughout the first 5 years following allo-HCT.
Table 3d.
Univariate probabilities of outcomes by disease status prior to transplant
| CR, VGPR | PR | MR, NR, Progressive | P-value | ||||
|---|---|---|---|---|---|---|---|
|
| |||||||
| Outcome event | N eval. |
Prob (95% CI)a | N eval. |
Prob (95% CI)a | N eval. |
Prob (95% CI)a | |
| ANC > 0.5 × 10⁹/L | 41 | 20 | 28 | ||||
| @ 28 days | 85 (69-93) | 80 (55-92) | 89 (68-97) | 0.6971 | |||
| @100 days | 93 (78-98) | 100 | 89 (68-97) | ||||
| Platelets > 20 × 109 /L | 34 | 19 | 25 | ||||
| @ 60 days | 69 (50-82) | 57 (30-76) | 48 (27-66) | 0.2639 | |||
| @100 days | 72 (53-85) | 62 (35-81) | 52 (31-70) | 0.2919 | |||
| Acute GVHD, Grades 2-4 | 36 | 19 | 25 | ||||
| @100 days | 19 (9-34) | 32 (13-52) | 36 (18-55) | 0.3178 | |||
| @ 180 days | 19 (9-34) | 32 (13-52) | 40 (21-58) | 0.2031 | |||
| Chronic GVHD | 41 | 20 | 28 | ||||
| @ 1 year | 5 (1-15) | 10 (2-28) | 25 (11-42) | 0.0755 | |||
| @ 3 years | 7 (2-18) | 10 (2-28) | 25 (11-42) | 0.1634 | |||
| @5 years | 7 (2-18) | 10 (2-28) | 25 (11-42) | 0.1634 | |||
| Transplant-related mortality | 41 | 19 | 33 | ||||
| @ 100days | 15 (6-27) | 21 (7-41) | 24 (11-40) | 0.5641 | |||
| @ 1 year | 15 (6-27) | 21 (7-41) | 36 (21-52) | 0.0973 | |||
| @ 3 years | 15 (6-27) | 21 (7-41) | 36 (21-52) | 0.0973 | |||
| @ 5 years | 15 (6-27) | 21 (7-41) | 36 (21-52) | 0.0973 | |||
| Relapse | 41 | 19 | 33 | ||||
| @ 1 year | 18 (8-31) | 67 (41-84) | 48 (31-64) | <.0001 | |||
| @ 3 years | 44 (28-59) | 67 (41-84) | 55 (36-70) | 0.223 | |||
| @ 5 years | 47 (30-61) | 67 (41-84) | 61 (42-75) | 0.2627 | |||
| Disease-free survival | 41 | 19 | 33 | ||||
| @ 1 year | 67 (50-80) | 12 (2-31) | 16 (6-29) | <.0001 | |||
| @ 3 years | 41 (26-56) | 12 (2-31) | 9 (2-22) | 0.0019 | |||
| @ 5 years | 39 (24-54) | 12 (2-31) | 3 (0-13) | 0.0001 | |||
| Overall survival | 50 | 25 | 38 | ||||
| @ 1 year | 79 (65-88) | 43 (22-62) | 39 (24-55) | <.0001 | |||
| @ 3 years | 52 (37-65) | 14 (4-32) | 11 (4-24) | <.0001 | |||
| @ 5 years | 47 (32-61) | 9 (2-26) | 6 (1-16) | <.0001 | |||
Abbreviations: VGPR- Very good partial response; PR- Partial response; MR- Minimal response; NR- No response
Probabilities of ANC>0.5 × 10⁹/L, Platelets > 20 × 109 /L, acute GVHD, chronic GVHD, treatment related mortality and relapse were calculated using the cumulative incidence estimate. Probabilities of overall survival and disease free survival were calculated using the Kaplan-Meier product limit estimate
Outcome for patients without prior auto-HCT in CR, VGPR, or PR
For the patients proceeding directly to allo-HCT (with no prior history of auto-HCT) in CR, VGPR, or PR, the treatment-related mortality was 15%, with no occurrences after the first 100 days post-HCT (Table 4). DFS declined from 59% at 1-year post –HCT to 37% at 5-years post-HCT. Disease recurrence rates at 1-year post-HCT were 26%, rising to 48% at 5-years post-HCT.
Table 4.
Outcomes of patients by disease status prior to transplant for patients without prior auto transplants
| Outcome event | In CR, VGPR, PR | In MR, NR, progressive | P-value | ||
|---|---|---|---|---|---|
| N eval. | Prob (95% CI)a | N eval. | Prob (95% CI)a | ||
| Transplant-related mortality | 41 | 19 | |||
| @ 100days | 15 (6-27) | 32 (13-52) | 0.1582 | ||
| @ 1 year | 15 (6-27) | 42 (20-62) | 0.0292 | ||
| @ 3 years | 15 (6-27) | 42 (20-62) | 0.0292 | ||
| @ 5 years | 15 (6-27) | 42 (20-62) | 0.0292 | ||
| Relapse | 41 | 19 | |||
| @ 1 year | 26 (13-40) | 37 (17-57) | 0.4068 | ||
| @ 3 years | 45 (29-60) | 47 (24-67) | 0.8577 | ||
| @ 5 years | 48 (31-62) | 53 (29-72) | 0.7178 | ||
| Disease-free survival | 41 | 19 | P_overall<0.0001 | ||
| @ 1 year | 59 (42-73) | 21 (7-41) | 0.0017 | ||
| @ 3 years | 41 (25-55) | 11 (2-28) | 0.0048 | ||
| @ 5 years | 38 (23-53) | 5 (0-21) | 0.0005 | ||
| Overall survival | 55 | 24 | P_overall<0.0001 | ||
| @ 1 year | 67 (52-78) | 44 (24-63) | 0.0644 | ||
| @ 3 years | 45 (31-59) | 13 (3-30) | 0.0015 | ||
| @ 5 years | 41 (27-54) | 9 (2-24) | 0.0006 | ||
Outcome by conditioning regimen
The majority of patients received a myeloablative conditioning regimen (67%). Of the 96 patients receiving an ablative regimen, only 19 had undergone prior auto-HCT. Of the 35 receiving a reduced intensity or non-myeloablative regimen (RIC), 20 had undergone a prior auto-HCT. TRM was significantly lower at 100 days post-HCT for those receiving a reduced intensity regimen (9% versus 23%, p-0.0437) but was not statistically significant thereafter. Recipients of RIC regimens had higher relapse rates at all time points post-HCT. DFS at one-year and OS at 3 years post-HCT (Table 7), were lower for recipients of RIC regimens.
Table 7.
Outcomes by conditioning regimen subtype
| Outcome event | Non-myeloablative/RIC | Myeloablative | P-value | ||
|---|---|---|---|---|---|
| N eval. | Prob (95% CI)a | N eval. | Prob (95% CI) | ||
| Transplant-related mortality | 33 | 73 | |||
| @ 100days | 9 (2-22) | 23 (14-33) | 0.0437 | ||
| @ 1 year | 15 (6-30) | 30 (20-41) | 0.0742 | ||
| @ 3 years | 19 (8-34) | 30 (20-41) | 0.1803 | ||
| @ 5 years | 19 (8-34) | 30 (20-41) | 0.1803 | ||
| Relapse | |||||
| @ 1 year | 65 (46-79) | 27 (17-37) | 0.0001 | ||
| @ 3 years | 69 (49-82) | 43 (31-54) | 0.011 | ||
| @ 5 years | 69 (49-82) | 47 (35-58) | 0.036 | ||
| Disease-free survival | 33 | 73 | P_overall=0.167 | ||
| @ 1 year | 19 (8-34) | 43 (31-54) | 0.0097 | ||
| @ 3 years | 13 (4-27) | 27 (17-38) | 0.0776 | ||
| @ 5 years | 13 (4-27) | 22 (13-33) | 0.2175 | ||
| Overall survival | 35 | 96 | P_overall=0.128 | ||
| @ 1 year | 51 (33-67) | 56 (45-65) | 0.6248 | ||
| @ 3 years | 16 (6-30) | 34 (25-44) | 0.026 | ||
| @ 5 years | 16 (6-30) | 25 (17-35) | 0.2348 | ||
Abreviations: CI: confidence interval, RIC: reduced intensity conditioning
DISCUSSION
This study demonstrates that allo-HCT for neuroblastoma is uncommon, accounting for 4% of all transplants for neuroblastoma in this publication and 3% (124 of 4098) reported by EBMT (8). In this cohort of patients with high-risk neuroblastoma, 20% (95% CI 13-27%) of subjects were alive without disease recurrence at five years after allo-HCT. Reflecting improvements in HCT practice, in this cohort graft failure and TRM were not significant causes of treatment failure; however, disease recurrence remained the most common barrier to transplant success. It is important to recognize that this study population included only first allogeneic transplants, and excluded those who had undergone prior allo-HCT. However, as expected for patients with high-risk neuroblastoma, a significant proportion of patients had undergone prior autologous transplantation, which is the standard treatment for these patients. However, it was surprising that 68% of the patients had not undergone prior autologous transplantation, receiving allogeneic transplant as their initial transplant consolidative therapy. Therefore, a portion of this patient population is unique in that the treating physicians proceeded directly to allo-HCT rather than auto-HCT.
Most series of auto-HCT report DFS rates approximating 45% from diagnosis with relapse being the most common cause of patient mortality3, 4, although two phase 2 trials utilizing multiple cycles of HCT have reported DFS rates of ~55% 18-20. Persistent disease may cause relapse, although it has also been hypothesized that disease contamination in infused stem cells may also contribute to recurrence 3, 4, 21. However, tumor cell contamination in PBSC is low, even when the cells are collected from a patient with residual tumor in the marrow22, and a recent trial from the Children’s Oncology Group failed to detect an impact of tumor cell purging of PBSC used for auto-HCT23. Using allogeneic marrow certainly avoids the possibility of infusing contaminating tumor in the PBSC product, but at the expense of the complications of allogenicity such as graft failure, GVHD and delayed immune reconstitution. In this series the authors cannot comment on why some patients proceeded directly to allo-HCT and did not undergo auto-HCT. This decision was made by the treating physician and the registry does not collect this information. It is conceivable that patients were unable to have adequate numbers of autologous hematopoietic progenitor cells collected, were unable to have tumor-free grafts obtained, or had progressive disease making auto-HCT impractical. Certainly patients who had a matched related donor seemed to be more common in our series than other allogeneic donor types.
Recently, with the addition of the post-transplant immunotherapy with the chimeric anti-GD2 antibody, the Children’s Oncology Group has reported DFS rates approaching 65% from the point of auto-HCT for neuroblastoma 5. There are no large series of outcomes for allo-HCT in neuroblastoma, with the present report being the largest series collected to date. Recently, at the 2012 EBMT meeting, a group from Japan reported on retrospective outcomes after allo UCBT for neuroblastoma24. In a cohort of 75 patients, differences were again seen between those in a first CR/VGPR vs. other patients (51.5% 3 year EFS vs. 38.5%, respectively). Although a direct comparison is not possible, the overall 3 year EFS of the UCBT group in our cohort was 17%. Case reports and small series have suggested that a graft-versus-malignancy effect may exist, but investigators are unable to quantify the survival advantage, if any, that is seen with this modality9-11, 25. There is indirect evidence that neuroblastoma may respond to a graft-versus-tumor effect after allo-HCT or other immunomodulatory therapies. This observation is supported by the use of such therapies to treat this disorder using dendritic cells, natural killer cells, and anti-GD2 antibodies26, 27. The DFS rates reported in this study are inferior for the entire group when compared to the baseline of 45-55% reported for auto-HCT. However, a direct comparison is not possible given the potential differences in disease responsiveness and relapse risk between Group 1, Group 2, and large reported cohorts of neuroblastoma patients who underwent auto-HCT after induction chemotherapy. When examining the patients in Group 1, the DFS rates compare favorably given the degree of HLA mismatch between donors and recipients, the percentage of recipients with poor performance scores, and the extensive prior therapy of this patient population. The use of novel agents such as immunomodulatory agents and radioactive treatments may further increase survival 28.
These outcomes, however, remain poor. Although 37% of subjects were alive in remission at one year after HCT, only 20% were alive and free of disease progression at five years post HCT. For recipients who had not received a prior auto-HCT, 48% and 27% were alive and in remission at one and five years post-allogeneic HCT, respectively. It is quite likely that this group was at higher risk for relapse than a group of patients undergoing auto-HCT for consolidation after induction therapy. Only 23% of this group had chemosensitive disease (judged by their treating physician) although many of them were in CR, VGPR, or PR. Thus, it is difficult to discern a positive impact of allo-HCT in this group of patients without clearer data regarding disease risk. Patients who had undergone an auto-HCT at any point prior to allo-HCT had extremely poor outcomes, with 19% and 6% alive and in remission at 1 and 5 years post-allo-HCT. In addition to the fact that the patients in Group 2 likely had higher-risk disease than those in Group 1, potential reasons for the differences in Group 1 and Group 2 include: i) that there was a fraction of patients undergoing allo-HCT without a prior autograft who would have been cured using a conventional auto-HCT, ii) less treatment prior to the allograft, or ii) the possibility that the use of allo-HCT earlier prevented the development of tumor resistance.
It is noteworthy that even patients with chemotherapy-resistant disease were curable in our series, suggesting that in some cases an immunologic graft-versus-tumor effect may be operational, although in this series there was no relationship between outcome and acute or chronic GVHD, similar to other reports 9-11, 26. It is possible that another immunologic mechanism distinct from GVHD may be mediating the antitumor effects 4. Our study supports the observation that chemotherapy-resistant disease is a marker for poor outcome, although it may not be an absolute contraindication to allo-HCT. It is unclear which portions of the donor immune system, if any, mediate this effect. It is postulated that T-cell alloreactivity of NK cell mediated cell destruction may be operational 29, 30, but has not been clearly demonstrated.
The study is limited by its retrospective nature and the lack of data regarding the underlying reasons behind the clinical decisions to utilize allo-HCT. A significant number of the recipients in this trial had low performance scores and chemorefractory disease (Table 1). These characteristics suggest that the treating clinicians were considering an allo-HCT to reduce relapse rates in this high-risk group. This analysis does not attempt to compare outcomes of subjects with neuroblastoma based on donor-recipient relationship or HLA mismatch. Our results suggest that allo-HCT can result in long-term DFS in some patients with neuroblastoma. However, it is unclear which patients may benefit from this modality. Future investigation of allogeneic approaches in this disease should focus on dissecting immunological parameters that define an increased likelihood of a graft-vs.-neuroblastoma effect, hopefully leading to decreases in post-transplant disease recurrence and improved survival in patients with resistant disease30.
Figure 1.
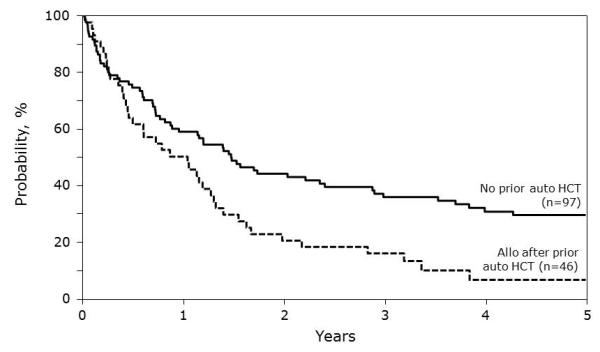
Overall survival following allogeneic HCT for neuroblastoma.
ACKNOWLEDGMENTS
The CIBMTR is supported by Public Health Service Grant/Cooperative Agreement U24- CA76518 from the National Cancer Institute (NCI), the National Heart, Lung and Blood Institute (NHLBI) and the National Institute of Allergy and Infectious Diseases (NIAID); a Grant/Cooperative Agreement 5U01HL069294 from NHLBI and NCI; a contract HHSH234200637015C with Health Resources and Services Administration (HRSA/DHHS); two Grants N00014-06-1-0704 and N00014-08-1-0058 from the Office of Naval Research; and grants from Allos, Inc.; Amgen, Inc.; Angioblast; Anonymous donation to the Medical College of Wisconsin; Ariad; Be the Match Foundation; Blue Cross and Blue Shield Association; Buchanan Family Foundation; CaridianBCT; Celgene Corporation; CellGenix, GmbH; Children’s Leukemia Research Association; Fresenius-Biotech North America, Inc.; Gamida Cell Teva Joint Venture Ltd.; Genentech, Inc.; Genzyme Corporation; GlaxoSmithKline; HistoGenetics, Inc.; Kiadis Pharma; The Leukemia & Lymphoma Society; The Medical College of Wisconsin; Merck & Co, Inc.; Millennium: The Takeda Oncology Co.; Milliman USA, Inc.; Miltenyi Biotec, Inc.; National Marrow Donor Program; Optum Healthcare Solutions, Inc.; Osiris Therapeutics, Inc.; Otsuka America Pharmaceutical, Inc.; RemedyMD; Sanofi; Seattle Genetics; Sigma-Tau Pharmaceuticals; Soligenix, Inc.; StemCyte, A Global Cord Blood Therapeutics Co.; Stemsoft Software, Inc.; Swedish Orphan Biovitrum; Tarix Pharmaceuticals; Teva Neuroscience, Inc.; THERAKOS, Inc.; and Wellpoint, Inc. The views expressed in this article do not reflect the official policy or position of the National Institute of Health, the Department of the Navy, the Department of Defense, or any other agency of the U.S. Government.
Footnotes
CONFLICT OF INTEREST: None
References
- 1.Fish JD, Grupp SA. Stem cell transplantation for neuroblastoma. Bone Marrow Transplant. 2008;41(2):159–65. doi: 10.1038/sj.bmt.1705929. [DOI] [PMC free article] [PubMed] [Google Scholar]
- 2.Maris JM, Hogarty MD, Bagatell R, Cohn SL. Neuroblastoma. Lancet. 2007;369(9579):2106–20. doi: 10.1016/S0140-6736(07)60983-0. [DOI] [PubMed] [Google Scholar]
- 3.Matthay KK, Villablanca JG, Seeger RC, Stram DO, Harris RE, Ramsay NK, et al. Treatment of high-risk neuroblastoma with intensive chemotherapy, radiotherapy, autologous bone marrow transplantation, and 13-cis-retinoic acid. Children’s Cancer Group. N Engl J Med. 1999;341(16):1165–73. doi: 10.1056/NEJM199910143411601. [DOI] [PubMed] [Google Scholar]
- 4.Matthay KK, Reynolds CP, Seeger RC, Shimada H, Adkins ES, Haas-Kogan D, et al. Long-term results for children with high-risk neuroblastoma treated on a randomized trial of myeloablative therapy followed by 13-cis-retinoic acid: a children’s oncology group study. J Clin Oncol. 2009;27(7):1007–13. doi: 10.1200/JCO.2007.13.8925. [DOI] [PMC free article] [PubMed] [Google Scholar]
- 5.Yu AL, Gilman AL, Ozkaynak MF, London WB, Kreissman SG, Chen HX, et al. Anti-GD2 antibody with GM-CSF, interleukin-2, and isotretinoin for neuroblastoma. N Engl J Med. 363(14):1324–34. doi: 10.1056/NEJMoa0911123. [DOI] [PMC free article] [PubMed] [Google Scholar]
- 6.Matthay KK, Seeger RC, Reynolds CP, Stram DO, O’Leary MC, Harris RE, et al. Allogeneic versus autologous purged bone marrow transplantation for neuroblastoma: a report from the Childrens Cancer Group. J Clin Oncol. 1994;12(11):2382–9. doi: 10.1200/JCO.1994.12.11.2382. [DOI] [PubMed] [Google Scholar]
- 7.Philip T, Ladenstein R, Lasset C, Hartmann O, Zucker JM, Pinkerton R, et al. 1070 myeloablative megatherapy procedures followed by stem cell rescue for neuroblastoma: 17 years of European experience and conclusions. European Group for Blood and Marrow Transplant Registry Solid Tumour Working Party. Eur J Cancer. 1997;33(12):2130–5. doi: 10.1016/s0959-8049(97)00324-9. [DOI] [PubMed] [Google Scholar]
- 8.Ladenstein R, Potschger U, Hartman O, Pearson AD, Klingebiel T, Castel V, et al. 28 years of high-dose therapy and SCT for neuroblastoma in Europe: lessons from more than 4000 procedures. Bone Marrow Transplant. 2008;41(Suppl 2):S118–27. doi: 10.1038/bmt.2008.69. [DOI] [PubMed] [Google Scholar]
- 9.Jubert C, Wall DA, Grimley M, Champagne MA, Duval M. Engraftment of unrelated cord blood after reduced-intensity conditioning regimen in children with refractory neuroblastoma: a feasibility trial. Bone Marrow Transplant. 46(2):232–7. doi: 10.1038/bmt.2010.107. [DOI] [PubMed] [Google Scholar]
- 10.Strullu M, Rialland F, Cahu X, Brissot E, Corradini N, Thomas C, et al. Allogeneic hematopoietic stem cell transplantation following reduced-intensity conditioning regimen in children: a single-center experience. Eur J Haematol. doi: 10.1111/j.1600-0609.2012.01776.x. [DOI] [PubMed] [Google Scholar]
- 11.Pession A, Masetti R, Di Leo C, Franzoni M, Prete A. HLA-mismatched hematopoietic stem cell tranplantation for pediatric solid tumors. Pediatr Rep. 3(Suppl 2):e12. doi: 10.4081/pr.2011.s2.e12. [DOI] [PMC free article] [PubMed] [Google Scholar]
- 12.Sung KW, Park JE, Chueh HW, Lee SH, Yoo KH, Koo HH, et al. Reduced-intensity allogeneic stem cell transplantation for children with neuroblastoma who failed tandem autologous stem cell transplantation. Pediatr Blood Cancer. 57(4):660–5. doi: 10.1002/pbc.23035. [DOI] [PubMed] [Google Scholar]
- 13.Weisdorf D, Spellman S, Haagenson M, Horowitz M, Lee S, Anasetti C, et al. Classification of HLA-matching for retrospective analysis of unrelated donor transplantation: revised definitions to predict survival. Biol Blood Marrow Transplant. 2008;14(7):748–58. doi: 10.1016/j.bbmt.2008.04.003. [DOI] [PMC free article] [PubMed] [Google Scholar]
- 14.Giralt S, Ballen K, Rizzo D, Bacigalupo A, Horowitz M, Pasquini M, et al. Reduced-intensity conditioning regimen workshop: defining the dose spectrum. Report of a workshop convened by the center for international blood and marrow transplant research. Biol Blood Marrow Transplant. 2009;15(3):367–9. doi: 10.1016/j.bbmt.2008.12.497. [DOI] [PMC free article] [PubMed] [Google Scholar]
- 15.Bacigalupo A, Ballen K, Rizzo D, Giralt S, Lazarus H, Ho V, et al. Defining the intensity of conditioning regimens: working definitions. Biol Blood Marrow Transplant. 2009;15(12):1628–33. doi: 10.1016/j.bbmt.2009.07.004. [DOI] [PMC free article] [PubMed] [Google Scholar]
- 16.Przepiorka D, Weisdorf D, Martin P, Klingemann HG, Beatty P, Hows J, et al. 1994 Consensus Conference on Acute GVHD Grading. Bone Marrow Transplant. 1995;15(6):825–8. [PubMed] [Google Scholar]
- 17.Atkinson K, Horowitz MM, Gale RP, van Bekkum DW, Gluckman E, Good RA, et al. Risk factors for chronic graft-versus-host disease after HLA-identical sibling bone marrow transplantation. Blood. 1990;75(12):2459–64. [PubMed] [Google Scholar]
- 18.George RE, Li S, Medeiros-Nancarrow C, Neuberg D, Marcus K, Shamberger RC, et al. High-risk neuroblastoma treated with tandem autologous peripheral-blood stem cell-supported transplantation: long-term survival update. J Clin Oncol. 2006;24(18):2891–6. doi: 10.1200/JCO.2006.05.6986. [DOI] [PubMed] [Google Scholar]
- 19.Grupp SA, Stern JW, Bunin N, Nancarrow C, Ross AA, Mogul M, et al. Tandem high-dose therapy in rapid sequence for children with high-risk neuroblastoma. J Clin Oncol. 2000;18(13):2567–75. doi: 10.1200/JCO.2000.18.13.2567. [DOI] [PubMed] [Google Scholar]
- 20.Kletzel M, Katzenstein HM, Haut PR, Yu AL, Morgan E, Reynolds M, et al. Treatment of high-risk neuroblastoma with triple-tandem high-dose therapy and stem-cell rescue: results of the Chicago Pilot II Study. J Clin Oncol. 2002;20(9):2284–92. doi: 10.1200/JCO.2002.06.060. [DOI] [PubMed] [Google Scholar]
- 21.Rill DR, Santana VM, Roberts WM, Nilson T, Bowman LC, Krance RA, et al. Direct demonstration that autologous bone marrow transplantation for solid tumors can return a multiplicity of tumorigenic cells. Blood. 1994;84(2):380–3. [PubMed] [Google Scholar]
- 22.Park JR, Scott JR, Stewart CF, London WB, Naranjo A, Santana VM, et al. Pilot induction regimen incorporating pharmacokinetically guided topotecan for treatment of newly diagnosed high-risk neuroblastoma: a Children’s Oncology Group study. J Clin Oncol. 29(33):4351–7. doi: 10.1200/JCO.2010.34.3293. [DOI] [PMC free article] [PubMed] [Google Scholar]
- 23.Kreissman SG, Villablanca JG, Diller L, London WB, Maris JM, et al. Response and toxicity to a dose-intensive multi-agent chemotherapy induction regimen for high risk neuroblastoma (HR-NB): a Children’s Oncology Group (COG A 3973) study. J Clin Oncol. 2007;25:9505. [Google Scholar]
- 24.Takahashi Y, Matsumoto K, Fujisaki H, Iwasaki F, Hashii Y, Nakamura K, et al. Unrelated cord blood transplantation for children with high-risk or relapsed neuroblastoma. Bone Marrow Transpl. 2012;47:S47. [Google Scholar]
- 25.Inoue M, Nakano T, Yoneda A, Nishikawa M, Nakayama M, Yumura-Yagi K, et al. Graft-versus-tumor effect in a patient with advanced neuroblastoma who received HLA haplo-identical bone marrow transplantation. Bone Marrow Transplant. 2003;32(1):103–6. doi: 10.1038/sj.bmt.1704070. [DOI] [PubMed] [Google Scholar]
- 26.Ash S, Stein J, Askenasy N, Yaniv I. Immunomodulation with dendritic cells and donor lymphocyte infusion converge to induce graft vs neuroblastoma reactions without GVHD after allogeneic bone marrow transplantation. Br J Cancer. 103(10):1597–605. doi: 10.1038/sj.bjc.6605924. [DOI] [PMC free article] [PubMed] [Google Scholar]
- 27.Ash S, Gigi V, Askenasy N, Fabian I, Stein J, Yaniv I. Graft versus neuroblastoma reaction is efficiently elicited by allogeneic bone marrow transplantation through cytolytic activity in the absence of GVHD. Cancer Immunol Immunother. 2009;58(12):2073–84. doi: 10.1007/s00262-009-0715-6. [DOI] [PMC free article] [PubMed] [Google Scholar]
- 28.Toporski J, Garkavij M, Tennvall J, Ora I, Gleisner KS, Dykes JH, et al. High-dose iodine-131-metaiodobenzylguanidine with haploidentical stem cell transplantation and posttransplant immunotherapy in children with relapsed/refractory neuroblastoma. Biol Blood Marrow Transplant. 2009;15(9):1077–85. doi: 10.1016/j.bbmt.2009.05.007. [DOI] [PubMed] [Google Scholar]
- 29.Delgado DC, Hank JA, Kolesar J, Lorentzen D, Gan J, Seo S, et al. Genotypes of NK cell KIR receptors, their ligands, and Fcgamma receptors in the response of neuroblastoma patients to Hu14.18-IL2 immunotherapy. Cancer Res. 70(23):9554–61. doi: 10.1158/0008-5472.CAN-10-2211. [DOI] [PMC free article] [PubMed] [Google Scholar]
- 30.Venstrom JM, Zheng J, Noor N, Danis KE, Yeh AW, Cheung IY, et al. KIR and HLA genotypes are associated with disease progression and survival following autologous hematopoietic stem cell transplantation for high-risk neuroblastoma. Clin Cancer Res. 2009;15(23):7330–4. doi: 10.1158/1078-0432.CCR-09-1720. [DOI] [PMC free article] [PubMed] [Google Scholar]