Abstract
Chronic kidney disease risk factors may associate with the estimated glomerular filtration rate (eGFR) differently than with the measured GFR. To examine this, we evaluated 1150 patients (mean age 65) in two community cohorts for risk factors, measured GFR by iothalamate clearance, and eGFR based on creatinine (Cr), cystatin C (CysC), or both. The interaction between each risk factor and eGFR (relative to measured GFR) identified risk factor associations with eGFR along non-GFR pathways. In a subset of 40 patients with two visits, the mean coefficient of variation was 8.2% for measured GFR, 6.4% for eGFRCr, 8.2% for eGFRCr-CysC, and 10.7% for eGFRCysC. The measured GFR was better correlated with eGFRCr-CysC (r, 0.74) than eGFRCr (r, 0.70) or eGFRCysC (r, 0.68). Lower measured GFR associated with lower 24-hour urine creatinine, albuminuria, hypertension, diabetes, higher triglycerides, and higher uric acid. Lower eGFRCr had these same associations except for an association with higher 24-hour urine creatinine along a non-GFR pathway. Lower eGFRCysC and eGFRCr-CysC also had these same associations but also associated with obesity, albuminuria, hypertension, diabetes, higher triglycerides, higher C-reactive protein, and higher uric acid along non-GFR pathways. Thus, cystatin C improves estimation of GFR over creatinine alone; however, the association between most of the risk factors and GFR was more accurate by eGFR based on creatinine alone. This is explained by the association of these risk factors with the non-GFR determinants of cystatin C.
Introduction
Estimated glomerular filtration rate (eGFR) based on endogenous filtration markers (mainly creatinine) is widely used in clinical practice instead of a gold-standard measured GFR (mGFR) based on exogenous markers (e.g., iothalamate). Cystatin C based eGFR with creatinine (eGFRCr-CysC ) or without creatinine (eGFRCysC ) has also been advocated as it improves risk prediction for CKD complications over serum creatinine based eGFR (eGFRCr) alone.1–3 Recent studies have found chronic kidney disease (CKD) risk factors and outcomes have an association with eGFRCr even after adjustment for mGFR.4–8 These same studies have found stronger residual associations with cystatin C or eGFRCysC than eGFRCr. Whether these residual associations are due to the non-GFR determinants of cystatin C or better estimation of GFR with cystatin C has been widely debated. Several investigators have suggested that collinearity, residual confounding, and measurement error of mGFR largely accounts for residual associations with eGFR. In particular, eGFR may have stronger associations with CKD risk factors and outcomes than mGFR if eGFR is more reliable (precise) than mGFR.
A limitation of prior studies is that they have been performed in populations selected on the presence 5–8 or absence 4 of CKD, determined to some extent by GFR. Applying restrictions on GFR when sampling the study population can bias comparisons between eGFR and mGFR. There is also a paucity of data on the test-retest reliablity of eGFR compared to mGFR. To address these limitations, we studied eGFR and mGFR in two community based cohorts not selected on GFR. We obtained duplicates of eGFR and mGFR in a subset of the same subjects to compare reliability between GFR methods. Finally, we used statistical methods that minimize the impact of mGFR imprecision on residual association with eGFR. The objective of this study was to determine if the association of established CKD risk factors with eGFR based on creatinine and/or cystatin C differed from the same association of these risk factors with mGFR.
Results
There were 1289 participants in the study; 823 persons from the Genetic Epidemiology Network of Arteriopathy (GENOA) cohort and 466 persons from the Epidemiology of Coronary Artery Calcification (ECAC) cohort. Of these, there were 1150 persons (725 GENOA and 425 ECAC) with a valid mGFR. The data was further restricted to 1093 persons (687 GENOA and 406 ECAC) who had all eGFR and CKD risk factor data available. Table 1 shows the CKD risk factor and GFR characteristics of the study sample. In general, the GENOA cohort had more CKD risk factors but a similar mean mGFR compared to the ECAC cohort.
Table 1.
CKD risk factors and GFR by each method in the GENOA and ECAC cohort study samples
| Combined (N=1093) | GENOA (n=687) | ECAC (n=406) | |
|---|---|---|---|
| CKD risk factors | Mean ± SD or % | Mean ± SD or % | Mean ± SD or % |
|
| |||
| Age (at time of GFR measurements), y | 65 ± 9 | 65 ± 9 | 66 ± 9 |
| Sex (male) | 43% | 41% | 48% |
| Body mass index, kg/m2 | 30.2 ± 5.8 | 31.1 ± 5.9 | 28.8 ± 5.2 |
| 24-h urine albumin, mg | 21 ± 61 | 24 ± 61 | 16 ± 60 |
| 24-h urine creatinine, mg | 1311 ± 467 | 1293 ± 464 | 1342 ± 470 |
| Urine albumin to creatinine ratio | 16 ± 54 | 19 ± 58 | 12 ± 46 |
| Urine albumin to creatinine ratio ≥ 30 mg/g | 8.1% | 11% | 4.2% |
| Hypertension | 54% | 73% | 22% |
| Diabetes | 11% | 13% | 6.9% |
| Smoker | 7.4% | 7.3% | 7.5% |
| High-density lipoprotein cholesterol, mg/dl | 51 ± 16 | 51 ± 17 | 53 ± 16 |
| Log triglycerides, mg/dl | 4.7 ± 0.48 | 4.8 ± 0.48 | 4.6 ± 0.46 |
| Log C-reactive protein, mg/dl | 0.6 ± 1.0 | 0.7 ± 1.1 | 0.5 ± 1.0 |
| Uric acid, mg/dl | 5.6 ± 1.5 | 5.8 ± 1.5 | 5.3 ± 1.4 |
|
| |||
| GFR method | Mean ± SD or % | Mean ± SD or % | Mean ± SD or % |
|
| |||
| mGFR, ml/min/1.73 m2 | 80 ± 21 | 80 ± 21 | 79 ± 21 |
| eGFRCr, ml/min/1.73 m2 | 83 ± 15 | 83 ± 17 | 84 ± 13 |
| eGFRCysC, ml/min/1.73 m2 | 80 ± 20 | 78 ± 21 | 82 ± 19 |
| eGFRCr-CysC, ml/min/1.73 m2 | 82 ± 17 | 81 ± 19 | 84 ± 15 |
| Creatinine clearance, ml/min/1.73 m2 | 98 ± 29 | 97 ± 30 | 101 ± 26 |
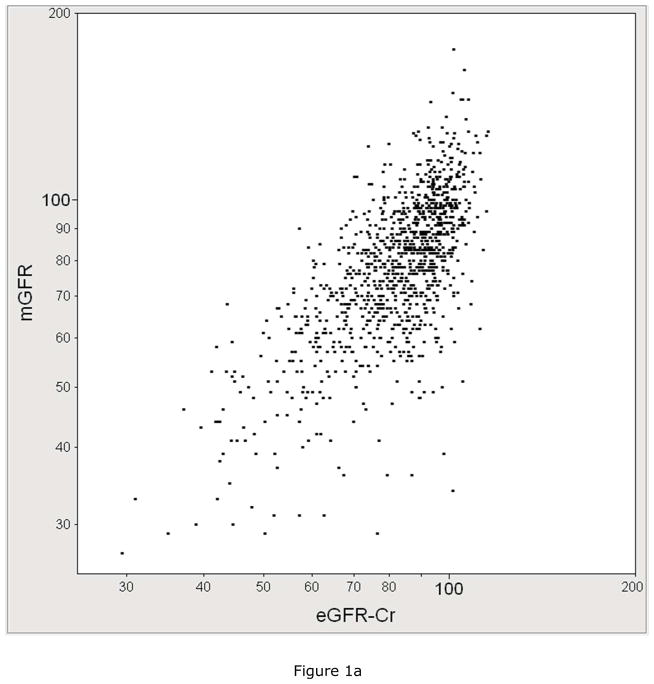
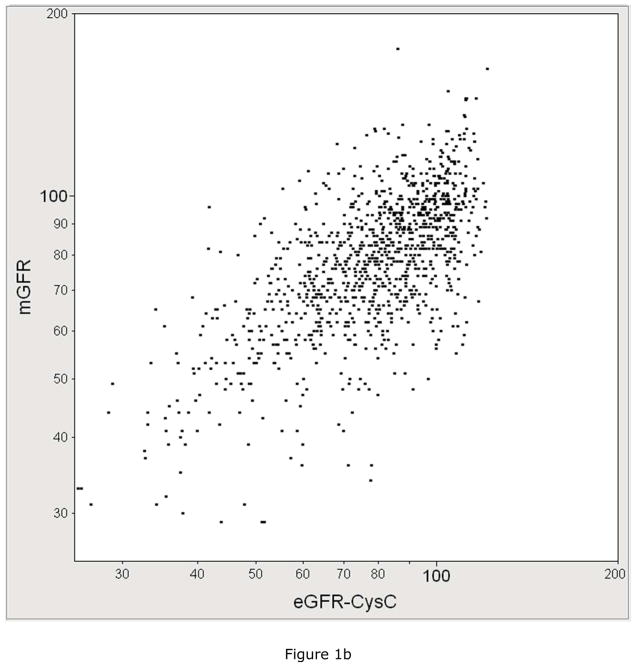
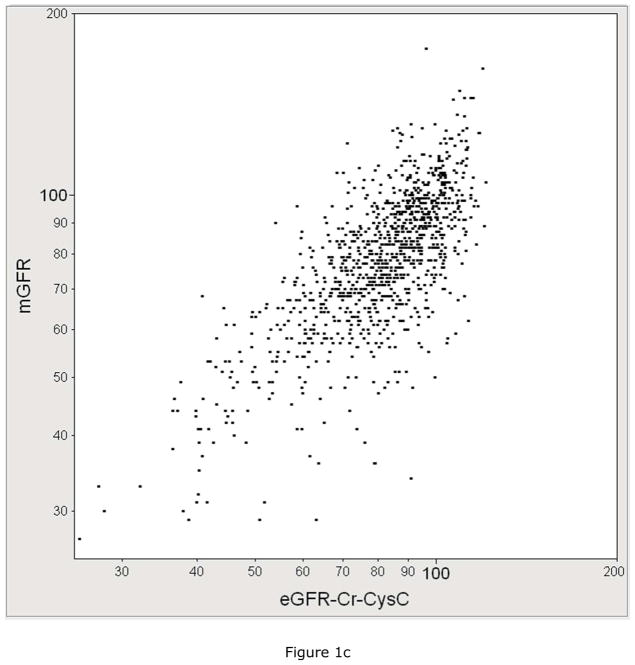
The performance of each eGFR equation in estimating mGFR was compared. Figure 1 plots mGFR against eGFR by each equation. mGFR was more correlated with eGFRCr-CysC (r=0.74, 95% CI: 0.71 to 0.77) than it was correlated with eGFRCr (r=0.70, 95% CI: 0.67 to 0.73) or with eGFRCysC (r=0.68, 95% CI: 0.65 to 0.72). The percentage of eGFR values within 30% of mGFR was higher for eGFRCr-CysC at 87% compared to 85% for eGFRCr and 83% for eGFRCysC (p<0.001 for both comparisons).
Figure 1.
The correlation between measured GFR (mGFR, Y-axis) with A) serum creatinine based estimated GFR with the CKD-EPI equation (eGFRCr, X-axis, R=0.70), B) cystatin C based estimated GFR (eGFRCysC, X-axis, R=0.68), C) serum creatinine and cystatin C based estimated GFR(eGFRCCr-CysC, X-axis, R=0.74).
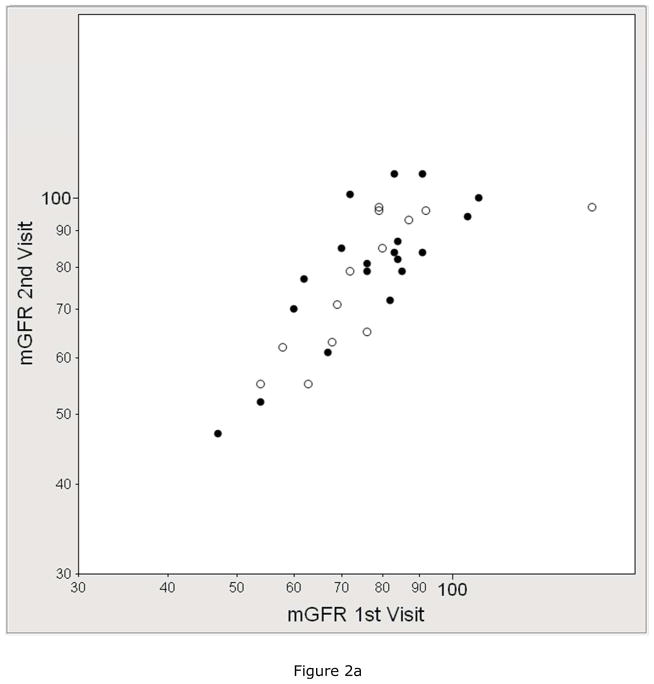
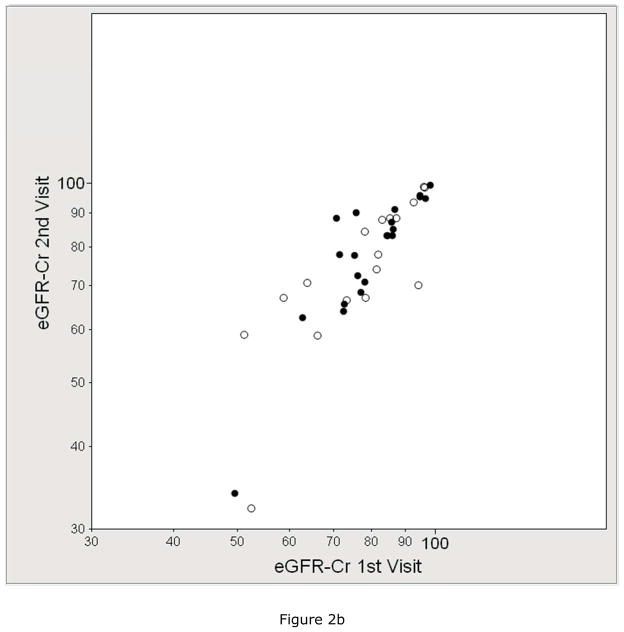
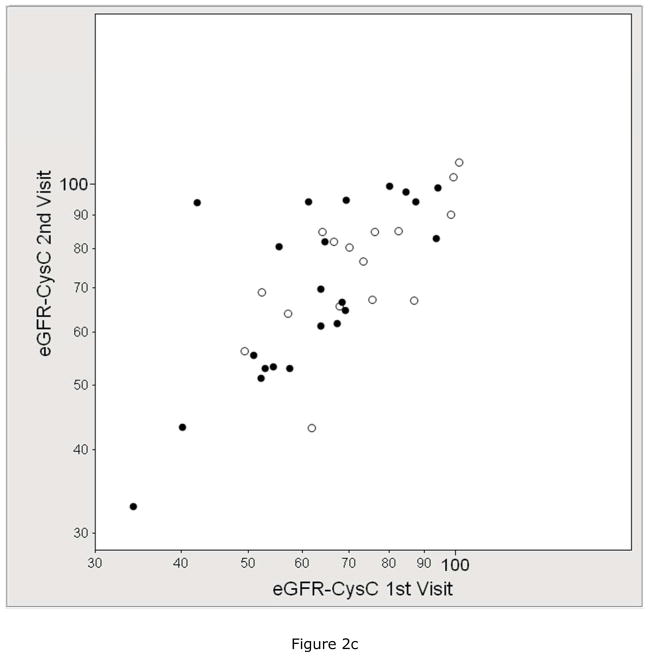
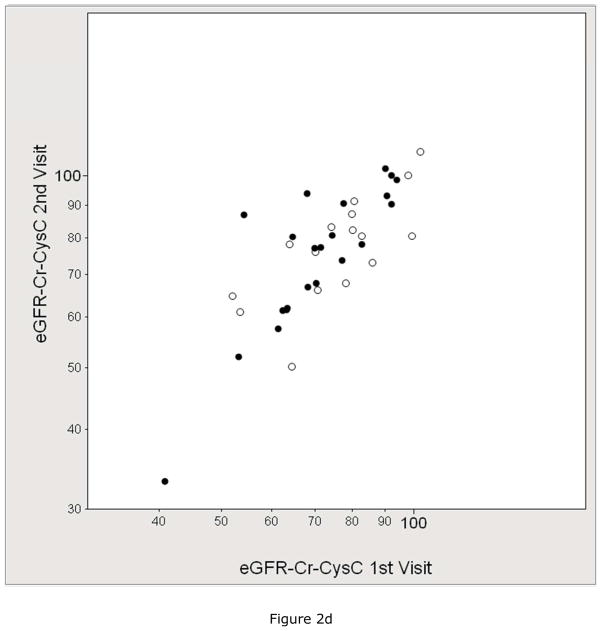
We assessed the test-retest reliability of eGFR compared to mGFR in the subset that underwent duplicate visits. Figure 2 shows the within-subject correlation by each GFR method and Table 2 shows the within-subject coefficient of variation (CV) by each GFR method. The mean CV of mGFR (8.2%) was higher than the CV of eGFRCr (6.4%), similar to the CV of eGFRCr-CysC (8.2%), and lower than the CV of eGFRCysC (10.7%) and creatinine clearance (11.3%).
Figure 2.
Reliability between duplicate visits of A) measured GFR (mGFR, r =0.76), B) estimated GFR by serum creatinine (eGFRCr, r =0.84), C) estimated GFR by cystatin C (eGFRCysC, r =0.76), and D) estimated GFR by serum creatinine and cystatin C (eGFRCr-CysC, r =0.82). The solid circle represents the GENOA subjects who were specifically recruited for 2 duplicate study visits (mean 62 days apart). The open circles represent the subjects who had 2 duplicate study visits because they were participants in both the GENOA and ECAC cohorts (mean 296 days apart).
Table 2.
Within-subject Coefficient of Variation (CV) by each method overall, GENOA repeats a mean 62 days apart, and GENOA and ECAC cohort overlap a mean 296 days apart.
| Method | CV overall (40 pairs) | CV GENOA repeats (22 pairs)* | CV GENOA-ECAC (18 pairs)* |
|---|---|---|---|
|
| |||
| Median (10%, 90%), Mean | Median (10%, 90%), Mean | Median (10%, 90%), Mean | |
| mGFR | 5.9% (1.7%, 15.3%), 8.2% | 6.1% (0.8%, 18.5%), 7.9% | 5.4% (2.0%, 14.5%), 8.8% |
| eGFRCr | 3.8% (0.5%, 15.5%), 6.4% | 2.4% (0.5%, 12.0%), 5.3% | 6.9% (0.7%, 20.9%), 7.8% |
| eGFRCysC | 6.4% (2.0%, 25.3%), 10.7%† | 5.8% (1.8%, 26.0%), 10.7% | 8.8% (2.0%, 23.1%), 10.7% |
| eGFRCr-CysC | 5.4% (1.7%, 17.8%), 8.2% | 4.5% (1.7%, 15.0%), 7.1% | 8.4% (1.7%, 17.8%), 9.7% |
| CrCl | 8.5% (2.4%, 28.3%), 11.3% † | 9.9% (3.4%, 28.3%), 11.9% | 6.1% (1.4%, 29.0%), 10.6% |
GENOA repeats a mean 62 days apart and GENOA-ECAC cohort overlap a mean 296 days apart.
p<0.05 by Wilcoxon signed rank test compared to eGFRCr
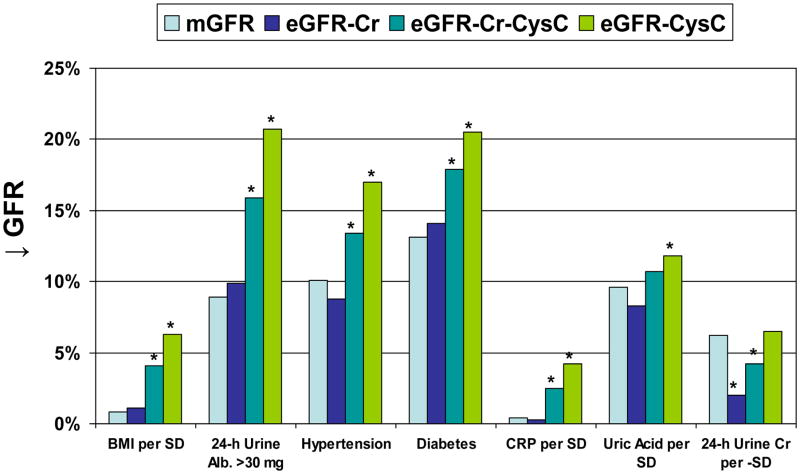
We then compared the association of each CKD risk factor with eGFR to the same association with mGFR (Table 3). Lower measured GFR was associated with older age, lower 24-h urine creatinine, higher urine albumin to creatinine ratio (UACR), hypertension, diabetes, non-smoker, lower high-density lipoprotein (HDL) cholesterol, higher triglycerides, and higher uric acid. The association of smoking with higher mGFR was not evident after adjusting for age and sex (p=0.56). In general, these risk factors associations were similar with eGFRCr, but progressively stronger with eGFRCr-CysC and eGFRCysC. An exception was the association of 24-h urine creatinine with mGFR was more similar to the same association with eGFRCysC than with eGFRCr. Figure 3 highlights the relative difference in risk factor associations with eGFR compared to mGFR.
Table 3.
Unadjusted risk factor associations with GFR by each method
| mGFR | eGFRCr | eGFRCr-CysC | eGFRCysC | |||||
|---|---|---|---|---|---|---|---|---|
|
| ||||||||
| Risk Factor | Beta (%) | P-Value | Beta (%) | P-Value | Beta (%) | P-Value | Beta (%) | P-Value |
| Age per 10 years | −11.6 | <.001 | −10.8 | <.001 | −13.5 | <.001 | −15.9 | <.001 |
| Sex (male) | 2.5 | 0.14 | −1.3 | 0.33 | 0.6 | 0.66 | 2.9 | 0.11 |
| Body mass index per SD | −0.8 | 0.36 | −1.1 | 0.08 | −4.1 | <.001 | −6.3 | <.001 |
| 24-h urine albumin per SD | −3.2 | <.001 | −2.7 | <.001 | −4.2 | <.001 | −5.3 | <.001 |
| 24-h urine creatinine per SD | 6.2 | <.001 | 2.0 | 0.002 | 4.2 | <.001 | 6.5 | <.001 |
| Log urine albumin to creatinine ratio (UACR) per SD | −5.1 | <.001 | −5.0 | <.001 | −7.4 | <.001 | −9.2 | <.001 |
| UACR ≥ 30 mg/g | −8.9 | 0.005 | −9.9 | <.001 | −15.9 | <.001 | −20.7 | <.001 |
| Hypertension | −10.1 | <.001 | −8.8 | <.001 | −13.4 | <.001 | −17.0 | <.001 |
| Diabetes | −13.1 | <.001 | −14.1 | <.001 | −17.9 | <.001 | −20.5 | <.001 |
| Smoker | 7.6 | 0.03 | 6.6 | 0.008 | 6.1 | 0.04 | 5.7 | 0.11 |
| High-density lipoprotein cholesterol per SD | 2.7 | 0.002 | 3.2 | <.001 | 4.9 | <.001 | 5.7 | <.001 |
| Log Triglyceride per SD | −3.5 | <.001 | −3.1 | <.001 | −4.9 | <.001 | −6.1 | <.001 |
| Log C-reactive protein per SD | −0.4 | 0.65 | −0.3 | 0.63 | −2.5 | <.001 | −4.2 | <.001 |
| Uric Acid per SD | −9.6 | <.001 | −8.3 | <.001 | −10.7 | <.001 | −11.8 | <.001 |
Figure 3.
The association of CKD risk factors with percentage decrease in GFR (↓ GFR) by each method (mGFR, eGFRCr, eGFRCr-CysC, and eGFRCysC). The * identifies p<0.05 for eGFR compared to mGFR using model 1 (generalized estimating equations). Risk factor associations with mGFR were more similar to those with eGFRCr than with eGFRCr-CysC or eGFRCysC. The one exception was 24-h urine creatinine where eGFRCysC was more similar to the same association with mGFR.
We then assessed whether associations with eGFR were statistically significantly different from the same associations with mGFR. Table 4 shows the association between CKD risk factors and eGFRCr or eGFRCysC after accounting for mGFR. Two different models were used for this analysis. Model 1 was an unbiased approach; the difference in regression coefficients for eGFR versus mGFR were tested by fitting risk factor × GFR method interactions using generalized estimating equations. This identified residual associations with eGFR along non-GFR pathways. The association of lower eGFRCr with CKD risk factors was not statistically significantly different from mGFR except for an association with higher 24-h urine creatinine along a non-GFR pathway. Alternatively, lower eGFRCysC and lower eGFRCr-CysC had associations with multiple CKD risk factors along non-GFR pathways: higher body mass index (BMI), higher UACR, hypertension, diabetes, lower HDL cholesterol, higher triglycerides, and higher C-reactive protein. Lower eGFRCysC also associated with hyperuricemia along a non-GFR pathway. Model 2 was a biased approach, but an approach commonly seen in the eGFR literature. eGFR was regressed on each risk factor with adjustment for mGFR as a covariate. There were substantially stronger residual associations of all CKD risk factors with eGFR after adjustment for mGFR as a covariate. Consistent with residual confounding, risk factor association in model 2 were biased toward the direction of association with mGFR (Table 3) compared to model 1.
Table 4.
Age-sex-adjusted residual risk factor associations with eGFR after accounting for mGFR
| Model 1 | Model 2 | |||||||||||
|---|---|---|---|---|---|---|---|---|---|---|---|---|
|
| ||||||||||||
| eGFRCr | eGFRCr-CysC | eGFRCysC | eGFRCr | eGFRCr-CysC | eGFRCysC | |||||||
|
| ||||||||||||
| Risk Factor | Beta (%) | P-value | Beta (%) | P-value | Beta (%) | P-Value | Beta (%) | P-value | Beta (%) | P-value | Beta (%) | P-Value |
| Body mass index per SD | −0.3 | 0.60 | −3.3 | <.001 | −5.5 | <.001 | −1.3 | 0.004 | −4.5 | <.0001 | −6.8 | <.001 |
| 24-h urine albumin per SD | 0.5 | 0.31 | −1.8 | 0.13 | −2.1 | <.001 | −1.0 | 0.04 | −2.2 | <.0001 | −3.2 | <.001 |
| 24-h urine creatinine per SD | −4.2 | <.001 | −3.3 | <.001 | 0.3 | 0.63 | −3.9 | <.001 | −2.4 | 0.002 | −0.5 | 0.59 |
| Log urine albumin to creatinine | 0.1 | 0.86 | −2.3 | <.001 | −4.2 | <.001 | −1.9 | <.001 | −3.7 | <.0001 | −5.0 | <.001 |
| ratio (UACR) per SD | ||||||||||||
| UACR ≥ 30 mg/g | −1.1 | 0.65 | −7.1 | <.001 | −11.9 | <.001 | −5.1 | 0.003 | −10.3 | <.0001 | −14.3 | <.001 |
| Hypertension | 1.4 | 0.27 | −3.2 | 0.009 | −6.8 | <.001 | −2.7 | 0.007 | −5.9 | <.0001 | −8.5 | <.001 |
| Diabetes | −1.0 | 0.62 | −4.8 | 0.01 | −7.4 | 0.002 | −7.9 | <.001 | −10.4 | <.0001 | −12.1 | <.001 |
| Smoker | −1.0 | 0.69 | −1.5 | 0.53 | −2.0 | 0.45 | 0.1 | 0.97 | −2.0 | 0.32 | −3.8 | 0.14 |
| High-density lipoprotein | 0.5 | 0.47 | 2.1 | <.001 | 3.0 | <.001 | 2.2 | <.001 | 4.2 | <.0001 | 5.7 | <.001 |
| cholesterol per SD | ||||||||||||
| Log Triglyceride per SD | 0.5 | 0.43 | −1.4 | 0.01 | −2.6 | <.001 | −1.8 | <.001 | −3.4 | <.0001 | −4.5 | <.001 |
| Log C-reactive protein per SD | 0.1 | 0.82 | −2.0 | <.001 | −3.7 | <.001 | −0.8 | 0.07 | −3.0 | <.0001 | −4.7 | <.001 |
| Uric Acid per SD | 1.4 | 0.05 | −1.0 | 0.11 | −2.2 | 0.004 | −4.7 | <.001 | −6.9 | <.0001 | −8.2 | <.001 |
Model 1 uses generalized estimating equations with eGFR and mGFR as a stacked dependent variables regressed on each CKD risk factor to compare the difference in eGFR and mGFR regression coefficients. Statistical significance determined by the statistical interaction between each CKD risk factor with eGFR relative to mGFR.
Model 2 uses standard linear regression to regress eGFR on each CKD risk factor with mGFR as a covariate. To the extent mGFR is imprecise, residual associations will be will be biased compared to Model 1.
Higher 24-h urine creatinine was the only risk factor independently associated with lower eGFRCr along a non-GFR pathway. Alternatively, higher body mass index, hypertension, and higher C-reactive protein were independent risk factors for a lower eGFRCysC along a non-GFR pathway (Table 5). Findings in Table 4 were not substantively different when the MDRD study equation was used instead of the CKD-EPI equation for eGFRCr, when an alternative equation was used for eGFRCysC,9 when urinary creatinine clearance was added as an additional GFR method in the generalized estimating equations (model 1) or when analysis was performed separately in the GENOA cohort and the ECAC cohort (data not shown).
Table 5.
Multivariable residual risk factor associations with eGFR after accounting for mGFR
| Model 1 | ||||
|---|---|---|---|---|
|
| ||||
| eGFRCr | eGFRCysC | |||
|
| ||||
| Risk Factor | Beta (%) | P-Value | Beta (%) | P-Value |
| Body mass index per SD | - | - | −4.3 | <.001 |
| 24-h urine albumin per SD | - | - | −0.9 | 0.17 |
| 24-h urine creatinine per SD | −4.2 | <.001 | - | - |
| Hypertension | - | - | −4.0 | 0.008 |
| Diabetes | - | - | −3.1 | 0.20 |
| High-density lipoprotein | - | - | 1.4 | 0.12 |
| cholesterol per SD | ||||
| Log Triglyceride per SD | - | - | 0.6 | 0.47 |
| Log C-reactive protein per SD | - | - | −1.9 | 0.02 |
| Uric Acid per SD | - | - | 0.9 | 0.31 |
Model 1 uses generalized estimating equations with eGFR and mGFR as a stacked dependent variables regressed on all the non-redundant and statistically significant CKD risk factors in Table 4 to compare the difference in eGFR and mGFR regression coefficients. Statistical significance determined by the statistical interaction between each CKD risk factor with eGFR relative to mGFR in the multivariable model. Age and sex were adjusted for as main effects in the model.
Discussion
This study found eGFRCysC and eGFRCr-CysC had a stronger association with CKD risk factors than did mGFR. Alternatively, eGFRCr had associations with CKD risk factors that were similar to those with mGFR. This was evident despite eGFRCr-CysC having the strongest correlation with mGFR. Prior studies have reported similar findings,. 4–8 but prior statistical analyses have raised concerns that residual confounding may explain associations with eGFR after adjusting for mGFR. Indeed, we also found evidence of this residual confounding (Model 2). However, using a statistical analysis that is not biased by mGFR error (Model 1), residual associations of eGFRCysC and eGFRCr-CysC with CKD risk factors were still evident. Further, in a subset with duplicate study visits, eGFRCysC and eGFRCr-CysC did not have better test-retest reliability than mGFR or eGFRCr. Thus, there was no evidence of greater precision with eGFRCysC and eGFRCr-CysC to explain their stronger association with CKD risk factors. Since mGFR is not practical in most settings, these data suggest eGFRCr is a better option for characterizing the association of CKD risk factors with true GFR than is either eGFRCysC or eGFRCr-CysC.
It has been argued that mGFR has substantially more measurement error than eGFR, but we did not find evidence of this. The reliability (mean CV) of eGFRCr (6.4%) was slightly better than mGFR (8.2%) and the reliablity of eGFRCysC (10.7%) was slightly worse. If the reliability of eGFRCysC is similar or worse to that of mGFR, then only the non-GFR determinants of eGFRCysC can explain differences in risk factor associations compared to mGFR. However, our GFR reliability findings are consistent with past studies. The African American Study of Kidney Disease study found the reliability of eGFRCr was only slightly better than that of mGFR based on multiple study visits.10 Another study found that the reliability of cystatin C (CV 13%) was much worse than the reliability of serum creatinine (CV 5%) over multiple study visits. 11
GFR is often viewed as the single most important measurement of kidney function. To the extent estimation of GFR by endogenous filtration markers is biased by non-GFR determinants, our understanding of risk factors and outcomes associated with kidney function will be distorted. This study characterizes CKD risk factors that associate with the non-GFR determinants of eGFR. It is well known that the dominant non-GFR determinant of eGFRCr is creatinine generation (24-h urine creatinine) from muscle mass.12 eGFRCr has the problem of having to be optimized either for healthy populations (higher than average muscle mass) or for CKD populations (lower than average muscle mass).13–15 Using model 1, the residual associations with lower eGFRCr were reflective of the expected association with increased muscle mass (increased 24-h urine creatinine). Unlike model 1, model 2 would implausibly suggest that greater muscle mass (residual of lower eGFRCr.) associates with obesity, albuminuria, hypertension, diabetes, lower HDL cholesterol, higher triglycerides, and higher uric acid. Bias from residual confounding with mGFR explains this discrepancy.
The non-GFR determinants of eGFRCysC cannot currently be directly measured (cystatin C is catabolized by proximal tubules).16 Prior studies have suggested the non-GFR determinants of cystatin C correlate with inflammation and obesity.4, 17 Cystatin C appears to be the most abundant endogenous inhibitor of cathepsins, a family of proteases involved in atherogenesis and immunomodulations.18, 19 Using model 1, the residual non-GFR determinants of eGFRCysC were correlated with CKD risk factors that reflect inflammation, obesity, and atherosclerosis. In particular, the non-GFR determinant of lower eGFRCysC (possibly higher cystatin C generation) associated with obesity, albuminuria, hypertension, diabetes, lower HDL cholesterol, higher triglycerides, higher C-reactive protein, and higher uric acid. In multivariable analysis, three of these risk factors (obesity, hypertension, and higher C-reactive protein) were independently correlated with the non-GFR determinants of cystatin C. The comparative results with model 2 does support the notion that these residual associations can be inflated in an analysis that does not account for imprecision of mGFR. The risk factor associations with the non-GFR determinants of eGFRCr-CysC were intermediate to those with eGFRCr and with eGFRCysC. This is expected as eGFRCr-CysC is simply an average between eGFRCr and eGFRCysC.15
Other studies have found evidence that cystatin C and eGFRCysC are substantially biased in representing associations with GFR. In a non-diabetic, non-CKD general community sample, Framingham risk scores did not increase with lower mGFR or lower eGFRCr, but did increase with lower eGFRCysC.4 Many investigations have also shown that hyperfiltration determined by mGFR20–22 or eGFRCr 23–25 is a high risk state, where as hyperfiltration determined by cystatin C is a low risk state.24–26
There are several strengths to this study. Two different community based populations not selected on GFR were used for the analyses. Compared to prior studies in the literature, our statistical analysis determined differences in associations with eGFR and mGFR without bias from residual confounding. Duplicate study visits allowed us to determine and compare the test-retest reliability between mGFR and eGFR. There are also several weaknesses to this study. GFR was not measured over multiple study visits to optimally relate CKD risk factors to subsequent changes in GFR. However, for a study objective of characterizing the non-GFR determinant of eGFR, a cross-sectional design may be preferable. Further work is still needed to understand how the non-GFR determinants of eGFR relate to outcomes in the general community. We did not detect statistically significant differences in the reliability of eGFR compared to mGFR and this may have been due to the small sample size. Even if there are true differences, Model 1 (generalized estimating equations) minimized the impact of error for both eGFR and mGFR in their association with risk factors. Not all known risk factors for CKD were assessed. Finally, the study population was white and findings may differ in other ethnic groups.
In conclusion, recent studies have focused primarily on associations with eGFRCysC, arguing that eGFRCr is an inferior method to determine GFR.27–29 However, we found several reasons to argue that association studies with eGFRCr better reflect associations with true GFR than association studies with eGFRCysC. First, the non-GFR determinants of eGFRCr were less correlated with commonly recognized CKD risk factors than eGFRCysC. Thus, associations with eGFRCr would be expected to be less biased than associations with eGFRCysC. Second, the generation rate of creatinine (24-h urine creatinine) is a non-GFR determinant of eGFRCr that could potentially confound associations with eGFRCr. But unlike the generation rate of cystatin C, the generation rate of creatinine can be measured and adjusted for in analyses. Third, the test-retest reliability of eGFRCr is better than the test-retest reliability of eGFRCysC. Nonetheless, studies have shown that eGFRCysC clearly improves risk stratification for mortality and kidney failure beyond eGFRCr alone.1, 2 The problem with eGFRCysC is the interpretation of cystatin C as GFR. Instead, cystatin C could be interpreted as a better marker for risk stratification and management of CKD than GFR.
Materials and Methods
Study Sample
Subjects were recruited from two white community-based cohorts. The GENOA cohort enrolled 1583 members of sibships containing at least two subjects with primary hypertension seen in Olmsted County and diagnosed before age 60 years for a baseline visit in 1996 to 2000.30 The ECAC cohort enrolled 1241 parents and grandparents of children identified from the computerized enrollment records of the Rochester, MN public and parochial schools in 1984.31 For the baseline visit, the GENOA cohort excluded persons with secondary hypertension and the ECAC cohort excluded persons with evident cardiovascular disease (myocardial infarction or revascularization). These exclusions were not used in subsequent visits. The GENOA and ECAC cohort participants underwent a second study visit between 2001 and 2005 and a third study visit between 2006 and 2011. This present analysis used exam and survey-based CKD risk factors ascertained during the second study visit and laboratory-based CKD risk factors and GFR measurements ascertained during the 3rd study visit. Half-way through the third study visit, 22 consecutive participants in the GENOA cohort returned for a duplicate visit to repeat the same GFR measurements. Since the GENOA and ECAC cohorts were both sampled from the same community (Olmsted County), 18 subjects who were in both cohorts and participated twice, once for the GENOA cohort study visit and once for the ECAC cohort study visit. Identical protocols at the same location over the same time period were used for both cohorts.
Measured GFR by Iothalamate clearance
As previously described,32 GFR was measured from the clearance of non-radiolabeled iothalamate assayed with capillary electrophoresis from timed plasma and urine samples. Participants were fasted overnight for at least 6 hours prior to the study visit except for being encouraged to drink water prior to and throughout the iothalamate clearance test. Since a bladder post-void residual (PVR) is common in older populations33 and may bias GFR measurement, PVR was monitored throughout the test. If the PVR was greater than 100 ml and the participant consented to the procedure, an indwelling bladder catheter was placed. Subjects received a subcutaneous injection of 300 mg of non-radiolabeled iothalamate followed by a 45 minute equilibrium phase to allow systemic absorption. At the end of the equilibrium phase, the patient voided, a sonographic PVR1 was measured, and the first plasma sample to assay iothalamate was drawn (P1). After a timed 45 minute equilibrium phase (T), the patient voided again to assay iothalamate (U2), the voided volume (V) was recorded, sonographic PVR2 was measured, and a second plasma sample to assay iothalamate was drawn (P2). Subjects who could not void after a 45 minute clearance phase were allowed up to an additional 30 minutes to void. An invalid iothalamate clearance was defined a priori as meeting any of the following criteria: 1) Deviation from the clearance protocol, 2) PVR1 or PVR2 greater than the voided volume (V), 3) A voided volume less than 100 ml, or 4) iothalamate levels not detectable on either the urine or plasma samples. For valid studies, GFR was calculated:
Estimation of GFR by different methods
The day prior to the iothalamate clearance, study participants collected their urine for 24 hours. Serum samples were obtained at the start of the iothalamate clearance. Creatinine was assayed using a standardized enzymatic assay (Creatinine plus, Roche diagnostics, Indianapolis, IN) in both serum and urine samples. Urinary creatinine clearance was calculated from the urine and serum creatinine levels, the collected urine volume, and subject-reported timing of the collection. eGFR was calculated using the three CKD-EPI equations: eGFRCr, eGFRCysC, and eGFRCr-CysC.3 Cystatin C was assayed using the N Latex cystatin C kit (Dade Behring, now Siemens) on the Dade-Behring Nephelometer. Regression of cystatin C levels on time showed no assay drift during the study period. Cystatin C levels were adjusted by multiplying levels by 1.14 as reported by other investigators to obtain standardized levels with this assay.34, 35 The association between CKD risk factors and eGFRCysC did not change substantively with or without this adjustment to cystatin C.
CKD Risk factors
Urine albumin excretion was assessed using the urine albumin to creatinine ratio (UACR) from 24-h urine samples. For this study, UACR was considered a CKD risk factor. We also evaluated 24-h urine albumin (mg) and 24-h urine creatinine (mg) as CKD risk factors. Serum was assayed for HDL cholesterol, triglycerides, and uric acid levels after an overnight fast. BMI was calculated from measured height and weight at the study visit. Hypertension was defined as a systolic blood pressure >140 mmHg or a diastolic blood pressure >90 mmHg or use of anti-hypertensive medications. Diabetes was defined as use of diabetic medications or a fasting glucose ≥126 mg/dl. Active cigarette smoker was self-reported on the survey.
Statistical analysis
mGFR and urinary creatinine clearance were converted from ml/min to ml/min/1.73 m2 by multiplying by 1.73 and dividing by body surface area (Dubois formula).36 The correlation of eGFR by each method with mGFR was assessed and graphically plotted. The CV for each GFR method was assessed using the 40 subjects with duplicate study visits. Both eGFR and mGFR were log-transformed (eGFR equations were derived to relate linearly to mGFR on a log-log scale), and CKD risk factors were, therefore, studied in relation to percentage changes in GFR. Two different statistical models were used to assess the associations between CKD risk factors and eGFR after accounting for mGFR (See Online Statistical Appendix for details):
Model 1
A multivariate approach with generalized estimating equations was used to regress both mGFR and eGFR simultaneously on each risk factor, by “stacking” the GFR methods (mGFR, eGFRCr, and eGFRCysC) or (mGFR and eGFRCr-CysC) as multiple observations for each patient with method type as a stratum variable. The test for interaction between eGFR (mGFR as reference method) and each risk factor and was used to detect a statistically significant deviation of the risk factor association with eGFR compared to mGFR. This interaction reflects the difference in the regression coefficients for eGFR with the risk factor versus mGFR with the risk factor.
Model 2
Using standard linear regression, eGFR by each method was regressed on each risk factor with adjustment for mGFR as a covariate.
Multivariable analysis based on Model 1 (multiple risk factor interactions with eGFR versus mGFR) was used to identify independent risk factors for the non-GFR determinants of eGFR. Only risk factors that alone had statistically significant interactions with eGFR (compared to mGFR) were included in these multivariable models.
Sensitivity Analysis
Association analyses with eGFRCr and eGFRCysC were repeated using the MDRD study equation and an alternative cystatin C equation (eGFRCysC = 67×CysC−1.3).9, 37 Additional analyses added urinary creatinine clearance as an additional method type in the generalized estimating equations used for Model 1. Finally, analyses were repeated in the GENOA cohort and ECAC cohort separately.
Acknowledgments
The authors appreciate the help by Daniel Crusan with programming the statistical analyses.
Funding/Support: This project was supported by research grants from the National Institute of Diabetes and Digestive and Kidney Diseases (NIDDK) (DK078229 and DK073537) and made possible by the Rochester Epidemiology Project (AG034676) from the National Institutes of Health, U.S. Public Health Service.
Footnotes
Disclosure: All the authors declared no competing interests
Contributor Information
Andrew D. Rule, Division of Nephrology and Hypertension and Division of Epidemiology, Mayo Clinic
Kent R. Bailey, Division of Biostatistics and Informatics, Mayo Clinic
John C. Lieske, Division of Nephrology and Hypertension, and Department of Laboratory Medicine and Pathology, Department of Physiology Mayo Clinic
Patricia A. Peyser, Department of Epidemiology, University of Michigan, Ann Arbor, Michigan
Stephen T. Turner, Division of Nephrology and Hypertension, Mayo Clinic
References
- 1.Peralta CA, Katz R, Sarnak MJ, et al. Cystatin C identifies chronic kidney disease patients at higher risk for complications. J Am Soc Nephrol. 2011;22:147–155. doi: 10.1681/ASN.2010050483. [DOI] [PMC free article] [PubMed] [Google Scholar]
- 2.Peralta CA, Shlipak MG, Judd S, et al. Detection of chronic kidney disease with creatinine, cystatin C, and urine albumin-to-creatinine ratio and association with progression to end-stage renal disease and mortality. Jama. 2011;305:1545–1552. doi: 10.1001/jama.2011.468. [DOI] [PMC free article] [PubMed] [Google Scholar]
- 3.Inker LA, Schmid CH, Tighiouart H, et al. Estimating glomerular filtration rate from serum creatinine and cystatin C. N Engl J Med. 2012;367:20–29. doi: 10.1056/NEJMoa1114248. [DOI] [PMC free article] [PubMed] [Google Scholar]
- 4.Mathisen UD, Melsom T, Ingebretsen OC, et al. Estimated GFR associates with cardiovascular risk factors independently of measured GFR. J Am Soc Nephrol. 2011;22:927–937. doi: 10.1681/ASN.2010050479. [DOI] [PMC free article] [PubMed] [Google Scholar]
- 5.Menon V, Shlipak MG, Wang X, et al. Cystatin C as a risk factor for outcomes in chronic kidney disease. Annals of Internal Medicine. 2007;147:19–27. doi: 10.7326/0003-4819-147-1-200707030-00004. [DOI] [PubMed] [Google Scholar]
- 6.Tangri N, Inker LA, Tighiouart H, et al. Filtration Markers May Have Prognostic Value Independent of Glomerular Filtration Rate. J Am Soc Nephrol. 2012 doi: 10.1681/ASN.2011070663. [DOI] [PMC free article] [PubMed] [Google Scholar]
- 7.Bhavsar NA, Appel LJ, Kusek JW, et al. Comparison of measured GFR, serum creatinine, cystatin C, and beta-trace protein to predict ESRD in African Americans with hypertensive CKD. Am J Kidney Dis. 2011;58:886–893. doi: 10.1053/j.ajkd.2011.07.018. [DOI] [PMC free article] [PubMed] [Google Scholar]
- 8.Hsu CY, Propert K, Xie D, et al. Measured GFR Does Not Outperform Estimated GFR in Predicting CKD-related Complications. J Am Soc Nephrol. 2011;22:1931–1937. doi: 10.1681/ASN.2010101077. [DOI] [PMC free article] [PubMed] [Google Scholar]
- 9.Rule AD, Bergstralh EJ, Slezak JM, et al. Glomerular filtration rate estimated by cystatin C among different clinical presentations. Kidney Int. 2006;69:399–405. doi: 10.1038/sj.ki.5000073. [DOI] [PubMed] [Google Scholar]
- 10.Lewis J, Greene T, Appel L, et al. A comparison of iothalamate-GFR and serum creatinine-based outcomes: acceleration in the rate of GFR decline in the African American Study of Kidney Disease and Hypertension. Journal of the American Society of Nephrology. 2004;15:3175–3183. doi: 10.1097/01.ASN.0000146688.74084.A3. [DOI] [PubMed] [Google Scholar]
- 11.Keevil BG, Kilpatrick ES, Nichols SP, et al. Biological variation of cystatin C: implications for the assessment of glomerular filtration rate. Clin Chem. 1998;44:1535–1539. [PubMed] [Google Scholar]
- 12.Rule AD, Bailey KR, Schwartz GL, et al. For estimating creatinine clearance measuring muscle mass gives better results than those based on demographics. Kidney Int. 2009 doi: 10.1038/ki.2008.698. [DOI] [PMC free article] [PubMed] [Google Scholar]
- 13.Murata K, Baumann NA, Saenger AK, et al. Relative Performance of the MDRD and CKD-EPI Equations for Estimating Glomerular Filtration Rate among Patients with Varied Clinical Presentations. Clin J Am Soc Nephrol. 2011;6:1963–1972. doi: 10.2215/CJN.02300311. [DOI] [PMC free article] [PubMed] [Google Scholar]
- 14.Rule AD, Larson TS, Bergstralh EJ, et al. Using Serum Creatinine To Estimate Glomerular FIltration Rate: Accuracy in Good Health and in Chronic Kidney Disease. Annals of Internal Medicine. 2004;141:929–937. doi: 10.7326/0003-4819-141-12-200412210-00009. [DOI] [PubMed] [Google Scholar]
- 15.Earley A, Miskulin D, Lamb EJ, et al. Estimating equations for glomerular filtration rate in the era of creatinine standardization: a systematic review. Annals of Internal Medicine. 2012;156:785–795. W-270, W-271, W-272, W-273, W-274, W-275, W-276, W-277, W-278. doi: 10.7326/0003-4819-156-11-201203200-00391. [DOI] [PubMed] [Google Scholar]
- 16.Jacobsson B, Lignelid H, Bergerheim US. Transthyretin and cystatin C are catabolized in proximal tubular epithelial cells and the proteins are not useful as markers for renal cell carcinomas. Histopathology. 1995;26:559–564. doi: 10.1111/j.1365-2559.1995.tb00275.x. [DOI] [PubMed] [Google Scholar]
- 17.Knight EL, Verhave JC, Spiegelman D, et al. Factors influencing serum cystatin C levels other than renal function and the impact on renal function measurement. Kidney Int. 2004;65:1416–1421. doi: 10.1111/j.1523-1755.2004.00517.x. [DOI] [PubMed] [Google Scholar]
- 18.Lafarge JC, Naour N, Clement K, et al. Cathepsins and cystatin C in atherosclerosis and obesity. Biochimie. 2010;92:1580–1586. doi: 10.1016/j.biochi.2010.04.011. [DOI] [PubMed] [Google Scholar]
- 19.Staun-Ram E, Miller A. Cathepsins (S and B) and their inhibitor Cystatin C in immune cells: modulation by interferon-beta and role played in cell migration. Journal of neuroimmunology. 2011;232:200–206. doi: 10.1016/j.jneuroim.2010.10.015. [DOI] [PubMed] [Google Scholar]
- 20.Melsom T, Mathisen UD, Ingebretsen OC, et al. Impaired fasting glucose is associated with renal hyperfiltration in the general population. Diabetes Care. 2011;34:1546–1551. doi: 10.2337/dc11-0235. [DOI] [PMC free article] [PubMed] [Google Scholar]
- 21.Wuerzner G, Pruijm M, Maillard M, et al. Marked association between obesity and glomerular hyperfiltration: a cross-sectional study in an African population. Am J Kidney Dis. 2010;56:303–312. doi: 10.1053/j.ajkd.2010.03.017. [DOI] [PubMed] [Google Scholar]
- 22.Palatini P. Moderate or vigorous exercise? Which best helps prolong life? J Cardiovasc Med (Hagerstown) 2006;7:721–725. doi: 10.2459/01.JCM.0000247317.19418.17. [DOI] [PubMed] [Google Scholar]
- 23.Tonelli M, Klarenbach SW, Lloyd AM, et al. Higher estimated glomerular filtration rates may be associated with increased risk of adverse outcomes, especially with concomitant proteinuria. Kidney international. 2011;80:1306–1314. doi: 10.1038/ki.2011.280. [DOI] [PubMed] [Google Scholar]
- 24.Shlipak MG, Sarnak MJ, Katz R, et al. Cystatin C and the risk of death and cardiovascular events among elderly persons. N Engl J Med. 2005;352:2049–2060. doi: 10.1056/NEJMoa043161. [DOI] [PubMed] [Google Scholar]
- 25.Sarnak MJ, Katz R, Stehman-Breen CO, et al. Cystatin C concentration as a risk factor for heart failure in older adults.[see comment][summary for patients in Ann Intern Med. 2005 Apr 5;142(7):I53; PMID: 15809456] Annals of Internal Medicine. 2005;142:497–505. doi: 10.7326/0003-4819-142-7-200504050-00008. [DOI] [PubMed] [Google Scholar]
- 26.Wu CK, Lin JW, Caffrey JL, et al. Cystatin C and long-term mortality among subjects with normal creatinine-based estimated glomerular filtration rates: NHANES III (Third National Health and Nutrition Examination Survey) J Am Coll Cardiol. 2010;56:1930–1936. doi: 10.1016/j.jacc.2010.04.069. [DOI] [PubMed] [Google Scholar]
- 27.Park M, Hsu CY, Li Y, et al. Associations between Kidney Function and Subclinical Cardiac Abnormalities in CKD. J Am Soc Nephrol. 2012;23:1725–1734. doi: 10.1681/ASN.2012020145. [DOI] [PMC free article] [PubMed] [Google Scholar]
- 28.Hiramoto JS, Katz R, Peralta CA, et al. Inflammation and coagulation markers and kidney function decline: the Multi-Ethnic Study of Atherosclerosis (MESA) Am J Kidney Dis. 2012;60:225–232. doi: 10.1053/j.ajkd.2012.02.335. [DOI] [PMC free article] [PubMed] [Google Scholar]
- 29.Welles CC, Schafer AL, Vittinghoff E, et al. Urine Calcium Excretion, Cardiovascular Events, and Mortality in Outpatients With Stable Coronary Artery Disease (from the Heart and Soul Study) The American journal of cardiology. 2012 doi: 10.1016/j.amjcard.2012.08.007. [DOI] [PMC free article] [PubMed] [Google Scholar]
- 30.Peyser PA, Bielak LF, Chu JS, et al. Heritability of coronary artery calcium quantity measured by electron beam computed tomography in asymptomatic adults. Circulation. 2002;106:304–308. doi: 10.1161/01.cir.0000022664.21832.5d. [DOI] [PubMed] [Google Scholar]
- 31.Maher JE, Raz JA, Bielak LF, et al. Potential of quantity of coronary artery calcification to identify new risk factors for asymptomatic atherosclerosis. Am J Epidemiol. 1996;144:943–953. doi: 10.1093/oxfordjournals.aje.a008864. [DOI] [PubMed] [Google Scholar]
- 32.Wilson DM, Bergert JH, Larson TS, et al. GFR determined by nonradiolabeled iothalamate using capillary electrophoresis. Am J Kidney Dis. 1997;30:646–652. doi: 10.1016/s0272-6386(97)90488-1. [DOI] [PubMed] [Google Scholar]
- 33.Rule AD, Jacobson DJ, McGree ME, et al. Longitudinal changes in post-void residual and voided volume among community dwelling men. Journal of Urology. 2005;174:1317–1321. doi: 10.1097/01.ju.0000173922.29275.54. discussion 1321–1312; author reply 1322. [DOI] [PubMed] [Google Scholar]
- 34.Larsson A, Hansson LO, Flodin M, et al. Calibration of the Siemens cystatin C immunoassay has changed over time. Clin Chem. 2011;57:777–778. doi: 10.1373/clinchem.2010.159848. [DOI] [PubMed] [Google Scholar]
- 35.Inker LA, Eckfeldt J, Levey AS, et al. Expressing the CKD-EPI (Chronic Kidney Disease Epidemiology Collaboration) cystatin C equations for estimating GFR with standardized serum cystatin C values. Am J Kidney Dis. 2011;58:682–684. doi: 10.1053/j.ajkd.2011.05.019. [DOI] [PMC free article] [PubMed] [Google Scholar]
- 36.DuBois D, DuBois E. A formula to estimate the approximate surface area if height and weight be known. Arch Intern Med. 1916;17:863–871. [Google Scholar]
- 37.Levey AS, Coresh J, Greene T, et al. Expressing the Modification of Diet in Renal Disease Study equation for estimating glomerular filtration rate with standardized serum creatinine values. Clinical chemistry. 2007;53:766–772. doi: 10.1373/clinchem.2006.077180. [DOI] [PubMed] [Google Scholar]


