

Abstract
Lay Abstract
Attention allows us to selectively process the vast amount of information with which we are confronted. Focusing on a certain location of the visual scene (visual spatial attention) enables the prioritization of some aspects of information while ignoring others. Rapid manipulation of the attention field (i.e., the location and spread of visual spatial attention) is a critical aspect of human cognition, and previous research on spatial attention in individuals with autism spectrum disorders (ASD) has produced inconsistent results. In a series of three experiments, we evaluated claims in the literature that individuals with ASD exhibit a deficit in voluntarily controlling the deployment and size of the spatial attention field. We measured how well participants perform a visual discrimination task (accuracy) and how quickly they do so (reaction time), with and without spatial uncertainty (i.e., the lack of predictability concerning the spatial position of the upcoming stimulus). We found that high–functioning adults with autism exhibited slower reactions times overall with spatial uncertainty, but the effects of attention on performance accuracies and reaction times were indistinguishable between individuals with autism and typically developing individuals, in all three experiments. These results provide evidence of intact endogenous spatial attention function in high–functioning adults with ASD, suggesting that atypical endogenous spatial attention cannot be a latent characteristic of autism in general.
Scientific Abstract
Rapid manipulation of the attention field (i.e., the location and spread of visual spatial attention) is a critical aspect of human cognition, and previous research on spatial attention in individuals with autism spectrum disorders (ASD) has produced inconsistent results. In a series of three psychophysical experiments, we evaluated claims in the literature that individuals with ASD exhibit a deficit in voluntarily controlling the deployment and size of the spatial attention field. We measured the spatial distribution of performance accuracies and reaction times to quantify the sizes and locations of the attention field, with and without spatial uncertainty (i.e., the lack of predictability concerning the spatial position of the upcoming stimulus). We found that high–functioning adults with autism exhibited slower reactions times overall with spatial uncertainty, but the effects of attention on performance accuracies and reaction times were indistinguishable between individuals with autism and typically developing individuals, in all three experiments. These results provide evidence of intact endogenous spatial attention function in high–functioning adults with ASD, suggesting that atypical endogenous attention cannot be a latent characteristic of autism in general.
Keywords: Attention, spatial attention, endogenous attention, psychophysics, adults, autism, autism spectrum disorders, ASD
Introduction
Attention allows us to selectively process the vast amount of information with which we are confronted. By focusing on a certain location or aspect of the visual scene, visual attention enables the prioritization of some aspects of information while ignoring others. It has been known since the dawn of experimental psychology that covert attention, the selective processing of visual information in the absence of eye movements, plays a central role in perception (James, 1890). Over the past 30 years, rigorous methods have been developed for manipulating, measuring, and characterizing covert spatial attention (e.g., Sperling and Melchner, 1978; Posner et al., 1980; Braun, 1998; Carrasco et al., 2000; Lu and Dosher, 2000; Carrasco and McElree, 2001; Verghese, 2001; Cavanagh and Alvarez, 2005; Carrasco, 2006; Ling and Carrasco, 2006a; Li et al., 2008; Pestilli et al., 2011). Of particular relevance to the current study are the methods that have been developed for characterizing the accuracy and speed with which individuals deploy the attention field, i.e., the location and spread of visual spatial attention (e.g., Eriksen and St James, 1986; Muller et al., 2003; Belopolsky et al., 2007; Herrmann et al., 2010).
Previous research on spatial attention in individuals with autism spectrum disorders (ASD) has produced inconsistent results. Some studies have shown attentional deficits in individuals with ASD, purportedly linked to an inability to adequately control the attention field (Wainwright-Sharp and Bryson, 1993; Burack, 1994; Townsend and Courchesne, 1994; Townsend et al., 1996; Wainwright and Bryson, 1996; Harris et al., 1999; Townsend et al., 1999; Mann and Walker, 2003; Landry and Bryson, 2004), whereas others have provided evidence for intact functioning (Senju et al., 2004; Renner et al., 2006; Remington et al., 2009). Many different methods have been used to study attention in ASD (for a review see Ames and Fletcher-Watson, 2010), and this diversity in approach may have contributed to the inconsistent findings. The primary aim of the research described here was to apply the full force of the attention researcher’s methodological toolkit to the question of attention field control in ASD.
There are two types of covert spatial attention, exogenous and endogenous (Posner et al., 1980; Yantis and Jonides, 1984; Nakayama and Mackeben, 1989; Lu and Dosher, 2000; Liu et al., 2005; Pestilli and Carrasco, 2005; Ling and Carrasco, 2006a, b; Giordano et al., 2009; Pestilli et al., 2009). Exogenous attention, engaged in response to the sudden onset of salient stimuli in the periphery, is involuntary, stimulus-driven, and has a transient effect, which peaks at about 100 ms post cue onset and decays shortly thereafter. In contrast, endogenous attention is voluntary, goal-driven (e.g., according to instructions), and has a sustained effect, which takes about 300 ms to be deployed and can be maintained for many seconds. Exogenous and endogenous attention can be manipulated experimentally using a cue. In both cases, participants perform a visual discrimination task at one of two or more possible target locations. For endogenous attention, a symbolic cue is presented (e.g., a bar in the center of the display pointing to one location) instructing participants to attend voluntarily to one of the possible locations before the target appears. Endogenous attention always benefits performance, even in tasks in which exogenous attention hampers performance (e.g., Yeshurun et al., 2008). This paper will focus on endogenous attention, but we highlight both to emphasize that these are distinct attentional systems, that are differentially engaged, and that have different temporal dynamics (for a review see Carrasco, 2011).
In a series of three experiments, we tested the hypothesis that individuals with ASD exhibit a deficit in controlling the deployment and size of the endogenous attention field. We measured the effect of attention on both performance accuracy and reaction times, with and without spatial uncertainty (i.e., the lack of predictability concerning the spatial position of the upcoming stimulus). For typically developing individuals, spatial uncertainty increases the size of the attention field (Herrmann et al., 2010). Here we adopted a spatial uncertainty manipulation to evaluate whether or not this is also the case for individuals with autism. We measured the spatial distribution of performance accuracies and reaction times to quantify the sizes and locations of the attention field, with and without spatial uncertainty. We found that individuals with autism exhibited slower reactions times overall with spatial uncertainty, but the effects of attention on performance accuracies and reaction times (contingent on the attention cue) were indistinguishable between individuals with autism and typically developing individuals.
Materials and Methods
Observers and psychophysical sessions
Eight high-functioning adult individuals with autism, one high-functioning adult with an ASD diagnosis (20–40 years, 2 female) and 9 typically developing control individuals (20–36 years, 2 female) participated in all three endogenous attention experiments (see Table 1). Despite the inclusion of one individual with an ASD rather than an autism diagnosis, we have referred to the clinical group throughout as the “autism group “ due to its overall diagnostic composition. All participants were all recruited from the Autism Database maintained by the Center for Excellence in Autism Research (CeFAR) at the University of Pittsburgh, and all procedures were approved by the IRB at both The University of Pittsburgh and Carnegie Mellon University. Each control participant was matched as closely as possible by IQ, Wechsler abbreviated scale of intelligence (The Psychological Corporation,1999), gender, age, and education level to each individual with autism (see Table 2); there no statistically significant group differences for full score IQ, verbal IQ, or age (p–values > 0.2, t–tests). All participants had normal or corrected to normal vision, and none of the participants had been diagnosed with ADHD. Six of the participants in the autism group were not on any form of medication. Two participants were on medication to control allergies or asthma and 5 others were on more complex regimens. Given the absence of a group difference and the variation in medication across these participants, it seems improbable that the medication regimen played a significant role in the findings.
TABLE 1.
Summary of experiments
| Exp | Trials per participant | Cue-stimulus onset asynchrony | Spatial uncertainty | Increasing attentional demands |
|---|---|---|---|---|
| 1 | 208 | Long (900–ms) | Low: 1 target location per quadrant | ↓ |
| 2 | 208 | Short (300–ms) | Low: 1 target location per quadrant | |
| 3 | 960 | Short (300–ms) | High: 5 target locations per quadrant |
Table 2.
Demographic and diagnostic information.
| Control group | Autism group | Autism group: ADOS | Autism group: AD I | ||||||||||||||
|---|---|---|---|---|---|---|---|---|---|---|---|---|---|---|---|---|---|
|
| |||||||||||||||||
| Age | Gender | Verbal | Full score IQ | Age | Gender | Verbal | Full score IQ | Version | COM | SOC | COM SOC | STB | Version | SOC | COM Verbal | STB | |
| 1 | 25 | M | 120 | 126 | 25 | M | 131 | 134 | 4 | 5 | 13 | 18 | 3 | 2003 | 20 | 13 | 3 |
| 2 | 23 | M | 116 | 127 | 23 | M | 121 | 127 | 4 | 5 | 6 | 11 | 6 | 1999 | 19 | 11 | 4 |
| 3 | 22 | M | 114 | 119 | 22 | M | 112 | 123 | 4 | 4 | 8 | 12 | 2 | 2000 | 21 | 17 | 6 |
| 4 | 22 | M | 116 | 115 | 22 | M | 120 | 123 | 4 | 4 | 6 | 10 | 1 | 2003 | 21 | 18 | 5 |
| 5 | 28 | F | 109 | 116 | 32 | F | 132 | 121 | 4 | 6 | 10 | 16 | 3 | 2003 | 15 | 9 | 6 |
| 6 | 36 | M | 114 | 118 | 40 | M | 121 | 129 | 4 | 6 | 6 | 12 | 1 | 1990 | 32 | 22 | 10 |
| 7 | 25 | F | 127 | 127 | 32 | F | 119 | 123 | 4 | 2 | 7 | 9 | 4 | 2003 | 10 | 8 | 6 |
| 8 | 27 | M | 113 | 109 | 30 | M | 114 | 117 | 4 | 4 | 7 | 11 | 2 | 2003 | 25 | 9 | 8 |
| 9 | 20 | M | 119 | 116 | 20 | M | 106 | 107 | 4 | 5 | 11 | 16 | 3 | 2003 | 20 | 15 | 3 |
|
| |||||||||||||||||
| mean | 25.33 | 7M/2F | 11644 | 119.22 | 27.33 | 7M/2F | 119.56 | 122.67 | |||||||||
| St. dev. | 4.74 | 5.13 | 624 | 6.58 | 8.38 | 7.65 | |||||||||||
ADOS, autism diagnostic observation schedule; COM, communication; SOC, social interaction; COM SOC, communication + social interaction; STB, stereotyped behaviors; ADI, autism diagnostic interview.
Experiments 1 and 2 were completed during one testing session (208 trials each experiment, Table 1), separated by a short break, and Experiment 3 was completed during a separate testing session (960 trials, Table 1) on a different day. Session order was counter-balanced across participants, as was the within-session order of Experiments 1 and 2. Participants completed 4 practice blocks (20 trials each) before each experiment. In addition, orientation discrimination thresholds were measured in pre-tests (neutral trials only), separately for each participant, and separately for each experiment (see below). All experiments were completed in a quiet and private testing room, free from distraction.
Psychophysical task
Participants performed the same psychophysical task in all three experiments (Figure 1). On each trial, 4 grating patches (4 cycles per degree) were presented (for 80 ms) simultaneously in each of the four visual quadrants: 1.5° in diameter (σ = .21°, s.d. of Gaussian window), centered at 8° eccentricity, 4 cycles per degree, 30% contrast, and with the same mean luminance as the uniform grey background. Each grating was tilted slightly with respect to vertical. The direction of tilt, clockwise or counterclockwise, was randomized on each trial, independently for each of the 4 gratings. A post-stimulus response cue (0.8° white line) indicated which of the 4 gratings was the target. Participants performed an orientation discrimination task, indicating whether the target was titled clockwise or counterclockwise of vertical. Auditory feedback (different tones for correct and incorrect) was provided after each response. Placeholders (brackets) were displayed for the duration of the experiment to demarcate the locations of the grating patches in each quadrant. Participants performed each task on the same computer, seated 57–cm away from a DELL M992 monitor (resolution: 1024 × 768; refresh rate: 85 Hz).
Figure 1. Experimental protocol.

ISI, inter–stimulus interval; ITI, inter–trial interval.
Orientation discrimination thresholds
The amount of tilt in the orientation discrimination task was determined in pre-tests to equate task difficulty, separately for each participant, and separately for each experiment. A staircase procedure (120 trials, neutral cues only) was used to determine the degree of tilt necessary for a performance accuracy of ~80% correct.
Endogenous attention manipulation
A symbolic pre-cue (250 ms) was used to manipulate endogenous spatial attention (Figure 1). There were two different trial types with two different pre-cues: valid (1 white line, 0.8°, at fixation, pointing to 1 of the 4 locations) and neutral (4 small white lines, 0.2°, pointing to all 4 locations). For valid trials, the pre-cue indicated the quadrant in which the target would appear. For neutral trials, the target could appear in any quadrant. A random half of the trials had valid cues; the other half had neutral cues. The pre-cue was followed by an inter–stimulus interval (ISI), chosen to minimize or maximize the temporal difficulty in allocating endogenous attention. In Experiment 1, the ISI was 650 ms, resulting in a 900 ms cue–stimulus onset asynchrony (SOA). Experiments 2 and 3 had a 50 ms ISI, resulting in a 300 ms SOA.
Spatial uncertainty manipulation
The size of the box formed by the placeholders was used to minimize or maximize spatial uncertainty (Figure 1). In Experiments 1 and 2 (low spatial uncertainty), the spatial area demarcated by the placeholders was 2° × 2°, and each grating always appeared in the center of each box (i.e., centered in each of the 4 quadrants). In Experiment 3 (high spatial uncertainty), the spatial extent of the box was 5.56° × 5.56°, and the gratings could appear at one of five predefined isoeccentric locations, each separated by 8 angular degrees; the middle of these five possible locations was centered in the middle of the box.
Accuracy
The proportion of correct responses was computed separately for each participant, each attention condition in each experiment, and each target location (Experiment 3 only).
Reaction time
Reaction time distributions, for correct trials only, were computed separately for each participant, each attention condition in each experiment, and each target location (Experiment 3 only). The median reaction time was then determined for each distribution.
Eye tracking
Fixation was monitored throughout the experiment, using an infrared video eye tracker (Eyelink, SR Research, Ottawa, Ontario; 500 Hz sampling rate); a 9–point calibration routine was completed at the start of each experimental block. Trials in which a participant’s gaze deviated from fixation by more than 2° of visual angle, during the presentation of the grating stimuli, were ignored (i.e., data from those trials were not analyzed). The remaining trials were analyzed to determine if there were group differences in eye position within this 2° range. The mean eye–to–target distance was measured, averaged throughout the 80 ms epoch during which the grating stimuli were presented, separately for each trial, each participant, and each experiment.
Results
Experiments 1 and 2 found no evidence for differences in attention, between individuals with autism and typically developing individuals, using low spatial uncertainty with a long and short SOA, respectively (Figure 2, Table 3). Accuracy and reaction time measures were subjected, separately, to a two–way mixed–model ANOVA, with attention (valid, neutral) as a within–subjects variable, and group (autism, control) as a between–subjects variable, separately for each study. We found the same pattern of results in both experiments. 1) There was a main effect of attention, for accuracy as well as reaction time, indicating that participants were both more accurate and faster in valid trials compared to neutral trials. 2) There was no main effect of group for accuracy or reaction time, indicating that overall accuracy and speed did not differ between the groups. 3) There was no attention x group interaction for accuracy or reaction time, indicating that the improvements in performance with valid cues were indistinguishable between groups. These results suggest that under conditions of low spatial uncertainty, individuals with autism benefit from attention cues to the same extent as typically developing individuals do, even when the task requires rapid allocation of spatial attention.
Figure 2. Low spatial uncertainty.

Experiment 1, long SOA. Experiment 2, short SOA. (A) and (C) Accuracy in orientation discrimination task. White bars, valid trials. Grey bars, neutral trials. ***, significant main effect of attention (p<0.001). Error bars, SEM across participants. (B) and (D) Reaction time in orientation discrimination task. Same format as panel A.
Table 3.
Experiments 1, 2, and 3 statistics.
| Accuracy | Reaction time | ||||||
|---|---|---|---|---|---|---|---|
| Attention | Group | Attention x group interaction | Attention | Group | Attention x group interaction | ||
| Exp 1 | F(1,16) = 19.22, P < 0.001 | F(1,16) = 1.51 p = 0.24 | F(1,16) = 1.64, p = 0.22 | Exp 1 | F(1,16) = 91.44, p < 0.001 | F(1,16) = 0.97, p = 0.34 | F(1,16) = 0.06, p = 0.82 |
| Exp 2 | F(1,16) = 40.20, P < 0.001 | F(1,16) = 1.66, p = 0.22 | F(1,16) = 0.10, p = 0.75 | Exp 2 | F(1,16) = 149.93, P < 0.001 | F(1,16) = 3.11, p = 0.10 | F(1,16) = 0.66, p = 0.43 |
| Exp 3 | F(1,16) = 116.84, p< 0.001 | F(1,16) = 0.27, p = 0.61 | F(1,16) = 3.42, p = 0.08 | Exp 3 | F(1,16) = 203.24, p < 0.001 | F(1,16) = 4.66, p < 0.05 | F(1,16) = 0.153, p = 0.70 |
F–statistics and p–values for 2–way mixed– model ANOVAs of performance accuracy and reaction time measures, with attention (valid, neutral) as a within–subjects factor, and group (autism, control) as a between– subjects factor. Significant differences shaded in grey.
Experiment 3 found no differences in attention between groups, using a short SOA and high spatial uncertainty (Figure 3, Table 4). Accuracy and reaction time measures were subjected to a three–way mixed–model ANOVA, with target location (29°, 37°, 45°, 53°, 61° from the horizontal meridian) and attention (valid, neutral) as within–subjects variables, and group (autism, control) as a between–subjects variable. There was a main effect of attention, both for accuracy and reaction time, indicating that participants were both more accurate and faster in valid trials compared to neutral trials. Neither of the attention x group interactions were significant, indicating that the improvements in performance with valid cues were indistinguishable between groups. There was no main effect of group for accuracy, or reaction time (but see below for an ancillary analysis showing a difference in reaction times). Attention x location interactions were significant, both for accuracy and reaction time. However, the three-way, location x attention x group interaction was not significant for either accuracy or reaction time, indicating that improvements in performance with valid cues differed significantly across locations, but did so in a manner that was indistinguishable between the groups.
Figure 3. High spatial uncertainty.

Experiment 3, short SOA. (A) and (B) Accuracy in orientation discrimination task. (C) and (D) Reaction time in orientation discrimination task. (A) and (C) Autism group. (B) and (D) Typically developing control group. Horizontal axis in each panel, target location. Squares with solid line, neutral trials. Circles with dashed line, valid trials. Error bars, SEM across participants.
Table 4.
Experiment 3 statistics.
| Attention | Group | Location | Attention x group | Location x group | Attention x location | Attention x group x location | |
|---|---|---|---|---|---|---|---|
| Accuracy | F(1,16) = 113.1, p< 0.001 | F(1,16) = 0.28, p = 0.60 | F(1,16) = 1.64, p = 0.22 | F(1,16) = 3.14, p = 0.10 | F(4,64) = 2.12, p = 0.09 | F(4,64) = 5.27, p < 0.001 | F(4,64) = 0.57, p = 0.69 |
| Reaction time | F(1,16) = 187.8, p< 0.001 | F(1,16) = 4.22, p = 0. 06 | F(1.16) = 0.10. p = 0.75 | F(1.16) = 0.09, p = 0.77 | F(4,64) = 0.66, p = 0.62 | F(4,64) = 4.55, p < 0.005 | F(4,64) = 0.33, p = 0.86 |
F–statistics and p–values for 3–way mixed–model ANOVAs of performance accuracy and reaction time measures, with target location (29°, 37°, 45°, 53°, 61° from the horizontal meridian) and attention (valid, neutral) as within– subjects factors, and group (autism, control) as a between–subjects factor. Significant differences shaded in grey.
Data from Experiment 3 were reanalyzed, collapsing across locations, revealing that individuals with autism exhibited slower reactions times overall with spatial uncertainty, but again there were no differences in attention between groups (Figure 4, Table 3). We collapsed across locations because there were no location x group or attention x location x group interactions (see above). Accuracy and reaction time measures from were subjected to a two–way mixed–model ANOVA, with attention (valid, neutral) as a within–subjects variable, and group (autism, control) as a between–subjects variable. There was a main effect of attention, both for accuracy and reaction time, indicating that participants were both more accurate and faster in valid trials compared to neutral trials. There was no main effect of group for accuracy, indicating that both groups were equally accurate in the task. There was, however, a main effect of group in the reaction time analysis, i.e., individuals with autism had longer reaction times than typically developing individuals. Because the attention by group interaction was not significant, the main effect of group in the reaction time indicated that while the autism group was slower to respond, the attentional benefit from a valid cue was indistinguishable between groups. For accuracy, the attention by group interaction was also not significant, but exhibited a marginal trend (p = 0.08) indicating that the attentional benefit was a bit larger for the autism than for the control group.
Figure 4. High spatial uncertainty.
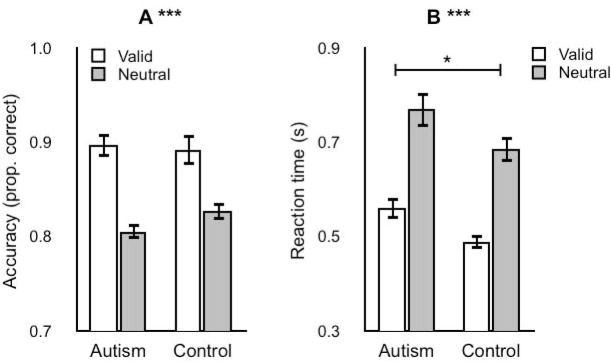
Experiment 3, short SOA, collapsed locations. Same format as Figure 2. *, significant main effect of group (p<0.05).
All participants in both the autism and control groups showed a consistent effect of attention on performance and reaction time (see Figure 5). The diagonal line in Figure 5 corresponds to no difference in performance for valid versus neutral cues. All individuals are to the right of this line in panel A, indicating an increase in accuracy with valid cues, or to the left in panel B, indicating a decrease in reaction time with valid cues.
Figure 5. Individual differences in Experiment 3 (short SOA, high spatial uncertainty).
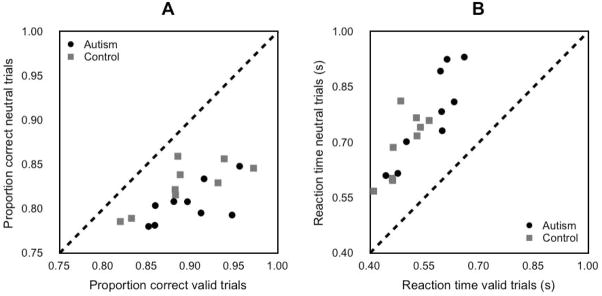
(A) Accuracy in orientation discrimination task. X–axis, valid trials. Y–axis, neutral trials. Black circles, autism group. Grey squares, control group. Dashed line, unity line. (B) Reaction time in orientation discrimination task. Same format as Panel A.
It is unlikely that differences in eye movements between groups could have confounded the interpretation of the performance accuracy and reaction time results. Fewer than 8% of trials were excluded in each of the experiments, due to breaks in fixation (Table 5). There was a significant between-group difference in the proportion of trials excluded due to breaks in fixation, only for Experiment 3; more trials were excluded for the autism group than for the control group. After excluding those trials, however, eye positions during the grating stimulus presentations were indistinguishable between groups, for all of the experiments. Eye–to–target distances were subjected to a two–way mixed–model ANOVA, with attention (valid, neutral) as a within–subjects variable, and group (autism, control) as a between–subjects variable, separately for each experiment (Table 6). There were no main effects of group, or interactions with group, in any of the experiments. There was, however, a significant main effect of attention in each experiment, indicating that all participants made small eye movements, resulting in shorter eye–to–target distances during valid compared to neutral trials. These changes in eye position were, however, negligible (~0.1° of visual angle).
Table 5.
Proportion of trials discarded for breaks in fixation. Mean proportion for each group (standard deviation).
| Group | Exp 1 | Exp 2 | Exp 3 |
|---|---|---|---|
| Autism | 0.064 (0.05) | 0.059 (0.02) | 0.078 (0.02) |
| Control | 0.069 (0.06) | 0.016(0.01) | 0.025 (0.01) |
| group difference p-value (t-test) | 0.84 | 0.06 | 0.02 |
Table 6.
Eye–to–target distance statistics.
| Attention | Group | Attention x group | |
|---|---|---|---|
| Exp 1 | F(1.16) = 9.98, p < 0.01 | F(1,16)= 0.12, p = 0.73 | F(1,16) = 0.06, p = 0.82 |
| Exp 2 | F(1,16) = 4.58, p < 0.05 | F(1,16) = 0.028, p = 0.87 | F(1,16)= 1.81, p = 0.20 |
| Exp 3 | F(1,16) = 13.85, p < 0.005 | F(1,16) = 0.08, p = 0.79 | F(1,16)= 1.84, p = 0.19 |
F statistics and p–values for 2–way mixed– model ANOVAs of eye–to–target distances, with attention (valid, neutral) as a with– subjects factor, and group (autism, control) as a between–subjects factor. Significant differences shaded in grey.
There was no evidence that a speed-accuracy tradeoff might have confounded the results. We computed an inverse efficiency measure (e.g., Kimchi and Peterson, 2008) of the accuracy and reaction time data (i.e., reaction time/accuracy), separately for each participant, and separately for each experiment. These inverse efficiency measures were subjected to two–way mixed–model ANOVAs, and for each experiment, the results were qualitatively similar to and support the same conclusions as the results reported above for reaction time. Additionally, we computed the correlation between accuracy and reaction time, separately for each attention condition, separately for each group, and separately for each experiment. A significant positive correlation would indicate that slower participants were more accurate and that faster participants were less accurate. None of these correlations were statistically significant, nor were they significantly different between the groups (p values > 0.1, non–parametric randomization tests).
Orientation discrimination thresholds were indistinguishable between the groups, for all 3 experiments (Table 7). The amount of tilt (from vertical) at which participants’ performed these tasks was determined in pre-tests, to equate task difficulty, separately for each participant, and separately for each experiment. If there had been large differences in the orientation thresholds between groups, then that might have hidden what otherwise would have been differences in performance accuracies and/or reaction times. But that was not the case.
Table 7.
Orientation discrimination thresholds. Mean tilt in angular degrees from vertical (standard deviation).
| Group | Exp 1 | Exp 2 | Exp 3 |
|---|---|---|---|
| Autism | 7.57 (5.87) | 8.30 (6.87) | 8.88 (6.05) |
| Control | 5.73 (3.99) | 6.01 (4.20) | 9.79 (8.03) |
| group difference p-value (t-test) | 0.45 | 0.41 | 0.79 |
Discussion
We observed consistent results in all three experiments. Experiment 1 provided evidence that endogenous spatial attention increases performance accuracy and decreases reaction time in individuals with autism and that these effects are statistically indistinguishable from those seen in a typically developing matched control group. Experiment 2 verified that these attentional benefits remain, even when the task requires rapid deployment of attention; the cue–stimulus onset asynchrony was 300 ms in this experiment and it takes ~300 ms for covert attention to be deployed (Nakayama and Mackeben, 1989; Liu et al., 2007). This finding indicates that individuals with autism are not only capable of allocating endogenous spatial attention, but that they can do so as quickly as control participants can. Finally, Experiment 3 confirmed that individuals with autism can increase the size of the attention field to account for spatial uncertainty, to the same extent as the control group, even when the task requires rapid (same as in Experiment 2) deployment of attention. Our results are consistent with previous research in children and adolescents (Renner et al., 2006) showing that the voluntary allocation of spatial attention is unaffected in individuals with ASD. We extend these findings by providing evidence for intact control of the attention field size in high–functioning adults with autism.
Previous research on spatial attention in ASD has provided some evidence of spatial attention deficits. It has been reported that individuals with ASD are slow to widen the spread of spatial attention (Mann and Walker, 2003), are faster to respond when the size of the visual field is reduced for them as part of the experimental design (Burack, 1994), and show evidence of a narrowly focused attentional spotlight (Townsend and Courchesne, 1994). Additionally, some studies have shown that individuals with ASD take longer to disengage attention from a location (Wainwright-Sharp and Bryson, 1993; Townsend et al., 1996; Wainwright and Bryson, 1996; Landry and Bryson, 2004) and are slower to shift attention to a new location (Harris et al., 1999; Townsend et al., 1999), compared to controls.
There are, however, concerns about how to interpret these previous results. First, in all but one of the experiments just described (Townsend et al., 1999), the conclusions are based on measurements of reaction time. Reaction time confounds discriminability, processing speed, and criterion. Reaction time differences found in typically developing individuals can emerge simply from a difference in criterion (i.e., the amount of sensory evidence necessary for a participant to respond), with no change in processing speed or discriminability (Reed, 1973; Wickelgren, 1977; Carrasco and McElree, 2001). Also, previous research using a speed-accuracy tradeoff procedure, to obtain conjoint measures of discriminability and information processing speed, has shown that attention not only improves discriminability of stimuli but also accelerates information processing (Carrasco and McElree, 2001; Carrasco et al., 2006; Giordano et al., 2009). Thus, reaction time alone cannot isolate the source of the effect. We measured both performance accuracy (independent of criterion) and reaction time to eliminate this potential confound. Given that we did not include invalid cues (i.e., a single cue to a wrong target location), however, our study cannot speak to the ability to disengage spatial attention at a given location. This is an important aspect of attention field control and future work will need to examine the cost of attending to non–target locations on performance accuracy.
Despite the problems associated with reaction time data, the finding that individuals with autism were significantly slower to respond under conditions of high spatial uncertainty (Experiment 3) warrants further study. These differences in reaction times were evident for neutral as well as valid trials, and the non–significant group X attention interaction (p = 0.70) indicates that such slowing was not due to a difference in the allocation or spread of spatial attention between groups. Even though they were significantly slower to respond, individuals with autism received attentional benefits that were statistically indistinguishable from matched control participants. Therefore, we can rule out the possibility that this slowing was due to a deficit in endogenous spatial attention.
What might account for this group difference in response time? Two potential explanations could be related to the experimental design. First, there were differences in trial number between the high spatial uncertainty (960 trials) and the low spatial uncertainty experiments (208 trials each); more trials were necessary to provide adequate statistical power at each of the 5 possible target locations in the high spatial uncertainty experiment. Collapsing across locations in Experiment 3 provided a nearly 5–fold increase in the amount of data in each attention condition, relative to Experiments 1 and 2. An additional possibility related to trial number is experiment duration. Experiments 1 and 2 were completed in one session, Experiment 3 on a separate day. Despite a comparable session length, with the same possibility for breaks, test blocks from Experiments 1 and 2 were separated by an explanation of the next experiment, practice trials, and a pre–test, with neutral trials only, to set task difficulty. Experiment 3 had no such change of task, and group differences in overall reaction time could be due to differences in fatigue, vigilance, boredom, executive function, or some other global factor.
This difference in reaction times could also be directly related to the high spatial uncertainty manipulation of Experiment 3. It may be the case that individuals with autism require more time to process and/or react to stimuli under conditions of uncertainty. Future work should address whether such slowing is specific to increases in spatial uncertainty, whether an increase in reaction time is a consequence of a general increase in task demands, or whether failing to find this reaction time difference in the low spatial uncertainty experiments can be accounted for by the methods differences mentioned above. Finding evidence for the latter would provide further empirical support for a general motoric slowing associated with ASD (for a review see Gowen and Hamilton, 2012).
We ensured these experiments would have sufficient statistical power. Even though we enrolled fewer participants than is typical in autism research, each participant performed a relatively large number of trials (Table 1), and the experimental protocol was based on psychophysical studies in which ~5 participants is typical. We are cognizant of the fact that individuals with ASD comprise a heterogeneous population, and that for this reason, sample size is a very important factor when evaluating empirical results. Our participants, however, were selected from a relatively homogeneous sub–population (high functioning, IQ range, age range, etc.), and this rationale was born out in the results. The statistical power in both subject groups was more than adequate to measure very clearly and robustly the effect of attention, on both accuracy and reaction time, in all 3 experiments. The confidence intervals (error bars) for all 3 experiments were very similar in the two groups. Finally, all participants, in both groups, showed a highly robust effect of attention (Figure 5). Finding such clear and consistent attention effects, with no evidence for heterogeneous performance across the participants in each group, enables us to conclude that for high–functioning adults with autism, the effects of attention on perception are the same as those observed in typically developing individuals.
In addition to providing empirical data on endogenous spatial attention function in ASD, we hope to encourage use of the methods that are now standard in the field of attention research. We also advocate more precision in terminology, and to that aim, we do not conclude that there are no ASD–associated attention deficits. The temporal and spatial profiles of exogenous attention, as well as visual feature-based attention, require further study, as does endogenous attention within other sensory modalities (e.g., auditory, somatosensory, etc.). Future studies should make use of the experimental protocols commonly used to study such forms of attention (Sperling and Melchner, 1978; Braun, 1998; Alais and Blake, 1999; Carrasco et al., 2000; Lu and Dosher, 2000; Carrasco and McElree, 2001; Verghese, 2001; Cavanagh and Alvarez, 2005; Carrasco, 2006; Ling and Carrasco, 2006a; Liu et al., 2007; Li et al., 2008; Pestilli et al., 2011; Herrmann et al., 2012), controlling what aspect of attention is being manipulated, as there may be deficits in only certain subcomponents of a given attentional system.
Acknowledgments
This research was supported by NIH grant R01-EY019693 to DH and MC, by SFARI grant 177638 to DH and MB, by ACE grant HD055748 to NM, and by Autism Speaks predoctoral fellowship 7831 to MG.
References
- Alais D, Blake R. Grouping visual features during binocular rivalry. Vision Res. 1999;39:4341–4353. doi: 10.1016/s0042-6989(99)00146-7. [DOI] [PubMed] [Google Scholar]
- Ames C, Fletcher-Watson S. A review of methods in the study of attention in autism. Develop Rev. 2010;30:52–73. [Google Scholar]
- Belopolsky AV, Zwaan L, Theeuwes J, Kramer AF. The size of an attentional window modulates attentional capture by color singletons. Psychon Bull Rev. 2007;14:934–938. doi: 10.3758/bf03194124. [DOI] [PubMed] [Google Scholar]
- Braun J. Vision and attention: the role of training. Nature. 1998;393:424–425. doi: 10.1038/30875. [DOI] [PubMed] [Google Scholar]
- Burack JA. Selective attention deficits in persons with autism: preliminary evidence of an inefficient attentional lens. J Abnorm Psychol. 1994;103:535–543. doi: 10.1037//0021-843x.103.3.535. [DOI] [PubMed] [Google Scholar]
- Carrasco M. Covert attention increases contrast sensitivity: Psychophysical, neurophysiological and neuroimaging studies. Prog Brain Res. 2006;154:33–70. doi: 10.1016/S0079-6123(06)54003-8. [DOI] [PubMed] [Google Scholar]
- Carrasco M. Visual attention: the past 25 years. Vision Res. 2011;51:1484–1525. doi: 10.1016/j.visres.2011.04.012. [DOI] [PMC free article] [PubMed] [Google Scholar]
- Carrasco M, McElree B. Covert attention accelerates the rate of visual information processing. Proc Natl Acad Sci U S A. 2001;98:5363–5367. doi: 10.1073/pnas.081074098. [DOI] [PMC free article] [PubMed] [Google Scholar]
- Carrasco M, Penpeci-Talgar C, Eckstein M. Spatial covert attention increases contrast sensitivity across the CSF: support for signal enhancement. Vision Res. 2000;40:1203–1215. doi: 10.1016/s0042-6989(00)00024-9. [DOI] [PMC free article] [PubMed] [Google Scholar]
- Carrasco M, Giordano AM, McElree B. Attention speeds processing across eccentricity: feature and conjunction searches. Vision Res. 2006;46:2028–2040. doi: 10.1016/j.visres.2005.12.015. [DOI] [PMC free article] [PubMed] [Google Scholar]
- Cavanagh P, Alvarez GA. Tracking multiple targets with multifocal attention. Trends Cogn Sci. 2005;9:349–354. doi: 10.1016/j.tics.2005.05.009. [DOI] [PubMed] [Google Scholar]
- Eriksen CW, St James JD. Visual attention within and around the field of focal attention: a zoom lens model. Percept Psychophys. 1986;40:225–240. doi: 10.3758/bf03211502. [DOI] [PubMed] [Google Scholar]
- Giordano AM, McElree B, Carrasco M. On the automaticity and flexibility of covert attention: a speed-accuracy trade-off analysis. J Vis. 2009;9:30, 31–10. doi: 10.1167/9.3.30. [DOI] [PMC free article] [PubMed] [Google Scholar]
- Gowen E, Hamilton A. Motor Abilities in Autism: A Review Using a Computational Context. J Autism Dev Disord. 2012 doi: 10.1007/s10803-012-1574-0. [DOI] [PubMed] [Google Scholar]
- Harris NS, Courchesne E, Townsend J, Carper RA, Lord C. Neuroanatomic contributions to slowed orienting of attention in children with autism. Brain Res Cogn Brain Res. 1999;8:61–71. doi: 10.1016/s0926-6410(99)00006-3. [DOI] [PubMed] [Google Scholar]
- Herrmann K, Heeger DJ, Carrasco M. Feature-based attention enhances performance by increasing response gain. Vision Res. 2012 doi: 10.1016/j.visres.2012.04.016. [DOI] [PMC free article] [PubMed] [Google Scholar]
- Herrmann K, Montaser-Kouhsari L, Carrasco M, Heeger DJ. When size matters: attention affects performance by contrast or response gain. Nat Neurosci. 2010;13:1554–1559. doi: 10.1038/nn.2669. [DOI] [PMC free article] [PubMed] [Google Scholar]
- James W. The principles of psychology. New York: H. Holt and company; 1890. [Google Scholar]
- Kimchi R, Peterson MA. Figure-ground segmentation can occur without attention. Psychol Sci. 2008;19:660–668. doi: 10.1111/j.1467-9280.2008.02140.x. [DOI] [PubMed] [Google Scholar]
- Landry R, Bryson SE. Impaired disengagement of attention in young children with autism. J Child Psychol Psychiatry. 2004;45:1115–1122. doi: 10.1111/j.1469-7610.2004.00304.x. [DOI] [PubMed] [Google Scholar]
- Li X, Lu ZL, Tjan BS, Dosher BA, Chu W. Blood oxygenation level-dependent contrast response functions identify mechanisms of covert attention in early visual areas. Proc Nat Acad Sci U S A. 2008;105:6202–6207. doi: 10.1073/pnas.0801390105. [DOI] [PMC free article] [PubMed] [Google Scholar]
- Ling S, Carrasco M. When sustained attention impairs perception. Nat Neurosci. 2006a;9:1243–1245. doi: 10.1038/nn1761. [DOI] [PMC free article] [PubMed] [Google Scholar]
- Ling S, Carrasco M. Sustained and transient covert attention enhance the signal via different contrast response functions. Vision Res. 2006b;46:1210–1220. doi: 10.1016/j.visres.2005.05.008. [DOI] [PMC free article] [PubMed] [Google Scholar]
- Liu T, Pestilli F, Carrasco M. Transient attention enhances perceptual performance and FMRI response in human visual cortex. Neuron. 2005;45:469–477. doi: 10.1016/j.neuron.2004.12.039. [DOI] [PMC free article] [PubMed] [Google Scholar]
- Liu T, Stevens ST, Carrasco M. Comparing the time course and efficacy of spatial and feature-based attention. Vision Res. 2007;47:108–113. doi: 10.1016/j.visres.2006.09.017. [DOI] [PubMed] [Google Scholar]
- Lu ZL, Dosher BA. Spatial attention: different mechanisms for central and peripheral temporal precues? J Exp Psychol Hum Percept Perform. 2000;26:1534–1548. doi: 10.1037//0096-1523.26.5.1534. [DOI] [PubMed] [Google Scholar]
- Mann TA, Walker P. Autism and a deficit in broadening the spread of visual attention. J Child Psychol Psychiatry. 2003;44:274–284. doi: 10.1111/1469-7610.00120. [DOI] [PubMed] [Google Scholar]
- Muller NG, Bartelt OA, Donner TH, Villringer A, Brandt SA. A physiological correlate of the “Zoom Lens” of visual attention. J Neurosci. 2003;23:3561–3565. doi: 10.1523/JNEUROSCI.23-09-03561.2003. [DOI] [PMC free article] [PubMed] [Google Scholar]
- Nakayama K, Mackeben M. Sustained and transient components of focal visual attention. Vision Res. 1989;29:1631–1647. doi: 10.1016/0042-6989(89)90144-2. [DOI] [PubMed] [Google Scholar]
- Pestilli F, Carrasco M. Attention enhances contrast sensitivity at cued and impairs it at uncued locations. Vision Res. 2005;45:1867–1875. doi: 10.1016/j.visres.2005.01.019. [DOI] [PubMed] [Google Scholar]
- Pestilli F, Ling S, Carrasco M. A population-coding model of attention’s influence on contrast response: Estimating neural effects from psychophysical data. Vision Res. 2009;49:1144–1153. doi: 10.1016/j.visres.2008.09.018. [DOI] [PMC free article] [PubMed] [Google Scholar]
- Pestilli F, Carrasco M, Heeger DJ, Gardner JL. Attentional enhancement via selection and pooling of early sensory responses in human visual cortex. Neuron. 2011;72:832–846. doi: 10.1016/j.neuron.2011.09.025. [DOI] [PMC free article] [PubMed] [Google Scholar]
- Posner MI, Snyder CR, Davidson BJ. Attention and the detection of signals. J Exp Psychol. 1980;109:160–174. [PubMed] [Google Scholar]
- Reed AV. Speed-accuracy trade-off in recognition memory. Science. 1973;181:574–576. doi: 10.1126/science.181.4099.574. [DOI] [PubMed] [Google Scholar]
- Remington A, Swettenham J, Campbell R, Coleman M. Selective attention and perceptual load in autism spectrum disorder. Psychol Sci. 2009;20:1388–1393. doi: 10.1111/j.1467-9280.2009.02454.x. [DOI] [PubMed] [Google Scholar]
- Renner P, Grofer Klinger L, Klinger MR. Exogenous and endogenous attention orienting in autism spectrum disorders. Child Neuropsychol. 2006;12:361–382. doi: 10.1080/09297040600770753. [DOI] [PubMed] [Google Scholar]
- Senju A, Tojo Y, Dairoku H, Hasegawa T. Reflexive orienting in response to eye gaze and an arrow in children with and without autism. J Child Psychol Psychiatry. 2004;45:445–458. doi: 10.1111/j.1469-7610.2004.00236.x. [DOI] [PubMed] [Google Scholar]
- Sperling G, Melchner MJ. The attention operating characteristic: examples from visual search. Science. 1978;202:315–318. doi: 10.1126/science.694536. [DOI] [PubMed] [Google Scholar]
- Townsend J, Courchesne E. Parietal Damage and Narrow Spotlight Spatial Attention. J Cog Neurosci. 1994;6:220–232. doi: 10.1162/jocn.1994.6.3.220. [DOI] [PubMed] [Google Scholar]
- Townsend J, Courchesne E, Egaas B. Slowed orienting of covert visual-spatial attention in autism: Specific deficits associated with cerebellar and parietal abnormality. Develop and Psychopath. 1996;8:563–584. [Google Scholar]
- Townsend J, Courchesne E, Covington J, Westerfield M, Harris NS, Lyden P, Lowry TP, Press GA. Spatial attention deficits in patients with acquired or developmental cerebellar abnormality. J Neurosci. 1999;19:5632–5643. doi: 10.1523/JNEUROSCI.19-13-05632.1999. [DOI] [PMC free article] [PubMed] [Google Scholar]
- Verghese P. Visual search and attention: a signal detection theory approach. Neuron. 2001;31:523–535. doi: 10.1016/s0896-6273(01)00392-0. [DOI] [PubMed] [Google Scholar]
- Wainwright JA, Bryson SE. Visual-spatial orienting in autism. J Autism Dev Disord. 1996;26:423–438. doi: 10.1007/BF02172827. [DOI] [PubMed] [Google Scholar]
- Wainwright-Sharp JA, Bryson SE. Visual orienting deficits in high-functioning people with autism. J Autism Dev Disord. 1993;23:1–13. doi: 10.1007/BF01066415. [DOI] [PubMed] [Google Scholar]
- Wickelgren WA. Speed-accuracy tradeoff and information processing dynamics. Acta Psychologica. 1977;41:67–85. [Google Scholar]
- Yantis S, Jonides J. Abrupt Visual Onsets and Selective Attention - Evidence from Visual-Search. J Exp Psychol Hum Percept Perform. 1984;10:601–621. doi: 10.1037//0096-1523.10.5.601. [DOI] [PubMed] [Google Scholar]
- Yeshurun Y, Montagna B, Carrasco M. On the flexibility of sustained attention and its effects on a texture segmentation task. Vision Res. 2008;48:80–95. doi: 10.1016/j.visres.2007.10.015. [DOI] [PMC free article] [PubMed] [Google Scholar]