

Abstract
A new microarray platform, based on lectin super-microarrays and glycans labeled with dye-doped nanoparticles, has been developed to study glycan-lectin interactions. Glycan ligands were conjugated onto fluorescein-doped silica nanoparticles (FSNPs) using a general photocoupling chemistry to afford FSNP-labeled glycan probes. Lectins were printed on epoxy slides in duplicate sets to generate lectin super-microarrays where multiple assays could be carried out simultaneously in each lectin microarray. Thus, the lectin super-microarray was treated with FSNP-labeled glycans to screen for specific binding pairs. Furthermore, a series of ligand competition assays were carried out on a single lectin super-microarray to generate the dose-response curve for each glycan-lectin pair, from which the apparent affinity constants were obtained. Results showed 4~7 orders of magnitude increase in affinity over the free glycans with the corresponding lectins. Thus, the glycan epitope structures having weaker affinity than the parent glycans could be readily identified and analyzed from the lectin super-microarrays.
Keywords: biosensing, glycan-lectin interactions, dye-doped silica nanoparticles, lectin super-microarrays
1. Introduction
Microarrays have become an important tool in biological research for large-scale ligand profiling, owing to their features of high-throughput signal output and fast data analysis. Since multiple ligands are tethered to a solid surface, multivalency comes into play where the binding affinities of the immobilized ligands towards capturing analytes can be enhanced by orders of magnitude (Cheung et al. 1999; Daniel J 2002; Debouck and Goodfellow 1999; Fukui et al. 2002; Southern et al. 1999). This is especially attractive for studying the low affinity glycan-lectin interactions whose dissociation constants lie in the millimolar to micromolar range (Sulak et al. 2009). Glycan-lectin interaction plays a crucial role in the living system since it is involved and mediates a variety of biologically important processes for example, cell communication and migration, tumor progression and genesis, immune responses and fertilization, as well as disease including cancers (Crocker et al. 2007; Dube and Bertozzi 2005; Fuster and Esko 2005; Liu and Rabinovich 2005; Ohtsubo and Marth 2006; Sharon 2006; Szymanski and Wren 2005). The absence of efficient tools for exploring glycan binding to carbohydrate-binding proteins has severely hampered the development in this area, and microarrays have the potential to greatly accelerate the progress. The vast majority of high throughput glycan-lectin studies use glycan microarrays that involve detection of the interaction using fluorescently labeled lectins (Liang et al. 2007; Liang et al. 2008; Paulson et al. 2006; Shin et al. 2005; Song et al. 2009; Stevens et al. 2006). An alternative configuration is to construct lectin microarrays and probe them with glycans. This can be advantageous since protein microarrays have been in use for a long time, are more refined than glycan microarrays, and can be fabricated using established procedures (MacBeath 2002; MacBeath and Schreiber 2000), or acquired from commercial sources (Vlacich et al. 2007). A large number of proteins can be immobilized on different solid surfaces, including glass slides, silicon wafers, microwells, nitrocellulose or PVDF membranes via covalent attachment on chemically activated materials (epoxy, aldehyde, active esters), or non-covalently, relying on hydrophobic (nitrocellulose or polystyrene), electrostatic interactions (polylysine, aminosilane), or a combination of weak interaction forces (streptavidin-biotin) (Angenendt 2005; Borrebaeck and Ohlin 2002; Chandra and Srivastava 2010; Glökler and Angenendt 2003; Tao and Zhu 2006). Lectin immobilization can be performed adopting similar strategies. For example, Zheng et al. reported the covalent immobilization of lectins on a N-hydroxysuccinimidyl (NHS)-functionalized gold surface to analyze carbohydrate expression on cell surfaces (Zheng et al. 2005). Smith and coworkers fabricated oriented Fc-fused lectin microarrays by covalently attaching the lectins to boronic acid-coated substrates (Chen et al. 2008). This conjugation method yields boronate esters, and the resulting microarrays maintained high glycan-binding activity. Commercially available slides, for example, SCHOTT NEXTERION® Slide H with an amine-reactive polymer coating, have also been used in lectin microarray fabrication (Hsu and Mahal 2006; Tao et al. 2008; Wang et al. 2008). For signal detection, the target molecules are often labeled, for example, with a luminescent tag (Dove 2005; Liang et al. 2007; Stoll et al. 2004). Label-free analytical methods such as surface plasmon resonance (SPR) are also widespread (Duverger et al. 2003; Foley et al. 2008; Lebed et al. 2006). In a study by Hirabayashi and coworkers, lectin microarrays were fabricated on epoxy slides, and were subsequently assayed with Cy3-tagged glycoproteins, glycopeptides and tetramethylrhodamine-labeled oligosaccharides (Kuno et al. 2005).
In contrast to proteins that can be readily derivatized using commercially available kits, glycan labeling can be challenging. In HPLC, electrophoresis or mass spectrometric analysis, glycans are chemically derivatized at their reducing ends by reductive amination using, for example, 2-amino benzamide or anthranilic acid (Krishnamoorthy and Mahal 2009; Bigge et al. 1995). To overcome these issues, we have developed a general method to label glycans with dye-doped silica nanoparticles (Wang et al. 2011b). The coupling chemistry is versatile, and is applicable to any glycan structure without the need of prior derivatization. By embedding fluorescent dyes inside the silica nanoparticles, the resulting dyes exhibit enhanced fluorescent intensity as well as photostability. In addition, silica nanoparticles are of low toxicity, and monodisperse particles can be readily synthesized from low-cost starting materials using a simple procedure. Furthermore, nanoparticles act as a multivalent scaffold, and when glycans are tethered on the particle surface, the ligands act cooperatively when binding to lectins (Drechsler et al. 2004). This multivalency effect results in significant affinity enhancement (Huskens 2006; Jayaraman 2009), a feature that is highly desirable in glycomics research, given the relatively weak affinity between glycans and lectins (Lis and Sharon 1998; Sharon 2007).
In this article, we describe a new microarray platform based on lectin super-microarrays and glycans labeled with dye-doped silica nanoparticles. The lectin super-microarray is fabricated by printing multiple lectin microarrays on a single slide (Fig. 1a). By applying a PDMS (poly(dimethylsiloxane)) isolator, many individual lectin microarrays can be created, which significantly improves the throughput of microarrays (Fig. 1a). The lectin super-microarrays are validated using glycans labeled with dye-doped silica nanoparticles. In addition, multiple ligand competition assays are conducted simultaneously on a single lectin super-microarray to yield dose-response curves as well as apparent affinity constants of lectin-glycan pairs.
Fig. 1.

(a) Schematics of lectin super-microarray fabrication, and subsequent assays with FSNP-glycans; (b) Chemical structures of carbohydrates used.
2. Materials and method
2.1 Preparation of FSNP-labeled glycans
FSNP-labeled glycans were synthesized following a previously established procedure (Wang et al. 2011b). FSNPs, ~110 nm in diameter, were prepared using a modified Stöber protocol (see Supporting Information for detailed procedure). PFPA-silane (80 mg) was then added to the FSNPs solution and the functionalization was completed after vigorous stirring at room temperature overnight (Fig. 1a) (Gann and Yan 2008). The carbohydrate coupling was carried out by mixing PFPA-functionalized FSNPs with an aqueous solution of carbohydrate (1 mg/mL, 1 mL) and the mixture was irradiated with a 450-W medium-pressure Hg lamp (Hanovia) for 10 min under vigorous stirring (Wang et al. 2011b). The resulting particles were dialyzed in water overnight to remove excess carbohydrates, affording the FSNP-labeled glycan. The glycan density on FSNPs was determined using the anthrone/H2SO4 colorimetric assay following the previously established procedure (Wang et al. 2009). A fresh anthrone solution in concentrated H2SO4 (0.5 wt%, 1 mL) was added to the carbohydrate solution in water (0.5 mL) in an ice bath. The solution was heated to 100 °C, stirred for 10 min, and was then cooled to room temperature before the UV-vis spectrum of the resulting solution was recorded on a Perkin-Elmer Lambda 45 UV-vis spectrometer. Calibration curves were generated for each carbohydrate by recording the absorbance of the resulting solution at 620 nm at various carbohydrate concentrations (Wang et al. 2010b). FSNP-labeled glycans were subjected to the same assay where the solutions of FSNP-glycan in Milli-Q water (30–50 μg/0.5 mL) were treated with anthrone/H2SO4. The amount of surface-tethered carbohydrate was then determined from the corresponding calibration curve.
2.2 Fabrication of lectin super-microarrays
The lectin super-microarrays were prepared on epoxy-functionalized glass slides. Glass slides were cleaned using piranha solution (conc. H2SO4/30%H2O2, 1:1 v/v) by heating the slides at 80 °C for 1 h followed by thorough rinsing with boiling water (3 times). (Caution: Piranha solution reacts violently with organic solvents. Use extreme care when handling this solution.) The cleaned slides were soaked in a toluene solution of 3-glycidyloxypropyltrimethoxysilane (12.6 mM, >95%, TCI America; Portland, OR) for 4 hours, rinsed thoroughly with toluene and dried with nitrogen to afford the epoxy-functionalized glass slides. Con A (Concanavalin A), BSA (Bovine serum albumin), SBA (Soybean Agglutinin), PNA (Peanut Agglutinin), BS-I (Bandeiraea simplicifolia Lectin I) (Sigma-Aldrich; St. Louis, MO), DBA (Dolichos biflorus Agglutinin), UEA (Ulex europaeus Agglutinin I), WGA (Wheat Germ Agglutinin) and RCA-I (Ricinus Communis Agglutinin I) (Vector Laboratories; Burlingame, CA) were used as received. The concentration of Con A was calibrated spectrophotometrically using A1%,1 cm (280 nm) = 13.7 at pH 7.2 (Mandal et al. 1994). OAA (Oscillatoria agardhii Agglutinin) wild-type lectins, and CN-V mutants CVNQ50C and CVNMutDB were obtained following previously published procedures (Koharudin and Gronenborn 2011; Matei et al. 2008). Lectin solutions were prepared in phosphate-buffered saline (PBS) at concentrations of 1 mg/mL except for PNA and RCA-I which were prepared at 0.25 mg/mL since the two solutions were more viscous than other lectin solutions (Kuno et al. 2005). Glycerol (40%) was added to the buffer solution to prevent complete drying of the liquid droplets after printing. To print the lectin super-microarrays, the lectin solutions (0.3 mL each) were transferred to a microtiter plate and the solutions were spotted onto the epoxy-functionalized slides using a robotic printer (BioOdyssey Calligrapher Mini-arrayer; Bio-Rad Laboratories, Inc.) and a 360 μm capillary pin. Each spot was printed 5 times and 5 duplicate spots were printed for each lectin. The glass slides were then incubated in a humid chamber (80% humidity) at 25 °C for 3 h to facilitate the immobilization of the lectins. A SecureSeal™ hybridization chambers sheet, i.e., the PDMS isolator (Grace Bio-lab, Bend, OR), was carefully placed on the glass slide to create 16 individual wells (Dove 2005; Kuno et al. 2005). A blocking solution of BSA in pH 7.4 PBS buffer (1%) was then added to each well and the slide was incubated at room temperature for 1 h. Finally, the slide was rinsed with the PBS buffer and dried under N2.
2.3 Treating lectin super-microarray with FSNP-glycans
Solutions of FSNP-glycans in HEPES (1.5 mg/mL) were placed in each well on the lectin super-microarray, and were incubated at room temperature for 2 h. The super-microarray was then gently rinsed with a fresh HEPES buffer containing 0.1% Tween 20 for 3 times and dried with N2. For the competition assays, various concentrations of 2α-Man2 in HEPES (1 nM – 1 mM) was added to FSNP-Man2 (1.5 mg/mL), and the resulting solutions were added to each well for incubation following the same procedure described above. The treated super-microarrays were imaged under a microarray scanner (GenePix 4100A, Molecular Devices, Inc) at the excitation of 532 nm. The fluorescence images were recorded and the data were analyzed using the supplied software (Axon GenePix Pro 5.1).
3. Results and discussion
3.1 Optimization of lectin super-microarrays and assay conditions
Lectin microarrays were prepared on epoxy-functionalized surfaces following a literature procedure (MacBeath and Schreiber 2000). Piranha-cleaned glass slides were treated with an epoxy-silane, 3-glycidoxypropyltrimethoxysilane (GPTMS, Fig. 1a), and lectin solutions containing glycerol were printed onto the epoxy slide using a robotic microarrayer. The lectin super-microarray was generated by printing 16 duplicates of a 5 × 7 lectin microarray on a single slide. When a 2 × 8-block PDMS isolator was placed on the super-microarray, 16 individual wells were created, each containing a 5 × 7 lectin microarray (Fig. 1a).
The lectin super-microarrays were tested in a carbohydrate screen in which the glycans were labeled with fluorescein-doped silica nanoparticles (FSNPs, see Supporting Information for detailed synthesis and characterization). We previously demonstrated that glycan ligands can be efficiently labeled with FSNPs without diminishing their bioactivity (Tong et al. 2012; Wang et al. 2011b). In the present study, FSNPs of 110 nm diameter were synthesized (Wang et al. 2011b), and carbohydrates were conjugated using the previously developed photocoupling chemistry to yield FSNP-labeled glycans (Fig. 1) (Gann and Yan 2008; Wang et al. 2011b; Wang et al. 2009).
Binding assays were carried out by incubating different FSNP-labeled glycans within each well on the lectin super-microarray (Fig. 1a). After rinsing with fresh buffer and drying, fluorescence images were recorded on a microarray scanner. The lectin printing concentration, the concentration and incubation time of the FSNP-labeled glycans were varied in order to assess the impact of these experimental conditions on the results. For FSNP-Man2 interacting with immobilized Con A, the fluorescence intensity increased linearly with the Con A printing concentration from 0.1 to 2.5 mg/mL (Fig. 2a). Similarly, the fluorescence intensity increased with the FSNP-Man2 concentration from 0.05 to 1.0 mg/mL (Fig. 2b). Subsequently, the concentrations of Con A and FSNP-Man2 were kept constant at 1 mg/mL and 1.5 mg/mL, respectively, and the incubation time was varied. As shown in Fig. 2c, the intensity increased with the incubation time and reached saturation after 2 hours. AFM images reveal that excellent uniformity was obtained with respect to the coverage of FSNPs on individual spots (Fig. S4, Supporting Information). In a control experiment, a non-binding lectin, SBA, was incubated with FSNP-Man2. The signal intensity was low until up to 2 hours, with some later increase likely due to the non-specific adsorption of FSNP-Man2 (Fig. 2c). To minimize particle agglomeration and non-specific adsorption, the FSNP-glycan concentration and the incubation time were kept at 1.5 mg/mL and 2 hours, respectively, in all subsequent studies.
Fig. 2.
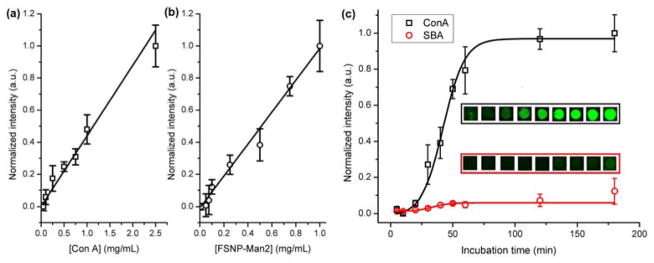
Interactions of FSNP-Man2 with the lectin super-microarray: (a) fluorescence intensity vs. the printing concentration of Con A (□); (b) fluorescence intensity vs. the concentration of FSNP-Man2 (○); (c) fluorescence intensity vs. the incubation time with FSNP-Man2 (inserts: fluorescence images of Con A spots (top panel) and SBA spots (bottom panel). The concentrations of FSNP-Man2 in (a) and (c) were 1.5 mg/mL, and the printing concentration of Con A in (b) was 1 mg/mL. Each data point was the average of the five duplicate spots on the array. Lines were drawn solely to guide the eye.
3.2 Lectin super-microarrays for glycan ligand screening
The lectin super-microarray was evaluated in a screen of carbohydrate targets using FSNP-labeled glycans. A total of 14 lectins were used and their glycan ligands are listed in Table S1. Because of size limitations imposed by the PDMS isolator and printed spots, only seven lectins fit inside one isolator well, necessitating the separation of the lectins into two groups. Each lectin was printed on an epoxy-functionalized glass slide in a 5×7 array, with the array duplicated 16 times to create a super-microarray with 16 identical lectin microarrays on each slide (Fig. 1a). The carbohydrates used in this study are listed in Fig. 1b. Each carbohydrate was labeled with FSNPs (as described above), and the ligand density in the FSNP-glycan conjugates was determined using the colorimetry method reported in our previous study (Table S2, Supporting Information) (Wang et al. 2011b). The PDMS isolator was placed on the lectin super-microarray to create 16 wells (Fig. 1a), and different FSNP-labeled glycans were incubated in each individual well containing the 5×7 lectin microarray.
Results of the microarray analysis are shown in Fig. 3. Matching binding pairs (2α-Man2/CVNs, 2α-Man2/Con A, 2α,2α-Man3/CVNs, 2α,2α-Man3/Con A, Man/Con A, Gal/PNA, Gal/BS-I, 6α-Man2/OAA, 6α-Man2/PFA, 3α,6α-Man3/OAA, 3α,6α-Man3/PFA, Fuc/UEA, and Glc/WGA) exhibited significantly higher fluorescence intensities than the non-matching combinations, and the overall results are consistent with the known affinities in the cognate glycan-lectin pairs (Table S3, Supporting Information), confirming the exquisite selectivity of the lectin super-microarrays. The signal intensities also reflected the relative binding affinities of the glycan targets to the lectins. For instance, Con A is a tetrameric protein with known specificity for α-Man and α-Glc structures with the affinity in the order of 2α,2α-Man3 (Ka 3.79 × 10⁵ M−1) > 2α-Man2 (Ka 4.17 × 10⁴ M−1) > Man (Ka 8.2 × 10³ M−1) > Glc (Ka 1.96 × 10³ M−1) (Mandal et al. 1994). On the lectin microarrays, Con A spots exhibited the highest intensity for 2α,2α-Man3 followed by 2α-Man2, Man, Glc/GlcNAc/Lac, and only a marginal signal was detected for the non-binding ligand Gal (Fig. 3). Two variants of Cyanovirin-N (CVNQ50C and CVNMutDB) that recognize α1,2-linked Man structures such as 2α-Man2 and 2α,2α-Man3 were also tested (Barrientos and Gronenborn 2005). The data in Fig. 3 show that 2α,2α-Man3 conjugated on FSNPs exhibited higher fluorescence intensities than FSNP-Man2, correlating well with the affinity rank of the free ligands Man3 and Man2 measured by ITC (isothermal titration calorimetry, Table S3, Supporting Information) (Matei et al. 2008). Similar results were also observed for other lectin-glycan binding pairs, corroborating that the array results are highly consistent with the affinity rank order established by equilibrium binding experiments using non-immobilized free ligands.
Fig. 3.
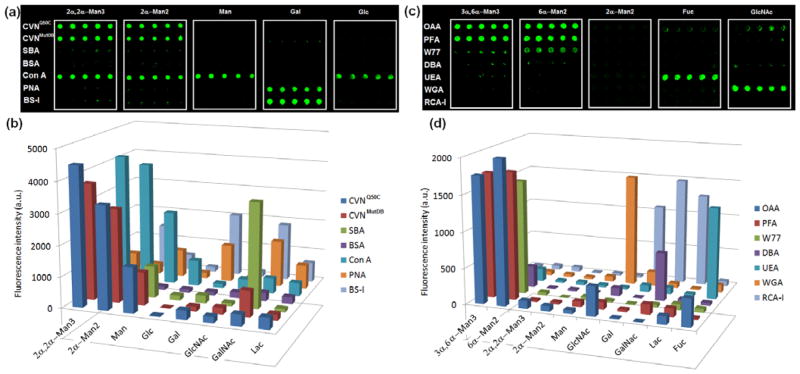
Fluorescence images (a, c) and the corresponding fluorescence intensities (b, d) of lectin super-microarrays probed with FSNP-labeled glycans.
3.3. Super-microarrays for high throughput binding affinity determination
The PDMS isolator creates 16 individual microarrays, and therefore, 16 different assays can be carried out simultaneously on a single super-microarray. When 16 ligand competition assays are performed, a dose-response curve will be generated, from which the EC50 values can be derived and apparent dissociation constants calculated. This provides a high throughput means to determine binding affinities for interacting pairs on a single lectin super-microarray.
The competition binding assays were carried out by treating each microarray on the super-microarray with a solution containing a free glycan of varying concentrations and a fixed concentration of FSNP-labeled glycan. Fig. 4a displays a typical fluorescence image of the lectin super-microarray after incubating with FSNP-Man2 and varying concentration of 2α-Man2. Only the cognate lectins for 2α-Man2 (CVNQ50C, CVNMutDB, Con A) exhibited clean, concentration-dependent signals with 2α-Man2. As expected, the fluorescence intensity decreased with increasing concentration of 2α-Man2, permitting the extraction of EC50 values from the corresponding dose-response curves. The dose-response curves for the three lectins CVNQ50C, CVNMutDB, and Con A are displayed in Fig. 4b–d. Using a modified Cheng-Prusoff equation,
Fig. 4.

(a) Fluorescence image of lectin super-microarray after incubating with a mixture of FSNP-Man2 and varying concentration of 2α-Man2. From top to bottom, the lectins on the 6×6 microarray are CVNQ50C, CVNMutDB, SBA, Con A, PNA, BS-I, respectively. (b–d) Fluorescence intensity vs. concentration of free 2α-Man2 for CVNQ50C (b), CVNMutDB (c), and Con A (d). The insert in (b) shows the fluorescence image of the corresponding spots.
where [M] is the concentration of the free ligand, Kd is the dissociation constant of the free ligand with lectin, and KD is the apparent dissociation constant of the immobilized lectin with the FSNP-labeled glycan (Cheng and Prusoff 1973; Wang et al. 2010a). EC50 values are calculated and results are presented in Table 1.
Table 1.
Apparent KD values obtained from a lectin super-microarray and FSNP-glycans.
| Ligand density (Wang et al. 2011b) (ligand/nm2) | CVNQ50C | CVNMutDB | Con A | PNA | |
|---|---|---|---|---|---|
| FSNP-Man3 | 1.3 | 1.66 nM (15.5 μM) (Wang et al. 2011a) | 0.43 nM (3.4 μM) (Matei et al. 2008) | 0.0083 nM (2.97 μM) (Mandal et al. 1994) | N/D |
| FSNP-Man2 | 1.5 | 16.6 nM (89.8 μM) (Wang et al. 2011a) | 589 nM (757 μM) (Matei et al. 2008) | 5.40 nM (24 μM) (Mandal et al. 1994) | N/D |
| FSNP-Man | 4.2 | N/D | N/D | 13.7 nM (470 μM) (Mandal et al. 1994) | N/D |
| FSNP-Gal | 4.3 | N/D | N/D | N/D | 114 nM (1050 μM) |
The numbers in brackets correspond to dissociation constants of the non-immobilized (free) glycans with the respective lectins. N/D= not detectable.
4. Conclusions
We present a new microarray platform where glycans labeled with dye-doped nanoparticles were used to probe lectin super-microarrays. The dye-doped nanoparticles offer higher fluorescence intensity and improved photo-stability, compared to using free organic dyes. In addition, the nanoparticles act as efficient multivalent scaffolds that enhance the apparent affinities of glycans to the lectins. More significantly, a uniform labeling chemistry permits glycan labeling with the nanoparticles without additional chemical derivatization. The lectin super-microarray, containing multiple lectin microarrays on the same slide, further increases the analysis throughput. Thus, different assays can be performed simultaneously, allowing for large-scale glycan profiling. Furthermore, ligand competition assays can be conducted on a single super-microarray to afford dose response curves, from which EC50 and apparent KD values can be readily computed. This represents a new methodology for affinity determination.
Compared with other techniques for assessing glycan-lectin interactions, such as nuclear magnetic resonance (NMR) (Johnson and Pinto 2004), ELISA (Gervay and McReynolds 1996), ITC (Dam and Brewer 2002), agglutination (Knibbs et al. 1993), equilibrium dialysis (Cho and Cummings 1996), spectrophotometry (Polizzotti et al. 2007), fluorescence competition assay (Wang et al. 2010b), SPR (Deng et al. 2011; Tyagi et al. 2010), carbohydrate microarrays (Pei et al. 2007), dynamic light scattering (DLS) (Wang et al. 2011c), and quartz-crystal microbalance (QCM) (Norberg et al. 2011; Norberg et al. 2009), the present method is high-throughput and affords assessment of an apparent affinity constant from simple mixing and incubation experiments on a single slide. For each assay on the super-microarray, only ~0.3 μg of glycan is needed to synthesize the corresponding FSNP-labeled glycan. This is comparable to glycan microarrays where glycan quantities of the order of ~0.7 μg are needed for printing (Tyagi et al. 2010). As can be appreciated by the data presented in Table 1, enhanced binding affinities by 4~7 orders of magnitude, compared to equilibrium binding using non-immobilized ligands for the lectin, can be achieved, exploiting the multivalent presentation of the lectin on the slide as well as multivalency of glycans on the nanoparticles. This results in larger signals, facilitating and speeding-up array analysis and ligand screening. For example, it has been reported that Man9 is the natural ligand of CVN lectins (O’Keefe et al. 2000; Shenoy et al. 2001). The lower mannose structures of 2α-Man2 and 2α,2α-Man3 exhibit weak (micromolar to millimolar) affinities towards CVN and its variants, and the affinity constants can be difficult to determine by ITC (Barrientos and Gronenborn 2005; Matei et al. 2008; Wang et al. 2011a). However, both these glycans exhibited good responses on the lectin super-microarrays (Fig. 3a). This demonstrates the power of the present methodology for screening binding epitopes of complex glycans.
In summary, the rapid and high throughput nature of the described lectin super-microarrays, in conjunction with the versatility of the nanoparticle-based glycan labeling technique, provide a robust and unique approach for quantitative glycan profiling in a large library. The basic protocol could in principle also be applied to other biological molecules, such as DNA, antibodies, and cells. Therefore, the technology presented here opens new opportunities for fundamental studies in glycoscience as well as for the development of new diagnostic tools.
Supplementary Material
Acknowledgments
This work was supported by National Institutes of Health Grants R01GM080295 and 2R15GM066279 (to M.Y.) and R01GM080642 (to A.M.G.). LD thanks the China Scholarship Council for a special scholarship award.
Appendix A. Supporting information
Supporting information is available: Material characterization, AFM images, and list of lectin-glycan binding pairs. This material is available free of charge via the Internet at.
Footnotes
Publisher's Disclaimer: This is a PDF file of an unedited manuscript that has been accepted for publication. As a service to our customers we are providing this early version of the manuscript. The manuscript will undergo copyediting, typesetting, and review of the resulting proof before it is published in its final citable form. Please note that during the production process errors may be discovered which could affect the content, and all legal disclaimers that apply to the journal pertain.
References
- Angenendt P. Drug Discovery Today. 2005;10:503–511. doi: 10.1016/S1359-6446(05)03392-1. [DOI] [PubMed] [Google Scholar]
- Barrientos LG, Gronenborn AM. Mini-Rev Med Chem. 2005;5 (1):21–31. doi: 10.2174/1389557053402783. [DOI] [PubMed] [Google Scholar]
- Bigge JC, Patel TP, Bruce JA, Goulding PN, Charles SM, Parekh RB. Anal Biochem. 1995;230 (2):229–238. doi: 10.1006/abio.1995.1468. [DOI] [PubMed] [Google Scholar]
- Borrebaeck CA, Ohlin M. Nat Biotechnol. 2002;20:1189–1190. doi: 10.1038/nbt1202-1189. [DOI] [PubMed] [Google Scholar]
- Chandra H, Srivastava S. Proteomics. 2010;10:717–730. doi: 10.1002/pmic.200900462. [DOI] [PubMed] [Google Scholar]
- Chen ML, Adak AK, Yeh NC, Yang WB, Chuang YJ, Wong CH, Hwang KC, Hwu JRR, Hsieh SL, Lin CC. Angew Chem Int Ed. 2008;47 (45):8627–8630. doi: 10.1002/anie.200803377. [DOI] [PubMed] [Google Scholar]
- Cheng YC, Prusoff WH. Biochem Pharmacol. 1973;22 (23):3099–3108. doi: 10.1016/0006-2952(73)90196-2. [DOI] [PubMed] [Google Scholar]
- Cheung V, Morley M, Aguilar F, Massimi A, Kucherlapati R, Childs G. Nat Genet. 1999;21:15–19. doi: 10.1038/4439. [DOI] [PubMed] [Google Scholar]
- Cho M, Cummings RD. Biochemistry (Mosc) 1996;35 (40):13081–13088. doi: 10.1021/bi961181d. [DOI] [PubMed] [Google Scholar]
- Crocker PR, Paulson JC, Varki A. Nat Rev Immunol. 2007;7:255–266. doi: 10.1038/nri2056. [DOI] [PubMed] [Google Scholar]
- Dam TK, Brewer CF. Chem Rev. 2002;102 (2):387–430. doi: 10.1021/cr000401x. [DOI] [PubMed] [Google Scholar]
- Daniel JC. Curr Opin Pharmacol. 2002;2 (5):551–554. doi: 10.1016/s1471-4892(02)00207-2. [DOI] [PubMed] [Google Scholar]
- Debouck C, Goodfellow P. Nat Genet. 1999;21:48–50. doi: 10.1038/4475. [DOI] [PubMed] [Google Scholar]
- Deng L, Norberg O, Uppalapati S, Yan M, Ramström O. Org Biomol Chem. 2011;9:3188–3198. doi: 10.1039/c1ob05040k. [DOI] [PMC free article] [PubMed] [Google Scholar]
- Dove A. Nat Methods. 2005;2:709–717. [Google Scholar]
- Drechsler U, Erdogan B, Rotello VM. Chem Eur J. 2004;10 (22):5570–5579. doi: 10.1002/chem.200306076. [DOI] [PubMed] [Google Scholar]
- Dube DH, Bertozzi CR. Nat Rev Drug Discov. 2005;4:477–488. doi: 10.1038/nrd1751. [DOI] [PubMed] [Google Scholar]
- Duverger E, Frison N, Roche AC, Monsigny M. Biochimie. 2003;85 (1–2):167–179. doi: 10.1016/s0300-9084(03)00060-9. [DOI] [PubMed] [Google Scholar]
- Foley KJ, Forzani ES, Joshi L, Tao N. Analyst. 2008;133(6) doi: 10.1039/b719321a. [DOI] [PubMed] [Google Scholar]
- Fukui S, Feizi T, Galustian C, Lawson AM, Chai W. Nat Biotechnol. 2002;20:1011–1017. doi: 10.1038/nbt735. [DOI] [PubMed] [Google Scholar]
- Fuster MM, Esko JD. Nat Rev Cancer. 2005;5:526–542. doi: 10.1038/nrc1649. [DOI] [PubMed] [Google Scholar]
- Gann JP, Yan M. Langmuir. 2008;24 (10):5319–5323. doi: 10.1021/la7029592. [DOI] [PMC free article] [PubMed] [Google Scholar]
- Gervay J, McReynolds KD. Curr Med Chem. 1996;6 (2):129–153. [PubMed] [Google Scholar]
- Glökler J, Angenendt P. J Chromatogr B. 2003;797 (1–2):229–240. doi: 10.1016/j.jchromb.2003.08.034. [DOI] [PubMed] [Google Scholar]
- Hsu KL, Mahal LK. Nat Protocols. 2006;1 (2):543–549. doi: 10.1038/nprot.2006.76. [DOI] [PubMed] [Google Scholar]
- Huskens J. Curr Opin Chem Biol. 2006;10 (6):537–543. doi: 10.1016/j.cbpa.2006.09.007. [DOI] [PubMed] [Google Scholar]
- Jayaraman N. Chem Soc Rev. 2009;38:3463–3483. doi: 10.1039/b815961k. [DOI] [PubMed] [Google Scholar]
- Johnson MA, Pinto BM. Carbohydr Res. 2004;339 (5):907–928. doi: 10.1016/j.carres.2003.12.028. [DOI] [PubMed] [Google Scholar]
- Knibbs RN, Agrwal N, Wang JL, Goldstein IJ. J Biol Chem. 1993;268 (20):14940–14947. [PubMed] [Google Scholar]
- Koharudin LM, Gronenborn AM. Structure. 2011;19 (8):1170–1181. doi: 10.1016/j.str.2011.05.010. [DOI] [PMC free article] [PubMed] [Google Scholar]
- Krishnamoorthy L, Mahal LK. ACS Chem Biol. 2009;4 (9):715–732. doi: 10.1021/cb900103n. [DOI] [PMC free article] [PubMed] [Google Scholar]
- Kuno A, Uchiyama N, Koseki-Kuno S, Ebe Y, Takashima S, Yamada M, Hirabayashi J. Nat Methods. 2005;2 (11):851–856. doi: 10.1038/nmeth803. [DOI] [PubMed] [Google Scholar]
- Lebed K, Kulik AJ, Forró L, Lekka M. J Colloid Interface Sci. 2006;299 (1):41–48. doi: 10.1016/j.jcis.2006.01.053. [DOI] [PubMed] [Google Scholar]
- Liang PH, Wang SK, Wong CH. J Am Chem Soc. 2007;129 (36):11177–11184. doi: 10.1021/ja072931h. [DOI] [PubMed] [Google Scholar]
- Liang PH, Wu CY, Greenberg WA, Wong CH. Curr Opin Chem Biol. 2008;12 (1):86–92. doi: 10.1016/j.cbpa.2008.01.031. [DOI] [PMC free article] [PubMed] [Google Scholar]
- Lis H, Sharon N. Chem Rev. 1998;98 (2):637–674. doi: 10.1021/cr940413g. [DOI] [PubMed] [Google Scholar]
- Liu FT, Rabinovich GA. Nat Rev Cancer. 2005;5:29–41. doi: 10.1038/nrc1527. [DOI] [PubMed] [Google Scholar]
- MacBeath G. Nat Genet. 2002;32:526–532. doi: 10.1038/ng1037. [DOI] [PubMed] [Google Scholar]
- MacBeath G, Schreiber SL. Science. 2000;289 (5485):1760–1763. doi: 10.1126/science.289.5485.1760. [DOI] [PubMed] [Google Scholar]
- Mandal DK, Kishore N, Brewer CF. Biochemistry (Mosc) 1994;33 (5):1149–1156. doi: 10.1021/bi00171a014. [DOI] [PubMed] [Google Scholar]
- Matei E, Furey W, Gronenborn AM. Structure. 2008;16 (8):1183–1194. doi: 10.1016/j.str.2008.05.011. [DOI] [PMC free article] [PubMed] [Google Scholar]
- Norberg O, Deng L, Aastrup T, Yan M, Ramström O. Anal Chem. 2011;83 (3):1000–1007. doi: 10.1021/ac102781u. [DOI] [PMC free article] [PubMed] [Google Scholar]
- Norberg O, Deng L, Yan M, Ramström O. Bioconjugate Chem. 2009;20 (12):2364–2370. doi: 10.1021/bc9003519. [DOI] [PMC free article] [PubMed] [Google Scholar]
- O’Keefe BR, Shenoy SR, Xie D, Zhang W, Muschik JM, Currens MJ, Chaiken I, Boyd MR. Mol Pharmacol. 2000;58 (5):982–992. doi: 10.1124/mol.58.5.982. [DOI] [PubMed] [Google Scholar]
- Ohtsubo K, Marth JD. Cell. 2006;126:855–867. doi: 10.1016/j.cell.2006.08.019. [DOI] [PubMed] [Google Scholar]
- Paulson JC, Blixt O, Collins BE. Nat Chem Biol. 2006;2 (5):238–248. doi: 10.1038/nchembio785. [DOI] [PubMed] [Google Scholar]
- Pei Z, Yu H, Theurer M, Waldén A, Nilsson P, Yan M, Ramström O. ChemBioChem. 2007;8 (2):166–168. doi: 10.1002/cbic.200600447. [DOI] [PMC free article] [PubMed] [Google Scholar]
- Polizzotti BD, Maheshwari R, Vinkenborg J, Kiick KL. Macromolecules. 2007;40 (20):7103–7110. doi: 10.1021/ma070725o. [DOI] [PMC free article] [PubMed] [Google Scholar]
- Sharon N. Biochim Biophys Acta, Gen Subj. 2006;1760:527–537. doi: 10.1016/j.bbagen.2005.12.008. [DOI] [PubMed] [Google Scholar]
- Sharon N. J Biol Chem. 2007;282 (5):2753–2764. doi: 10.1074/jbc.X600004200. [DOI] [PubMed] [Google Scholar]
- Shenoy SR, O’Keefe BR, Bolmstedt AJ, Cartner LK, Boyd MR. J Pharmacol Exp Ther. 2001;297 (2):704–710. [PubMed] [Google Scholar]
- Shin I, Park S, Lee MR. Chem Eur J. 2005;11 (10):2894–2901. doi: 10.1002/chem.200401030. [DOI] [PubMed] [Google Scholar]
- Song X, Xia B, Stowell SR, Lasanajak Y, Smith DF, Cummings RD. Chem Biol. 2009;16 (1):36–47. doi: 10.1016/j.chembiol.2008.11.004. [DOI] [PMC free article] [PubMed] [Google Scholar]
- Southern E, Mir K, Shchepinov M. Nat Genet. 1999;21:5–9. doi: 10.1038/4429. [DOI] [PubMed] [Google Scholar]
- Stevens J, Blixt O, Glaser L, Taubenberger JK, Palese P, Paulson JC, Wilson IA. J Mol Biol. 2006;355 (5):1143–1155. doi: 10.1016/j.jmb.2005.11.002. [DOI] [PubMed] [Google Scholar]
- Stoll D, Bachmann J, Templin M, Joos T. Drug Discov Today Targets. 2004;3:24–31. [PubMed] [Google Scholar]
- Sulak O, Lameignere E, Wimmerova M, Imberty A. In: Carbohydr Chem. Rauter AP, Lindhorst TK, editors. The Royal Society of Chemistry; Cambridge, UK: 2009. pp. 357–372. [Google Scholar]
- Szymanski CM, Wren BW. Nat Rev Microbiol. 2005;3:225–237. doi: 10.1038/nrmicro1100. [DOI] [PubMed] [Google Scholar]
- Tao SC, Li Y, Zhou J, Qian J, Schnaar RL, Zhang Y, Goldstein IJ, Zhu H, Schneck JP. Glycobiology. 2008;18 (10):761–769. doi: 10.1093/glycob/cwn063. [DOI] [PMC free article] [PubMed] [Google Scholar]
- Tao SC, Zhu H. Nat Biotechnol. 2006;24:1253–1254. doi: 10.1038/nbt1249. [DOI] [PubMed] [Google Scholar]
- Tong Q, Wang X, Wang H, Kubo T, Yan M. Anal Chem. 2012;84 (7):3049–3052. doi: 10.1021/ac203455b. [DOI] [PMC free article] [PubMed] [Google Scholar]
- Tyagi A, Wang X, Deng LQ, Ramström O, Yan M. Biosens Bioelectron. 2010;26:344–350. doi: 10.1016/j.bios.2010.08.009. [DOI] [PMC free article] [PubMed] [Google Scholar]
- Vlacich G, Roe C, Webb GC. Nat Clin Pract End Met. 2007;3 (8):594–605. doi: 10.1038/ncpendmet0580. [DOI] [PubMed] [Google Scholar]
- Wang CC, Huang YL, Ren CT, Lin CW, Hung JT, Yu JC, Yu AL, Wu CY, Wong CH. Proc Natl Acad Sci U S A. 2008;105 (33):11661–11666. doi: 10.1073/pnas.0804923105. [DOI] [PMC free article] [PubMed] [Google Scholar]
- Wang X, Matei E, Deng LQ, Ramström O, Gronenborn AM, Yan M. Chem Commun. 2011a;47:8620–8622. doi: 10.1039/c1cc12981c. [DOI] [PMC free article] [PubMed] [Google Scholar]
- Wang X, Ramström O, Yan M. Chem Commun. 2011b;47 (14):4261–4263. doi: 10.1039/c0cc05299j. [DOI] [PMC free article] [PubMed] [Google Scholar]
- Wang X, Ramström O, Yan M. Analyst. 2011c;136:4174–4178. doi: 10.1039/c1an15469a. [DOI] [PMC free article] [PubMed] [Google Scholar]
- Wang X, Ramström O, Yan M. J Mater Chem. 2009;19 (47):8944–8949. doi: 10.1039/B917900C. [DOI] [PMC free article] [PubMed] [Google Scholar]
- Wang X, Ramström O, Yan M. Adv Mater. 2010a;22:1946–1953. doi: 10.1002/adma.200903908. [DOI] [PMC free article] [PubMed] [Google Scholar]
- Wang X, Ramström O, Yan M. Anal Chem. 2010b;82 (21):9082–9089. doi: 10.1021/ac102114z. [DOI] [PMC free article] [PubMed] [Google Scholar]
- Zheng T, Peelen D, Smith LM. J Am Chem Soc. 2005;127 (28):9982–9983. doi: 10.1021/ja0505550. [DOI] [PubMed] [Google Scholar]
Associated Data
This section collects any data citations, data availability statements, or supplementary materials included in this article.