

Abstract
Despite nearly universal expression of the wild‐type epidermal growth factor receptor (EGFR) and reproducible activity of EGFR inhibitors in patients with squamous cell carcinoma of the head and neck (SCCHN), the majority of patients will not have objective responses. The mechanisms of this intrinsic resistance are not well established. We hypothesized that sensitivity to EGFR inhibitors can be predicted based on the inhibitors' effects on downstream signaling. Cell viability assays were used to assess sensitivity to the EGFR inhibitor gefitinib (ZD1839) in 8 SCCHN cell lines. Fluorescence in‐situ hybridization showed the two most sensitive lines to be highly gene‐amplified for EGFR. Western blotting confirmed that phosphoEGFR was inhibited at low concentrations of gefitinib in all lines tested. Phosphorylation of downstream signaling protein AKT was inhibited in sensitive lines while inhibition of phosphoERK displayed no relationship to gefitinib efficacy. Phosphatase and tensin homolog (PTEN) expression was evident in all cell lines. Activating PIK3CA mutations were found in two resistant cell lines where pAKT was not inhibited by gefitinib. In resistant cell lines harboring PIK3CA mutations, a PI3K inhibitor, LY294002, or AKT siRNA reduced cell viability with an additive effect demonstrated in combination with gefitinib. Additionally, LY294002 alone and in combination with gefitinib, was effective at treating PIK3CA mutated tumors xenografted into nude mice. Taken together this suggests that constitutively active AKT is a mechanism of intrinsic gefitinib resistance in SCCHN. This resistance can be overcome through targeting of the PI3K/AKT pathway in combination with EGFR inhibition.
Keywords: EGFR, Gefitinib, Head and neck squamous cell carcinoma, AKT, PIK3CA mutations
Highlights
-
►
Cells sensitive to EGFRi showed phosphoAKT inhibition.
-
►
No relationship was seen between phosphoERK inhibition and EGFRi sensitivity.
-
►
Two resistant cell lines have constitutively activating PIK3CA mutations.
-
►
Blocking the PI3K/AKT pathway can overcome EGFRi resistance.
-
►
Constitutively active AKT is a mechanism of intrinsic gefitinib resistance in SCCHN.
Abbreviations
- SCCHN
squamous cell carcinoma of the head and neck
- EGFR
Epidermal Growth Factor Receptor
- RECIST
Response Evaluation Criteria in Solid Tumors
- NSCLC
non-small cell lung cancer
- CRC
colorectal cancer
- TKI
tyrosine kinase inhibitors
- EGFRi
EGFR inhibitors
- PTEN
phosphatase and tensin homolog
1. Introduction
SCCHN is the 5th leading cause of cancer mortality worldwide (Pisani et al., 2002). The development of EGFR as a therapeutic target in SCCHN was conceived over two decades ago given the near universal expression and prognostic significance of the protein. EGFR inhibitors have offered a reasonable therapeutic avenue in patients with recurrent or metastatic SCCHN because they are well tolerated and easily administered (Cohen, 2006). Clinical trials administering drugs targeting EGFR have demonstrated reproducible and consistent activity (Cohen, 2006) including RECIST defined response rates of approximately 10%. Moreover, administration of the EGFR monoclonal antibody, cetuximab, with radiotherapy in locally advanced SCCHN or with chemotherapy in refractory disease improves survival (Bonner et al., 2006; Vermorken et al., 2007). This efficacy has led to regulatory approval of cetuximab in SCCHN and the widespread use of the agent in this disease.
Nonetheless, the great majority of SCCHN tumors will not be reduced significantly in size with these drugs while stable disease is often of short duration (Chen et al., 2010); activity reminiscent of targeted agents administered to unselected patients in other malignancies, e.g. erlotinib in NSCLC, cetuximab in CRC, and trastuzumab in breast cancer (De Roock et al.; Nanda, 2007; Ray et al., 2009). Compared to SCCHN, single agent EGFR inhibitors have similar efficacy in NSCLC and CRC in unselected patients but in both these diseases mechanisms underlying sensitivity or primary resistance have been described: EGFR tyrosine kinase mutations in NSCLC (Lynch et al., 2004; Paez et al., 2004) and the presence of K‐Ras mutations in CRC (Siena et al., 2009). We examined tumor samples from SCCHN patients treated with EGFR TKI and found no evidence of tyrosine kinase mutations by nested PCR of EGFR exons 18–24 (Cohen et al., 2005). The absence of EGFR mutations in SCCHN has been confirmed by other investigators (Chung et al., 2006; Temam et al., 2007). K‐Ras mutations occur rarely in SCCHN and thus would not explain resistance to EGFR inhibitors (Sheu et al., 2009). Therefore, mechanisms underlying sensitivity or resistance to EGFR inhibitors in SCCHN remain largely unknown. EGFR inhibition in SCCHN has a desirable biologic effect but cannot overcome the complex proliferative and survival signals inherent in many cancer cells. Understanding sensitivity or resistance mechanisms would provide opportunity to improve efficacy dramatically.
Several likely candidates for increased resistance to EGFRi are found in signaling pathways downstream of EGFR. The PTEN gene encodes a phosphatase that negatively regulates AKT activity. PTEN dysregulation in cancer occurs through different mechanisms including deletion, missense mutation, and hypermethylation (Keniry and Parsons, 2008) and decreased PTEN expression has been associated with resistance to EGFR inhibitors in other tumor models. Other mechanisms of AKT activation in cancer cells also include amplification of the gene encoding the p110α catalytic subunit of PI3K (PIK3CA) or AKT2 and activating mutations in PIK3CA or AKT1. In a comprehensive study of SCCHN tumor specimens, Pedrero et al. (2005), found PIK3CA, AKT2, or PTEN alterations in 47% of cases. Mutations of PIK3CA occur in approximately 8% of SCCHN patients overall (Stransky et al., 2011) while PIK3CA amplification or polysomy appears in 20–50% of patients (Fenic et al., 2007; Kozaki et al., 2006; Pedrero et al., 2005). Here we assess sensitivity to the EGFR inhibitor gefitinib, and explore inhibition of downstream signaling proteins, focusing on the PI3K/AKT pathway.
2. Materials and methods
2.1. Inhibitors
Gefitinib (ZD1839) was provided by AstraZeneca (Macclesfield, UK) and purchased from Cayman Chemical (Ann Arbor, Michigan); LY294002, a highly selective inhibitor of PI3 kinase, was purchased from Selleck Chemicals LLC (Houston, TX).
2.2. Antibodies
pAKT (Ser 473), Akt1, Akt2, phosphoErk, PTEN, p‐EGFR (Tyr1068) and EGFR antibodies were purchased from Cell Signaling Technology, Inc. (Danvers, MA). Tubulin and actin antibodies were purchased from Santa Cruz Biotechnology, Inc. (Santa Cruz, CA). Secondary goat anti‐rabbit IgG IRDye antibody was purchased from LI‐COR Biosciences (Lincoln, NE). Secondary mouse IgM IRDye antibody was purchased from Rockland Immunochemicals Inc. (Gilbertsville, PA).
2.3. Cell lines and culture
SQ20B, SCC61, SCC35, and SCC25 cells were obtained from Dr. Ralph Weichselbaum (University of Chicago, Chicago, IL) and HN31 and MSK921 cells were provided by Dr. David Raben (University of Colorado Cancer Center, Denver, CO). Detroit 562 cells were purchased from the American Type Culture Collection (Manassas, VA). HN5 cells were obtained from Ludwig Institute of Cancer Research (London, United Kingdom). Cell lines were maintained as previously described (Liu et al., 2011). For in vitro experiments, cell lines were grown to 70–80% confluence and then maintained for a further 24 h in serum‐free conditions before treatment. Serum starvation was undertaken to maximally synchronize cell cycle stage. Serum‐starved cells were treated with gefitinib or LY294002 at the indicated concentrations for 4 h in serum‐containing medium. Cells were then harvested and lysed, and proteins were subjected to protein immunoblotting analysis.
2.4. Cell growth inhibition assay with MTT
MTT (3‐[4,5‐dimethylthiazol‐2‐yl]‐2,5‐diphenyl tetrazolium bromide) (Roche Diagnostics GambH, Mannheim, Germany) assays were used to determine cell viability. Briefly, cells were seeded at 1000cells/well on 96‐well plates, incubated for 24 h, maintained in serum‐free conditions for 24 h, and then treated with gefitinib and/or LY294002 for 72 h at 37 °C. After drug treatment, MTT Labeling Reagent was added to each well and incubated for 4 h at 37 °C before the Solubilization Solution was added. Cell viability was quantified by scanning absorbance at 550 nm in a microplate reader (Bio‐Tek, Winooski, VT). Experiments were performed in quadruplicates.
2.5. Western blot analysis
Western blots on cell lysates and mouse tissues were performed as previously described (Liu et al., 2011). Visualization and quantification were performed with Odyssey Infrared Imaging System (Li‐Cor Biosciences). Experiments were repeated at least three times.
2.6. FISH assay and interpretation
Metaphase cell preparations from H&N cell lines and from normal peripheral blood lymphocytes were done according to routine protocols (Barch et al., 1997). To evaluate the EGFR gene copy number (GCN) alterations, dual‐color FISH assays were conducted using a LSI EGFR:CEP7 Probe mixture (Vysis/Abbott Molecular, Des Plaines, IL). The EGFR DNA Probe is labeled with SpectrumOrange and covers a ∼300 kb region on 7p12 that contains the entire EGFR gene. The CEP7 probe, labeled in SpectrumGreen, hybridizes to the alpha satellite DNA located at the centromere of chromosome 7 (7p11.1–q11.1). CEP7 probe was used to distinguish true gene amplification from EGFR gene copy number gain (gene polysomy) and alterations in number of chromosome 7 homologues. Normal peripheral blood lymphocytes and HN5 cells were used to verify the hybridization efficiency and as negative and positive controls for EGFR amplification, respectively (Rogers et al., 2009). FISH hybridization procedure and post‐hybridization washes were done as described by Vysis/Abbott Molecular. In each cell line, an average of 80 (range, 50–180) well‐defined malignant nuclei were scored. The absolute number of each signal, the mean copy number of signal per cell, the ratios of EGFR to CEP7, and the percentage of cells with given copy number of each signal per cell were calculated. Analysis of EGFR GCN alterations was performed and FISH positivity (FISH+) was defined by the high number of the copies of EGFR (amplification or high polysomy) as previously described (Chung et al., 2006, 2007). Briefly, cells with an EGFR:CEP7 signal ratio <2 were considered non‐amplified, whereas those with a ratio greater than 2.0 (or ≥ 15 copies of EGFR per cells in ≥10% of cells) were considered as having true amplification. Cells with ratios near cut off points were equivocal or low amplified. The alterations in gene signals due to polysomy were classified as following: disomy, ≤2 gene copies in more than 90% of cells; trisomy, 3 gene copies in ≥10% of cells; low polysomy, ≥4 gene copies in ≥10% but less than 40%; high polysomy, ≥4 gene copies in ≥40%.
2.7. Preparation of RNA and DNA
Total RNA and DNA were extracted using the RNeasy Mini Kit (Qiagen) and the PUREGENE DNA Purification Kit (Qiagen), respectively. To prepare cDNA, 1 μg of total RNA was reverse transcribed using SuperScript II reverse transcriptase with both oligo(dT)n and random primers according to the manufacturer's protocol (Invitrogen). The cDNA was then diluted five times for PCR reactions.
2.8. Quantification of TGFA, EGFR and AREG mRNA expression and EGFR copy number by real‐time PCR
The real‐time PCR method for quantification of EGFR gene expression and copy number has been reported previously (Liu et al., 2007). For TGFA and AREG genes, 210 bp and 127 bp amplicons were generated by real‐time PCR, respectively. The primer sequences for the two amplicons are TGFA‐F: 5′‐CCTCATCTGCCGGCACGAGAA‐3′, TGFA‐R: 5′‐ TGCACAGGTGATTACAGGCCA‐3′; and AREG‐F: 5′‐CACCTGGAAGCAGTAACATGC‐3′, AREG‐F: 5′‐CAGCTATGGCTGCTAATGCA‐3′. The 18S rRNA gene (18S) was used as internal control according to the protocol described previously (Ramirez et al., 2008). Reactions were performed with standard curves for all genes and repeated three times. Real‐time PCR was cycled 45 times at 95 °C for 30 s, 55 °C for 1 min and 72 °C for 30 s after preheating at 95 °C for 10 min. The relative expression level of each gene was normalized by that of 18 S. The gene/18 s ratios were used as the final relative expression data for analysis.
2.9. Identification of PIK3CA mutations
Exons 9 and 20 of the PIK3CA gene were amplified and sequenced. Primers were designed using Primer3 (version 0.4.0): TTGCTTTTTCTGTAAATCATCTGTG, CCAATAGGTATGGTAAA‐AACATGC (Exon 9, amplicon size: 307 bp); TTGTGACATTTGAGCAAAGACC, TAATGCTGTTCATGGATTGTGC (Exon 20, amplicon size: 461 bp) DNA was extracted from cultured cell lines using the Qiagen AllPrep Kit. PCR and agarose gel electrophoresis were performed before samples were sent to the University of Chicago DNA Sequencing Core Facility, where fluorescent dye terminator sequencing and capillary electrophoresis were performed (both directions).
2.10. siRNA
siRNA experiments were performed using the Nucleofector electroporation device (Lonza, Cologne, Germany) and the Amaxa cell line nucleofector kit V (Lonza) using standard protocol. Sixteen to 24 h after electroporation cells were plated in 96‐well plates, starved for 8 or 24 h then treated with drug for 48 h. MTT assays were performed as described above.
2.11. Tumor xenografts
Xenograft experiments were conducted as previously described (Liu et al., 2011). Briefly, female athymic nude mice (Charles River Laboratories, Wilmington, MA) at 6–7 weeks of age were maintained in a pathogen‐free animal facility in accordance with the University of Chicago Animal Care and Use Committee. Mice received standard laboratory rodent food and water as desired. All handling procedures were conducted in a laminar‐flow biosafety hood. SCC61 or Detroit 562 cells were used to induce SCCHN tumor xenografts. The drug treatment was initiated when mean tumor volumes reached 100–200 mm3. Tumor‐bearing animals were randomly divided into 4 groups of 6 animals. Mice were treated with gefitinib 50 mg/kg body weight once per day, via oral gavage; LY294002 100 mg/kg body weight once per day via i.p. injection; gefitinib and LY294002 once daily at the same doses; or equal volume of diluents (control). For tumor growth analysis tumor size was measured every other day with a vernier caliper. Tumor volumes were calculated with the formula V = 0.52 × L × W2, where L and W represent the length and the width of the tumor (mm). The animals were monitored 2 times per week for body weight. The treatment lasted 16–20 days as controls must be euthanized after this due to size of tumors. Differences in tumor growth were compared by two‐way ANOVA followed by Bonferroni multiple comparison test.
3. Results
3.1. Sensitivity to gefitinib in HNC cell lines
We sought to define mechanisms of primary resistance to EGFR inhibitors in eight SCCHN cell lines (Cardinali et al., 1995; Lin et al., 2007) using gefitinib, a small molecule EGFR TKI. SCCHN cell lines were incubated with gefitinib at increasing concentrations to determine their relative sensitivity. Choosing a concentration that is generally effective in vitro, we observed a range of sensitivity across cell lines (Table 1) and began to examine underlying genetic or signaling events that were associated with sensitivity or resistance. EGFR phosphorylation at tyrosine 1068 by Western blotting was reduced in all cell lines confirming that the agent inhibited its intended target (Figure 1A).
Table 1.
Gefintib resistance, EGFR gene copy number alterations and mRNA expression levels of SCCHN Cell lines.
| Cell line | Cell viability upon exposure to 5 μM gefitinib | FISH | qPCR | ||||||
|---|---|---|---|---|---|---|---|---|---|
| EGFR GCNa | CEP7 GCNb | EGFR/CEP7c | Result | TGFa/18s | AREG/18s | EGFR/18S | Result | ||
| SCC35 | 0.9025 ± 0.1155 | 4.24 | 4.18 | 1.01 | No Ampl | 0.32 | 5.09 | 1.51 | Normal |
| Detroit 562 | 0.5701 ± 0.1401 | 3.22 | 3.17 | 1.02 | No Ampl | 0.17 | 0.74 | 2.63 | Normal |
| SCC25 | 0.5162 ± 0.0568 | 4.08 | 2.20 | 1.90–2.01 | Equivocal/Low | 0.28 | 1.26 | 7.33 | Gain |
| SCC61 | 0.4977 ± 0.0607 | 3.51 | 3.19 | 1.10 | No Ampl | 0.19 | 1.29 | 1.27 | Normal |
| HN31 | 0.4423 ± 0.0522 | 4.18 | 4.06 | 1.03 | No Ampl | 0.28 | 1.56 | 1.67 | Normal |
| MSK921 | 0.3387 ± 0.1438 | 8.23 | 8.09 | 1.02 | No Ampl | 0.30 | 9.54 | 1.87 | Normal |
| SQ20B | 0.3353 ± 0.1371 | 29.44 | 4.10 | 7.18 | High Ampl | 0.43 | 10.52 | 10.42 | Gain |
| HN5 | 0.1381 ± 0.0325 | 48.30 | 4.86 | 9.94 | High Ampl | 0.53 | 7.17 | 12.32 | Gain |
qPCR: Mean values from three experiments were calculated relative to 18 s as control, arbitrarily set at 1. Gain, ≥7 copies of gene/18 s.
Mean copy number EGFR per cell.
Mean copy number of centromere enumeration probe (CEP7) per cell.
Mean EGFR gene to CEP7 ratio; Ampl, amplification, ≥15 copies of gene per cells in ≥10% of cells or gene to CEP ratio ≥2.0; Equivocal/Low, ratio near cut off point 2.
Figure 1.
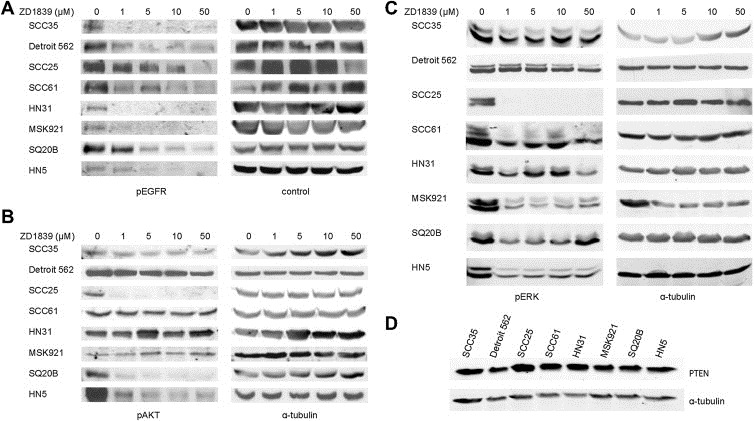
Phosphorylation of EGFR, AKT and ERK, and PTEN expression in SCCHN cell lines. A, EGFR phosphorylation at tyrosine 1068 by Western blotting was reduced in all cell lines upon treatment with increasing concentrations of gefitinib. Tubulin and EGFR serve as loading controls. B, Phosphorylation of AKT and C, phosphorylation of ERK proteins with increasing concentrations of gefitinib are shown by Western blotting. Tubulin serves as loading controls. D, Expression of PTEN in all cell lines is shown by Western blotting. Tubulin serves as loading control.
We considered whether, similar to HER2 amplified breast cancers that are sensitive to trastuzumab, EGFR amplification, described in approximately 10% of SCCHN tumors (Freier et al., 2003; Koynova et al., 2005; Leonard et al., 1991), could account for gefitinib sensitivity in SCCHN cell lines. FISH was used to evaluate GCN alterations. Five of eight cell lines tested showed no EGFR gene amplification (EGFR:CEP7 signal ratio <2.0; SCC35, Detroit 562, SCC61, HN31, MSK921), while one exhibited equivocal/low amplification (SCC25). The two most sensitive cell lines (HN5 and SQ20B) were highly amplified (EGFR:CEP7 signal ratio >5.0). Most of the cell lines were highly polysomic (≥4 signal copies in ≥40% of cells) for EGFR and chromosome 7, exceptions being SCC25 which has high polysomy for EGFR and was trisomic for CEP7. Detroit 562 and SCC61 exhibited low polysomy for both signals. These results were consistent with qPCR data showing HN5, SQ20B and SCC25 to have the highest EGFR gene expression (Figure 2 and Table 1). In addition, we did not observe a correlation between mRNA expression of key ligands, Transforming Growth Factor α or amphiregulin, and sensitivity (Table 1).
Figure 2.
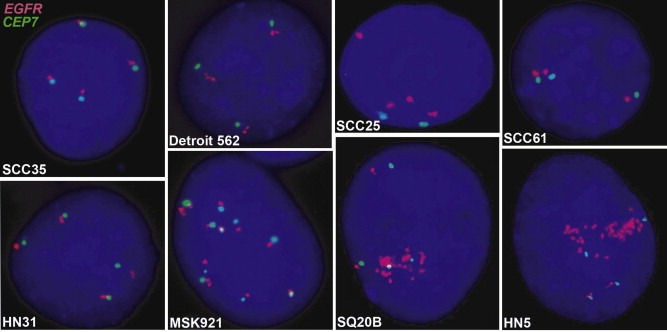
EGFR gene amplification. Images of interphase nuclei after FISH are presented. The EGFR gene is localized by red fluorescent signals, and chromosome 17 centromere (CEP7) is localized by green fluorescent signals. The cells were counterstained with DAPI (blue). Magnification ×1200.
3.2. Downstream signaling proteins in HNC cell lines
We then evaluated the effect of EGFR inhibition on primary downstream signaling pathways hypothesizing that reduction of ERK and AKT phosphorylation would correlate with sensitivity to gefitinib. Interestingly, AKT phosphorylation was inhibited only in the three cell lines where EGFR was amplified (Figure 1B) showing EGFR does regulate AKT activation. Inhibition of pERK displayed variable effect upon gefitinib exposure (Figure 1C). Therefore, some cell lines resistant to EGFR inhibition continue to utilize AKT signaling pathways independently of EGFR. Clearly, however, there are exceptions such as SCC25 where pAKT was inhibited by gefitinib but still exhibited moderate EGFRi resistance.
We examined PTEN protein expression by immunoblotting in SCCHN cell lines but found that all lines express the protein at approximately equal levels (Figure 1D), eliminating PTEN loss as an explanation of primary EGFR inhibitor resistance in these lines. However, both SCC61 and Detroit 562 cell lines harbor constitutively activating, canonical PIK3CA mutations (SCC61: Exon 9, 1625 G > GA (E542K), Detroit 562: Exon 20 3140A > AG (H1047R) and are relatively resistant to EGFR inhibition (Figure 3).
Figure 3.
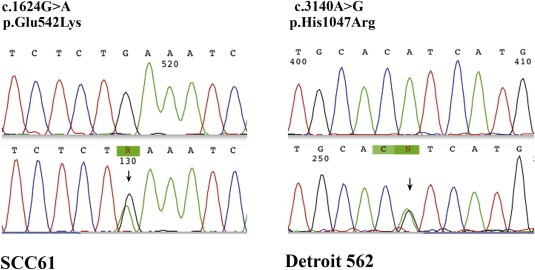
Sequencing chromatograms of PIK3CA mutations in SCC61 and Detroit 562 cell lines.
3.3. Counteracting AKT activation
A corollary of these observations is that cell lines harboring EGFR‐independent AKT activation would be sensitive to inhibition of the PI3K/AKT pathway. We tested whether the PI3K inhibitor, LY294002, is effective at inhibiting cell viability in the gefitinib resistant Detroit 562 and SCC61 cell lines. Indeed, LY294002 effectively reduced cell viability while the combination of LY294002 and gefitinib had an additive effect (Figure 4A). Moreover, siRNA depletion of AKT1 and AKT2 in Detroit 562 and SCC61 cell lines significantly inhibited cell growth with gefitinib again producing an additive effect (Figure 4B). Constitutively active AKT does represent a mechanism of primary EGFR inhibitor resistance in SCCHN which can be overcome by specifically targeted agents and augmented by EGFR inhibition. Conversely, when we removed negative regulation of the PI3K/AKT pathway in SQ20B, a cell line sensitive to EGFRi, resistance to gefitinib increased (Figure 4D). siRNA knockdown proteins was confirmed by Western blotting (Figure 4C and E).
Figure 4.
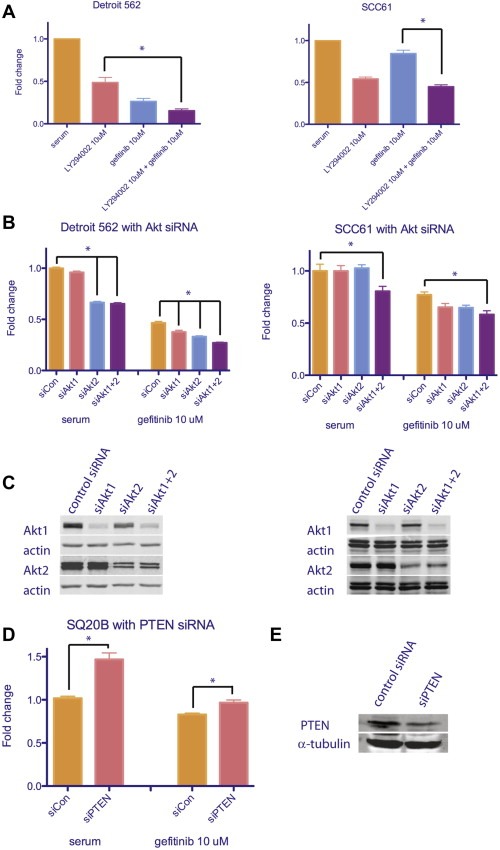
Inhibition of EGFR and PI3K/AKT pathway has additive effects in SCCHN cell lines with constitutively active PIK3CA mutations, while removing negative regulation of PI3K/AKT pathway increases resistance in sensitive SCCHN cell line. A, results from MTT assays on cells treated with PI3K inhibitor, LY294002, and gefitinib. By repeated measures one‐way ANOVA, means are significantly different; p < 0.0001. By Tukey's multiple comparison test; *p < 0.05. B, results from MTT assays on cells treated with Akt1 and Akt2 siRNA and gefitinib. By repeated measures one‐way ANOVA, means are significantly different; p < 0.0001. By Tukey's multiple comparison test differences between siAkt 1 + 2 with and without gefitinib and as indicated; *p < 0.05. C, Western blot results showing Akt protein levels decrease upon siRNA treatment. Actin serves as loading control. D, results from MTT assays on cells treated with PTEN siRNA and gefitinib. By repeated measures one‐way ANOVA, means are significantly different; p < 0.0001. *p < 0.05. E, Western blot results showing PTEN protein levels decrease upon siRNA treatment. α‐tubulin serves as loading control.
3.4. In vivo effect of gefitinib and LY294002 on tumor growth
In female nude mice injected with SCC61 or Detroit 562 cells, both gefitinib and LY294002 inhibited tumor growth (Figure 5). However, the most effective way to inhibit tumor growth in EGFR resistant cell line tumors in vivo was to block both EGFR and PI3K activity with gefitinib and LY294002.
Figure 5.
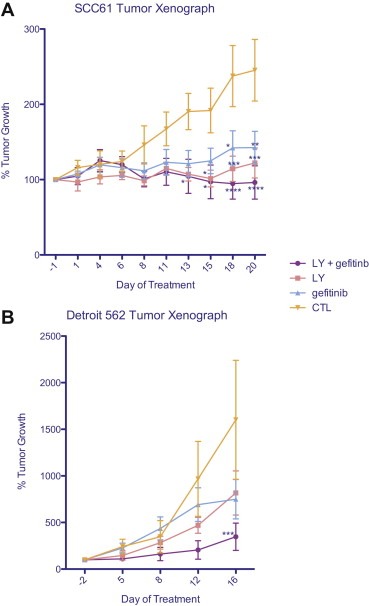
SCC61 or Detroit 562 xenografted tumors respond to treatment by PI3K inhibitor, LY294002 alone, or in combination with gefitinib. % tumor growth is shown. By two‐way ANOVA, the effect of treatment and time is considered significant; SCC61 treatment p < 0.001, time p = 0.0006; Detroit 562 treatment p = 0.0043; time p < 0.0001. By Bonferroni multiple comparison test, the indicated time points are significantly different from control; *p < 0.05, **p < 0.01, ***p < 0.001, ****p < 0.0001.
4. Discussion
Multiple cellular mechanisms can and do confer EGFR inhibitor resistance (Wheeler et al., 2010). Here we show one such mechanism to be EGFR independent AKT activation specifically secondary to PIK3CA mutations. In five of our cell lines AKT phosphorylation was unaffected by EGFR inhibition. Two of these, Detroit 562 and SCC61, were shown to have constitutively activating PIK3CA mutations. Moreover, these cell lines are sensitive to PI3K/AKT inhibitors in vitro and in vivo suggesting that different treatment strategies need to be considered based on molecular phenotype of a tumor. Interestingly, efficacy in the cell lines harboring PIK3CA mutations is still enhanced by EGFR inhibition. A similar additive effect was previously seen in tumor xenografts of Detroit 562 treated with an EGFRi and an inhibitor of mTOR, another protein in the PI3K/AKT pathway (Jimeno et al., 2007). It appears that PIK3CA mutation is a primary driver of survival in these cell lines but EGFR continues to activate other important signaling pathways especially MAP kinase. We thus show PI3K/AKT pathway activation to be a mechanism underlying EGFR inhibitor resistance and these results can now be easily translated to the clinic with the availability of agents that target these proteins.
However, resistance is more complex than these initial results imply. For instance in SCC25 cells, pAKT was readily inhibited by gefitinib but was relatively resistant to the drug implying that EGFR‐independent AKT pathway activation does not account for all mechanisms of resistance. Furthermore, the resistant SCC35 cells express wild‐type PIK3CA, RAS, and BRAF genes (Kuo et al., 2010) but neither pAKT nor pERK are inhibited by gefitinib. CCDN1 is highly amplified in SCC35 cells (Kuo et al., 2010) and whether this promotes resistance to EGFRi, as seen in other models (Kalish et al., 2004), needs to be further elucidated. Clearly there are multiple mechanisms that result in the phenotype of resistance to EGFRi in SCCHN. For instance, EGFR tyrosine kinase family members, HER2 and HER3, show increased protein expression levels in gefitinib‐resistant SCCHN cell lines. Blocking heterodimerization with HER2 increases sensitivity to gefitinib in SCCHN cells, while immunoprecipitation studies suggest HER3 as the link between EGFR and the PI3K/AKT pathway in gefitinib‐sensitive but not resistant NSCLC cell lines. MET amplification is present in some gefitinib‐resistant NSCLC cell lines and blocking MET activity restored gefitinib sensitivity (Wheeler et al., 2010). The Src kinase inhibitor dasatinib decreases HER3 and PI3K/Akt activity, implicating Src a possible downstream pathway to resistance (Wheeler et al., 2009). Upstream of EGFR, G‐protein coupled receptor (GPCR) ligands can promote HNC proliferation through autocrine release of EGFR ligands. But combined blockage of GPCR and EGFR activity increases growth inhibition indicating GPCRs act through EGFR‐dependent and independent pathways (Thomas et al., 2006). Deciphering and selecting therapies based on these mechanisms is the cornerstone of personalized cancer therapeutics.
EGFR amplification was associated with sensitivity to EGFRi. In the three cell lines with amplification, AKT phosphorylation was also inhibited showing that EGFR drives AKT activation in these models. This has been tested in clinical trials but paradoxically EGFR gene copy number does not appear to be predictive of response or benefit from an EGFRi in SCCHN (Cohen et al., 2010, 2005; Pectasides et al., 2011). The discrepancy between preclinical results and tissue analysis could be due to a number of factors. One must remember that the clinical studies that have tested a relationship between EGFR gene copy number and EGFRi efficacy have been in patients with recurrent or metastatic disease (Licitra et al., 2011; Perez et al., 2012; Stewart et al., 2009). As treatment can change gene expression – erlotinib treatment of EGFRi‐resistant cell lines increases EGFR mRNA expression, an effect which is abrogated by cetuximab (Jimeno et al., 2005) – it is likely that tumors in these patients have a complex molecular phenotype with mechanisms that negate the dominance of EGFR amplification on tumor growth.
EGFR inhibitors are now commonly used in SCCHN with little understanding of mechanisms underlying sensitivity or resistance. Since SCCHN, like many cancers, is a heterogeneous disease encompassing multiple molecular phenotypes, several mechanisms are likely operational. We hypothesized that EGFR‐independent AKT activation confers resistance to EGFR inhibitors and found that constitutive AKT activation occurred secondary to genomic perturbations in the PI3K/AKT pathway. These findings need to be validated on tumor tissue and would refine patient selection and treatment decisions with respect to EGFR inhibitors in SCCHN. Moreover, with the recent clinical availability of PI3K/AKT pathway inhibitors, the capability exists to overcome resistance and treat patients with these refractory tumors.
5. Funding
ASCO Career Development Award and NIH CTSA award (UL1 RR024999).
Young Natalie R., Liu Jing, Pierce Carolyn, Wei Tai-Fen, Grushko Tatyana, Olopade Olufunmilayo I., Liu Wanqing, Shen Christine, Seiwert Tanguy Y., Cohen Ezra E.W., (2013), Molecular phenotype predicts sensitivity of squamous cell carcinoma of the head and neck to epidermal growth factor receptor inhibition, Molecular Oncology, 7, doi: 10.1016/j.molonc.2012.11.001.
Contributor Information
Natalie R. Young, Email: nyoung@medicine.bsd.uchicago.edu
Jing Liu, Email: JingX.Liu@utsouthwestern.edu.
Carolyn Pierce, Email: incongruous@hotmail.com.
Tai-Fen Wei, Email: tai-fen@exosomedx.com.
Tatyana Grushko, Email: tgrushko@medicine.bsd.uchicago.edu.
Olufunmilayo I. Olopade, Email: folopade@medicine.bsd.uchicago.edu
Wanqing Liu, Email: liu781@purdue.edu.
Christine Shen, Email: C.Shen@stud.uni-heidelberg.de.
Tanguy Y. Seiwert, Email: tseiwert@medicine.bsd.uchicago.edu
Ezra E.W. Cohen, Email: ecohen@medicine.bsd.uchicago.edu
References
- Barch, M.J. , Knutsen, T. , Spurbeck, J.L. , 1997. The AGT Cytogenetics Laboratory Manual third ed. Lippincott-Raven Publishers; Philadelphia: p. 666 [Google Scholar]
- Bonner, J.A. , Harari, P.M. , Giralt, J. , Azarnia, N. , Shin, D.M. , Cohen, R.B. , Jones, C.U. , Sur, R. , Raben, D. , Jassem, J. , Ove, R. , Kies, M.S. , Baselga, J. , Youssoufian, H. , Amellal, N. , Rowinsky, E.K. , Ang, K.K. , 2006. Radiotherapy plus cetuximab for squamous-cell carcinoma of the head and neck. N. Engl. J. Med. 354, 567–578. [DOI] [PubMed] [Google Scholar]
- Cardinali, M. , Pietraszkiewicz, H. , Ensley, J.F. , Robbins, K.C. , 1995. Tyrosine phosphorylation as a marker for aberrantly regulated growth-promoting pathways in cell lines derived from head and neck malignancies. Int. J. Cancer 61, 98–103. [DOI] [PubMed] [Google Scholar]
- Chen, L.F. , Cohen, E.E. , Grandis, J.R. , 2010. New strategies in head and neck cancer: understanding resistance to epidermal growth factor receptor inhibitors. Clin. Cancer Res. 16, 2489–2495. [DOI] [PMC free article] [PubMed] [Google Scholar]
- Chung, C.H. , Ely, K. , McGavran, L. , Varella-Garcia, M. , Parker, J. , Parker, N. , Jarrett, C. , Carter, J. , Murphy, B.A. , Netterville, J. , Burkey, B.B. , Sinard, R. , Cmelak, A. , Levy, S. , Yarbrough, W.G. , Slebos, R.J. , Hirsch, F.R. , 2006. Increased epidermal growth factor receptor gene copy number is associated with poor prognosis in head and neck squamous cell carcinomas. J. Clin. Oncol. 24, 4170–4176. [DOI] [PubMed] [Google Scholar]
- Chung, C.H. , Parker, J. , Levy, S. , Slebos, R.J. , Dicker, A.P. , Rodeck, U. , 2007. Gene expression profiles as markers of aggressive disease-EGFR as a factor. Int. J. Radiat. Oncol. Biol. Phys. 69, S102–S105. [DOI] [PMC free article] [PubMed] [Google Scholar]
- Cohen, E.E. , 2006. Role of epidermal growth factor receptor pathway-targeted therapy in patients with recurrent and/or metastatic squamous cell carcinoma of the head and neck. J. Clin. Oncol. 24, 2659–2665. [DOI] [PubMed] [Google Scholar]
- Cohen, E.E. , Haraf, D.J. , Kunnavakkam, R. , Stenson, K.M. , Blair, E.A. , Brockstein, B. , Lester, E.P. , Salama, J.K. , Dekker, A. , Williams, R. , Witt, M.E. , Grushko, T.A. , Dignam, J.J. , Lingen, M.W. , Olopade, O.I. , Vokes, E.E. , 2010. Epidermal growth factor receptor inhibitor gefitinib added to chemoradiotherapy in locally advanced head and neck cancer. J. Clin. Oncol. 28, 3336–3343. [DOI] [PMC free article] [PubMed] [Google Scholar]
- Cohen, E.E. , Lingen, M.W. , Martin, L.E. , Harris, P.L. , Brannigan, B.W. , Haserlat, S.M. , Okimoto, R.A. , Sgroi, D.C. , Dahiya, S. , Muir, B. , Clark, J.R. , Rocco, J.W. , Vokes, E.E. , Haber, D.A. , Bell, D.W. , 2005. Response of some head and neck cancers to epidermal growth factor receptor tyrosine kinase inhibitors may be linked to mutation of ERBB2 rather than EGFR. Clin. Cancer Res. 11, 8105–8108. [DOI] [PubMed] [Google Scholar]
- De Roock, W., De Vriendt, V., Normanno, N., Ciardiello, F., Tejpar, S., KRAS, BRAF, PIK3CA, and PTEN mutations: implications for targeted therapies in metastatic colorectal cancer. Lancet Oncol. 12, 594–603. [DOI] [PubMed]
- Fenic, I. , Steger, K. , Gruber, C. , Arens, C. , Woenckhaus, J. , 2007. Analysis of PIK3CA and Akt/protein kinase B in head and neck squamous cell carcinoma. Oncol. Rep. 18, 253–259. [PubMed] [Google Scholar]
- Freier, K. , Joos, S. , Flechtenmacher, C. , Devens, F. , Benner, A. , Bosch, F.X. , Lichter, P. , Hofele, C. , 2003. Tissue microarray analysis reveals site-specific prevalence of oncogene amplifications in head and neck squamous cell carcinoma. Cancer Res. 63, 1179–1182. [PubMed] [Google Scholar]
- Jimeno, A. , Kulesza, P. , Wheelhouse, J. , Chan, A. , Zhang, X. , Kincaid, E. , Chen, R. , Clark, D.P. , Forastiere, A. , Hidalgo, M. , 2007. Dual EGFR and mTOR targeting in squamous cell carcinoma models, and development of early markers of efficacy. Br. J. Cancer 96, 952–959. [DOI] [PMC free article] [PubMed] [Google Scholar]
- Jimeno, A. , Rubio-Viqueira, B. , Amador, M.L. , Oppenheimer, D. , Bouraoud, N. , Kulesza, P. , Sebastiani, V. , Maitra, A. , Hidalgo, M. , 2005. Epidermal growth factor receptor dynamics influences response to epidermal growth factor receptor targeted agents. Cancer Res. 65, 3003–3010. [DOI] [PubMed] [Google Scholar]
- Kalish, L.H. , Kwong, R.A. , Cole, I.E. , Gallagher, R.M. , Sutherland, R.L. , Musgrove, E.A. , 2004. Deregulated cyclin D1 expression is associated with decreased efficacy of the selective epidermal growth factor receptor tyrosine kinase inhibitor gefitinib in head and neck squamous cell carcinoma cell lines. Clin. Cancer Res. 10, 7764–7774. [DOI] [PubMed] [Google Scholar]
- Keniry, M. , Parsons, R. , 2008. The role of PTEN signaling perturbations in cancer and in targeted therapy. Oncogene 27, 5477–5485. [DOI] [PubMed] [Google Scholar]
- Koynova, D.K. , Tsenova, V.S. , Jankova, R.S. , Gurov, P.B. , Toncheva, D.I. , 2005. Tissue microarray analysis of EGFR and HER2 oncogene copy number alterations in squamous cell carcinoma of the larynx. J. Cancer Res. Clin. Oncol. 131, 199–203. [DOI] [PMC free article] [PubMed] [Google Scholar]
- Kozaki, K. , Imoto, I. , Pimkhaokham, A. , Hasegawa, S. , Tsuda, H. , Omura, K. , Inazawa, J. , 2006. PIK3CA mutation is an oncogenic aberration at advanced stages of oral squamous cell carcinoma. Cancer Sci. 97, 1351–1358. [DOI] [PMC free article] [PubMed] [Google Scholar]
- Kuo, W.L. , Liu, J. , Mauceri, H. , Vokes, E.E. , Weichselbaum, R. , Rosner, M.R. , Cohen, E.E. , 2010. Efficacy of the multi-kinase inhibitor enzastaurin is dependent on cellular signaling context. Mol. Cancer Ther. 9, 2814–2824. [DOI] [PMC free article] [PubMed] [Google Scholar]
- Leonard, J.H. , Kearsley, J.H. , Chenevix-Trench, G. , Hayward, N.K. , 1991. Analysis of gene amplification in head-and-neck squamous-cell carcinoma. Int. J. Cancer 48, 511–515. [DOI] [PubMed] [Google Scholar]
- Licitra, L. , Mesia, R. , Rivera, F. , Remenar, E. , Hitt, R. , Erfan, J. , Rottey, S. , Kawecki, A. , Zabolotnyy, D. , Benasso, M. , Storkel, S. , Senger, S. , Stroh, C. , Vermorken, J.B. , 2011. Evaluation of EGFR gene copy number as a predictive biomarker for the efficacy of cetuximab in combination with chemotherapy in the first-line treatment of recurrent and/or metastatic squamous cell carcinoma of the head and neck: EXTREME study. Ann. Oncol. 22, 1078–1087. [DOI] [PMC free article] [PubMed] [Google Scholar]
- Lin, C.J. , Grandis, J.R. , Carey, T.E. , Gollin, S.M. , Whiteside, T.L. , Koch, W.M. , Ferris, R.L. , Lai, S.Y. , 2007. Head and neck squamous cell carcinoma cell lines: established models and rationale for selection. Head Neck 29, 163–188. [DOI] [PubMed] [Google Scholar]
- Liu, J. , Kuo, W.L. , Seiwert, T.Y. , Lingen, M. , Ciaccio, M.F. , Jones, R.B. , Rosner, M.R. , Cohen, E.E. , 2011. Effect of complementary pathway blockade on efficacy of combination enzastaurin and rapamycin. Head Neck 33, 1774–1782. [DOI] [PubMed] [Google Scholar]
- Liu, W. , Wu, X. , Zhang, W. , Montenegro, R.C. , Fackenthal, D.L. , Spitz, J.A. , Huff, L.M. , Innocenti, F. , Das, S. , Cook, E.H. , Cox, N.J. , Bates, S.E. , Ratain, M.J. , 2007. Relationship of EGFR mutations, expression, amplification, and polymorphisms to epidermal growth factor receptor inhibitors in the NCI60 cell lines. Clin. Cancer Res. 13, 6788–6795. [DOI] [PubMed] [Google Scholar]
- Lynch, T.J. , Bell, D.W. , Sordella, R. , Gurubhagavatula, S. , Okimoto, R.A. , Brannigan, B.W. , Harris, P.L. , Haserlat, S.M. , Supko, J.G. , Haluska, F.G. , Louis, D.N. , Christiani, D.C. , Settleman, J. , Haber, D.A. , 2004. Activating mutations in the epidermal growth factor receptor underlying responsiveness of non-small-cell lung cancer to gefitinib. N. Engl. J. Med. 350, 2129–2139. [DOI] [PubMed] [Google Scholar]
- Nanda, R. , 2007. Targeting the human epidermal growth factor receptor 2 (HER2) in the treatment of breast cancer: recent advances and future directions. Rev. Recent Clin. Trial. 2, 111–116. [DOI] [PubMed] [Google Scholar]
- Paez, J.G. , Janne, P.A. , Lee, J.C. , Tracy, S. , Greulich, H. , Gabriel, S. , Herman, P. , Kaye, F.J. , Lindeman, N. , Boggon, T.J. , Naoki, K. , Sasaki, H. , Fujii, Y. , Eck, M.J. , Sellers, W.R. , Johnson, B.E. , Meyerson, M. , 2004. EGFR mutations in lung cancer: correlation with clinical response to gefitinib therapy. Science 304, 1497–1500. [DOI] [PubMed] [Google Scholar]
- Pectasides, E. , Rampias, T. , Kountourakis, P. , Sasaki, C. , Kowalski, D. , Fountzilas, G. , Zaramboukas, T. , Rimm, D. , Burtness, B. , Psyrri, A. , 2011. Comparative prognostic value of epidermal growth factor quantitative protein expression compared with FISH for head and neck squamous cell carcinoma. Clin. Cancer Res. 17, 2947–2954. [DOI] [PubMed] [Google Scholar]
- Pedrero, J.M. , Carracedo, D.G. , Pinto, C.M. , Zapatero, A.H. , Rodrigo, J.P. , Nieto, C.S. , Gonzalez, M.V. , 2005. Frequent genetic and biochemical alterations of the PI 3-K/AKT/PTEN pathway in head and neck squamous cell carcinoma. Int. J. Cancer 114, 242–248. [DOI] [PubMed] [Google Scholar]
- Perez, C.A. , Song, H. , Raez, L.E. , Agulnik, M. , Grushko, T.A. , Dekker, A. , Stenson, K. , Blair, E.A. , Olopade, O.I. , Seiwert, T.Y. , Vokes, E.E. , Cohen, E.E.W. , 2012. Phase II study of gefitinib adaptive dose escalation to skin toxicity in recurrent or metastatic squamous cell carcinoma of the head and neck. Oral Oncology 48, 887–892. [DOI] [PubMed] [Google Scholar]
- Pisani, P. , Bray, F. , Parkin, D.M. , 2002. Estimates of the world-wide prevalence of cancer for 25 sites in the adult population. Int. J. Cancer 97, 72–81. [DOI] [PubMed] [Google Scholar]
- Ramirez, J. , Mirkov, S. , Zhang, W. , Chen, P. , Das, S. , Liu, W. , Ratain, M.J. , Innocenti, F. , 2008. Hepatocyte nuclear factor-1 alpha is associated with UGT1A1, UGT1A9 and UGT2B7 mRNA expression in human liver. Pharmacogenomic. J. 8, 152–161. [DOI] [PubMed] [Google Scholar]
- Ray, M. , Salgia, R. , Vokes, E.E. , 2009. The role of EGFR inhibition in the treatment of non-small cell lung cancer. Oncologist 14, 1116–1130. [DOI] [PubMed] [Google Scholar]
- Rogers, S.J. , Box, C. , Chambers, P. , Barbachano, Y. , Nutting, C.M. , Rhys-Evans, P. , Workman, P. , Harrington, K.J. , Eccles, S.A. , 2009. Determinants of response to epidermal growth factor receptor tyrosine kinase inhibition in squamous cell carcinoma of the head and neck. J. Pathol. 218, 122–130. [DOI] [PubMed] [Google Scholar]
- Sheu, J.J. , Hua, C.H. , Wan, L. , Lin, Y.J. , Lai, M.T. , Tseng, H.C. , Jinawath, N. , Tsai, M.H. , Chang, N.W. , Lin, C.F. , Lin, C.C. , Hsieh, L.J. , Wang, T.L. , Shih Ie, M. , Tsai, F.J. , 2009. Functional genomic analysis identified epidermal growth factor receptor activation as the most common genetic event in oral squamous cell carcinoma. Cancer Res. 69, 2568–2576. [DOI] [PubMed] [Google Scholar]
- Siena, S. , Sartore-Bianchi, A. , Di Nicolantonio, F. , Balfour, J. , Bardelli, A. , 2009. Biomarkers predicting clinical outcome of epidermal growth factor receptor-targeted therapy in metastatic colorectal cancer. J. Natl. Cancer Inst. 101, 1308–1324. [DOI] [PMC free article] [PubMed] [Google Scholar]
- Stewart, J.S. , Cohen, E.E. , Licitra, L. , Van Herpen, C.M. , Khorprasert, C. , Soulieres, D. , Vodvarka, P. , Rischin, D. , Garin, A.M. , Hirsch, F.R. , Varella-Garcia, M. , Ghiorghiu, S. , Hargreaves, L. , Armour, A. , Speake, G. , Swaisland, A. , Vokes, E.E. , 2009. Phase III study of gefitinib compared with intravenous methotrexate for recurrent squamous cell carcinoma of the head and neck [corrected]. J. Clin. Oncol. 27, 1864–1871. [DOI] [PubMed] [Google Scholar]
- Stransky, N. , Egloff, A.M. , Tward, A.D. , Kostic, A.D. , Cibulskis, K. , Sivachenko, A. , Kryukov, G.V. , Lawrence, M.S. , Sougnez, C. , McKenna, A. , Shefler, E. , Ramos, A.H. , Stojanov, P. , Carter, S.L. , Voet, D. , Cortes, M.L. , Auclair, D. , Berger, M.F. , Saksena, G. , Guiducci, C. , Onofrio, R.C. , Parkin, M. , Romkes, M. , Weissfeld, J.L. , Seethala, R.R. , Wang, L. , Rangel-Escareno, C. , Fernandez-Lopez, J.C. , Hidalgo-Miranda, A. , Melendez-Zajgla, J. , Winckler, W. , Ardlie, K. , Gabriel, S.B. , Meyerson, M. , Lander, E.S. , Getz, G. , Golub, T.R. , Garraway, L.A. , Grandis, J.R. , 2011. The mutational landscape of head and neck squamous cell carcinoma. Science 333, 1157–1160. [DOI] [PMC free article] [PubMed] [Google Scholar]
- Temam, S. , Kawaguchi, H. , El-Naggar, A.K. , Jelinek, J. , Tang, H. , Liu, D.D. , Lang, W. , Issa, J.P. , Lee, J.J. , Mao, L. , 2007. Epidermal growth factor receptor copy number alterations correlate with poor clinical outcome in patients with head and neck squamous cancer. J. Clin. Oncol. 25, 2164–2170. [DOI] [PubMed] [Google Scholar]
- Thomas, S.M. , Bhola, N.E. , Zhang, Q. , Contrucci, S.C. , Wentzel, A.L. , Freilino, M.L. , Gooding, W.E. , Siegfried, J.M. , Chan, D.C. , Grandis, J.R. , 2006. Cross-talk between G protein-coupled receptor and epidermal growth factor receptor signaling pathways contributes to growth and invasion of head and neck squamous cell carcinoma. Cancer Res. 66, 11831–11839. [DOI] [PubMed] [Google Scholar]
- Vermorken, J.B. , Remenar, E. , van Herpen, C. , Gorlia, T. , Mesia, R. , Degardin, M. , Stewart, J.S. , Jelic, S. , Betka, J. , Preiss, J.H. , van den Weyngaert, D. , Awada, A. , Cupissol, D. , Kienzer, H.R. , Rey, A. , Desaunois, I. , Bernier, J. , Lefebvre, J.L. , 2007. Cisplatin, fluorouracil, and docetaxel in unresectable head and neck cancer. N. Engl. J. Med. 357, 1695–1704. [DOI] [PubMed] [Google Scholar]
- Wheeler, D.L. , Dunn, E.F. , Harari, P.M. , 2010. Understanding resistance to EGFR inhibitors-impact on future treatment strategies. Nat. Rev. Clin. Oncol. 7, 493–507. [DOI] [PMC free article] [PubMed] [Google Scholar]
- Wheeler, D.L. , Iida, M. , Kruser, T.J. , Nechrebecki, M.M. , Dunn, E.F. , Armstrong, E.A. , Huang, S. , Harari, P.M. , 2009. Epidermal growth factor receptor cooperates with Src family kinases in acquired resistance to cetuximab. Cancer Biol. Ther. 8, 696–703. [DOI] [PMC free article] [PubMed] [Google Scholar]