

Abstract
Detection and characterization of genomic structural variation are important for understanding the landscape of genetic variation in human populations and in complex diseases such as cancer. Recent studies demonstrate the feasibility of detecting structural variation using next-generation, short-insert, paired-end sequencing reads. However, the utility of these reads is not entirely clear, nor are the analysis methods under which accurate detection can be achieved. The algorithm BreakDancer predicts a wide variety of structural variants including indels, inversions, and translocations. We examined BreakDancer's performance in simulation, comparison with other methods, analysis of an acute myeloid leukemia sample, and the 1,000 Genomes trio individuals. We found that it substantially improved the detection of small and intermediate size indels from 10 bp to 1 Mbp that are difficult to detect via a single conventional approach.
Introduction
Genomic structural variation is commonly considered to be any DNA sequence alteration other than a single nucleotide substitution1. Instances of structural variants in germ and somatic cells contribute respectively to heritable genetic diseases2,3 and cancers4-6. Numerous types of structural variation exist, including indels, copy number variants (CNVs), inversions, and translocations. Many inherited CNVs (> 30 kb) have been discovered using array comparative genomic hybridization (CGH)7 and high density SNP arrays8. Alignment of DNA sequences from different sources has been used to identify small or balanced rearrangements not detectable by arrays9,10. Recent sequencing and assembly of individual genomes have revealed larger numbers of structural variants than originally expected, especially in the smaller size range (< 1 kb)11,12. However, precise characterization and genotyping of structural variants are still difficult and expensive due to limitations in sequencing technology and detection methods.
Much of the recent advance in structural variation detection can be attributed to next-generation sequencing (NGS) instruments13, which have dramatically economized paired-end, whole-genome sequencing. One widely used instrument, the Illumina Genome Analyzer (GA) II, employs DNA fragments between 100 and 500 bp and requires little input DNA (∼1 μg) for sufficient genome-wide coverage. Recent whole genome resequencing projects14,15 have obtained paired end sequence coverage of 20-40 × and have predicted thousands of structural variants using end sequencing profiling (ESP) methods that discerns variants via perceived anomalies in the separation lengths or orientation of aligned read pairs16,17.
Many substantive issues regarding the analysis of paired-end data, however, remain unresolved. Open questions include whether the procedures and heuristics established for fosmids and BACs can be extrapolated to short inserts, how the expected false positive and negative rates vary with coverage, insert size, and read length, and how prediction confidence should be established. As NGS data begin to dominate whole genome resequencing projects, there is a pressing need both to obtain precise answers and to provide practical solutions for data analysis.
Here, we address these questions using a combination of computational and experimental approaches. Our software package, collectively called BreakDancer consists of two complementary algorithms. The first, BreakDancerMax, provides genome-wide detection of five types of structural variants: deletions, insertions, inversions, intra-chromosomal and inter-chromosomal translocations from one or a pool of DNA samples sequenced by GA II (Fig .1). The second, BreakDancerMini, focuses on detecting small indels (typically between 10-100 bp) that are not routinely detected by BreakDancerMax. Together, they provide sensitive and accurate detection for a wide variety of structural variants, as demonstrated in both simulation and real data analysis14,18,19.
Figure 1.
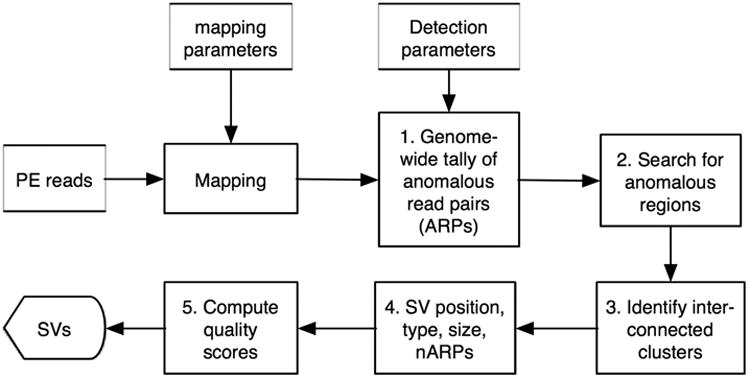
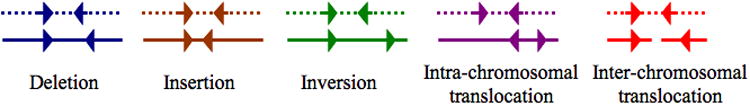
Overview of BreakDancer algorithm. (a) The workflow. (b) Five types of anomalous read pairs recognized by BreakDancerMax. A pair of arrows represents the location and the orientation of a read pair. A dotted line represents a chromosome in the subject genome. A solid line represents a chromosome in the reference genome.
Results
Simulation
To quantify BreakDancer's performance with respect to different parameter settings, we produced synthetic data based on 844 structural variants identified on chromosome 17 of J. Craig Venter's genome11, which include 425 deletions, 415 insertions, and 4 inversions ranging from 20 bp to 7953 bp. We excluded indels shorter than 20 bp since they are relatively easy to detect via Smith-Waterman algorithm (Supplementary Fig. 1). Many variants in this set occur in repetitive regions that are difficult to map or assemble (Supplementary Notes).
We considered a deletion or an inversion as detected if it overlapped 50% reciprocally with a predicted variant. We considered an insertion as detected if its single breakpoint overlaps a predicted variant.
We simulated 50 bp paired-end reads from the chromosome 17 nucleotide sequence of Venter's genome using MAQ-0.7.120 with normally distributed insert size of a 200 bp mean and a 20 bp standard deviation (s.d.). We analyzed the set of reads that were confidently mapped (MAQ mapping quality > 10) using BreakDancerMax at a separation threshold of 3 s.d. Among the 365 (43.2%) variants whose flanking regions contain 2 or more anomalously mapped reads at 100 ×, 324 (89%) were detected with a 1.48% false positive rate (FPR) including 147 that are shorter than 60 bp (Fig. 2 and Supplementary Table 1).
Figure 2.
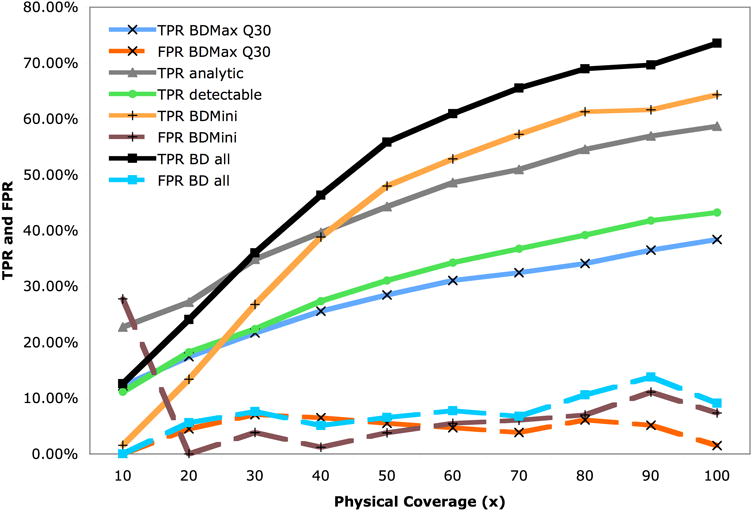
Performance of BreakDancer in simulation. TPR and FPR of BreakDancerMax (BDMax) at the confidence threshold of Q ≥ 30 are shown. TPR analytic refers to the percent of variants that can hypothetically be detected by BDMax under an analytic model (Online Methods). TPR detectable is the percent of variants hose flanking regions (300 bp both to the left and to the right) contain 2 or more confidently mapped ARPs in the MAQ alignment. The performance of BreakDancerMini (BDMini) is characterized by its TPR and FPR. The combined performance (BD all) is obtained by merging the results of these to programs.
The 324 detected SVs included 214 deletions, 109 insertions, and 3 inversions with varying true positive rate (TPR) in different size ranges and coverages (Online Methods and Supplementary Fig. 2). Of the 214 deletions, 203 (95%) were correctly predicted as deletions with accurate sizes (Pearson's r = 0.92) (Supplementary Fig. 3a). In comparison, only 72/109 (66%) known insertions were correctly predicted as insertions with less accurate sizes (r = 0.65) and breakpoints (Supplementary Fig. 3a,b). Longer deletions were more accurately predicted in terms of both size and breakpoint.
The confidence score we derived to prioritize BreakDancerMax predictions (Online Methods) demonstrated improved statistical properties when compared to simply using the number of anomalously mapped read pairs (ARPs), which remains the de facto standard metric21-23. It provides finer distinction among variants that are supported by identical number of ARPs (Supplementary Fig. 4). It also reduces the result's dependency on the separation threshold and leads to relatively consistent TPRs and FPRs. (Supplementary Fig. 5).
We ran BreakDancerMini on the same data and required the anomalous regions having two-sample Kolmogorov–Smirnov test statistics Dnn′ ≥ 2.3 (Online Methods and Supplementary Fig. 6). We observed dramatic improvement in detecting small indels (Fig. 2). At 100 × physical coverage, BreakDancerMini detected 543 (64.3%) variants with a 7.3% FPR, including 407 (75.0%) that are shorter than 60 bp. We merged the indels (< 100 bp) detected by BreakDancerMini with those detected by BreakDancerMax and obtained a non-redundant set of 683 variants, including 365 deletions, 290 insertions, and 21 inversions. Altogether, 621 (74%) of the known variants were detected with a 9.1% FPR.
We repeated this simulation under identical conditions but included indels between 10 and 20 bp. On this set, BreakDancerMax alone only detected 24% of the 1897 known variants with a 7% FPR. However, in combination with BreakDancerMini, we detected 68.0% with a 10.3% FPR, 62.6% of which are between 10 and 20 bp. The size of indels appeared to be reasonably accurately predicted throughout the range (Supplementary Fig. 7a,b).
Comparison with other methods
We compared BreakDancer with to recently published structural variant detection tools VariationHunter24 and MoDIL25. Noticeably, these tools both use a different mapping algorithm, MrFast (http://mrfast.sourceforge.net/) than BreakDancer. MoDIL and BreakDancerMini both utilize the Kolmogorov–Smirnov test26, but differ in many algorithmic details.
We ran BreakDancerMax and BreakDancerMini on the obtained MAQ map files of the Yoruban genome14 (Online Methods) with a conservative threshold of 4 s.d. for BreakDancerMax, Dnn′ ≥ 2.3. for BreakDancerMini and MAQ mapping quality > 10. BreakDancerMax returned a set of 9,202 deletions, 4,901 insertions, and 665 inversions while BreakDancerMini returned a set of 21,433 deletions, 17,029 insertions that are shorter than 100 bp. After merging them by position, we obtained a non-redundant set of 27,092 deletions, 19,305 insertions, and 665 inversions.
We examined the overlap between the predicted variants with those obtained through alternative approaches (Table 1). Altogether, BreakDancer detected a total of 59/92 (64.1%) large fosmid deletions21, which is comparable to VariationHunter under identical conditions24. Among the deletions predicted by BreakDancerMini, 21.1% overlapped at least 1 bp with 4528 known deletion polymorphisms21, 34.4% with dbSNP v129, and 43.6% with the intra-contig deletions produced by Beijing Genome Institute (BGI) through whole genome de novo assembly (unpub. data). Among the insertions predicted by BreakDancerMini, 16.9% overlapped with 2876 known insertion polymorphisms21, 29.8% with dbSNP v129, and 22.8% with BGI insertions. Indels < 10bp in the dbSNP and in the BGI sets were excluded in the comparison. All these percentages are substantially higher than those obtained by VariationHunter or MoDIL. The variant sizes estimated by BreakDancerMini were highly correlated with the deletion or insertion polymorphisms21 (r > 0.8).
Table 1.
Comparison of BreakDancer with other tools. Structural variants predicted by BreakDancer on the Yoruban (NA18507) sample were compared to sets of variants discovered by alternative approaches14,21. ESP (large structural variants that were found by analyzing discordant fosmid clone-end alignment), DIP (small deletion/insertion polymorphisms found as gaps in the paired alignment between the fosmid end sequences and the reference). The MPSV weighted, MPSV unweighted, Probabilistic, and MoDIL refer to sets of SVs predicted by VariationHunter24 and by MoDIL25 respectively. Call sets for these tools were downloaded from http://compbio.cs.sfu.ca/strvar.htm and http://compbio.cs.toronto.edu/modil/. The dbSNP v129 set refers to indels that are 10 bp or longer in dbSNP version 129. The BGI set refers to 10 bp or longer intra-contig indels produced by Beijing Genome Institute through whole genome de novo assembly on the same sample. The Strict* criteria require the length of the intersection between the validated and the predicted variants to overlap at least 50% of the length of the union of the intervals, or the predicted variants to be entirely encompassed by the fosmid interval. Before the slash sign (/) are the numbers of overlapping variants, after are the number of predictions in the corresponding category.
| Type | Deletion | Deletion | Deletion | Deletion | Deletion | Insertion | Insertion | Insertion | Inversion |
|---|---|---|---|---|---|---|---|---|---|
| Method | ESP | DIP | Assembly | ESP | DIP | Assembly | ESP | ||
| From | ref. 21 | ref. 21 | dbSNP v129 | BGI | ref. 14 | ref. 21 | dbSNP v129 | BGI | ref. 21 |
| Size filtering | >=10bp | >=10bp | >=10bp | >=10bp | |||||
| Reported | 92 | 116,395 | 82,956 | 107,760 | 5,704 | 107,458 | 82,956 | 41,134 | 13 |
| Criteria | strict* | 1bp | 1bp | 1bp | 1bp | 1bp | 1bp | 1bp | 1bp |
| BreakDancerMax | 55/9,202 | 955/9,202 | 2,039/9,202 | 3,123/9,202 | 5,015/9,202 | 339/4,901 | 903/4,901 | 827/4,901 | 2/665 |
| BreakDancerMini | 21/21,433 | 4528/21,433 | 7379/21,433 | 9,344/21,433 | 1,598/21,433 | 2,876/17,029 | 5,083/17,029 | 3,878/17,029 | N/A |
| BreakDancer merged | 59/27,092 | 4970/27,092 | 7998/27,092 | 10,792/27,092 | 5,064/27,092 | 2,983/19,305 | 5,336/19,305 | 4,104/19,305 | 2/655 |
| MPSV weighted | 57/8,959 | 711/8,959 | 1332/8,959 | 2,246/8,959 | 4,819/8,959 | 121/5,575 | 192/5,575 | 192/5,575 | 2/504 |
| MPSV unweighted | 55/7,599 | 588/7,599 | 1022/7,599 | 1,835/7,599 | 4,537/7,599 | 70/3,772 | 88/3,772 | 93/3,772 | 4/433 |
| Probabilistic | 58/8,537 | 703/8,537 | 1217/8,537 | 2,061/8,537 | 4,703/8,537 | 100/7,142 | 124/7,142 | 131/7,142 | 1/181 |
| MoDIL | 20/13,147 | 622/13,147 | 967/13,147 | 1,162/13,147 | 540/13,147 | 282/3,981 | 687/3,981 | 571/3,981 | N/A |
In addition, 54.3% of the deletions predicted by BreakDancerMax overlapped with 87.7% of the deletions originally reported14. Both percentages are higher in comparison to those obtained by VariationHunter24, possibly because BreakDancerMax uses algorithms similar to the in the original article14.
Detecting variants in an AML sample
We performed variant detection using data obtained from the tumor and the normal samples of an individual with cytogenetically normal AML19. we obtained 21 × paired-end haploid coverage for both the tumor and the normal genomes, corresponding to 63.5 × and 39.9 × physical coverage, respectively.
We jointly analyzed data from six libraries using BreakDancerMax with library specific separation thresholds and MAQ mapping quality > 35. At a confidence score threshold of Q ≥ 60, 7087 variants were predicted, including 3170 deletions, 1570 insertions, 1382 inversions, and 965 intra-chromosomal translocations (Fig. 2 and Supplementary Table 2). 46.4% of these deletions overlapped (50% interval) with known inherited CNVs in the database of genomic variants v5 (DGV). The percent of overlap became 5-8% higher hen culling variants based on the confidence scores instead of the number of ARPs alone (Supplementary Fig. 8). A recent study using Affymetrix 6.0 array identified 116 inherited CNVs on the same individual27, 37 (31.90%) of which overlap with our predictions. These overlapping CNVs range from 131 bp to 1.5 Mbp with no noticeable bias in size.
We extracted variants that were detected only in the tumor and derived a set of 223 putative somatic variants including 100 deletions, 67 insertions (< 100 bp), 22 inversions, and 34 intra-chromosomal translocations. We attempted a local assembly for each of the 167 indels, using the reads mapped to the predicted variant interval (Methods). We were able to call variants from the assemblies in 153 of the 167 instances, with 100 confirming the variants (79 both in the tumor and in the normal, 17 only in the tumor, and 4 only in the normal).
We submitted the set of 167 indels for experimental validation (Methods). 110 (69 deletions and 41 insertions) were validated both in the tumor and in the normal, 31 were not validated either in the tumor or in the normal, and 26 were not called due to lo data quality (Supplementary Table 3). This suggested a 78% validation rate, excluding the no-calls. Noticeably, 16 of the 20 deletions that were not validated received a confidence score below 80 (Supplementary Fig. 9). Therefore, the validation rate became 89% at Q ≥ 80. The size of the deletions determined by BreakDancerMax shoed good correlation with those determined independently from the validation experiment (r = 0.867).
Local assembly clearly improved overall accuracy in that 79 variants were correctly identified in both the tumor and the normal. Although the false negative rate of the assembly calls as relatively high: 26 (49%) of the 53 non-variant calls were validated in the experiment, the FPR as fairly lo: only six (6%) variant calls could not be validated. This observation suggested using assembly in a confirmatory role, rather than as a mechanism to limit false negatives. The assembly also improved the size estimation of small indels (Fig. 3).
Figure 3.
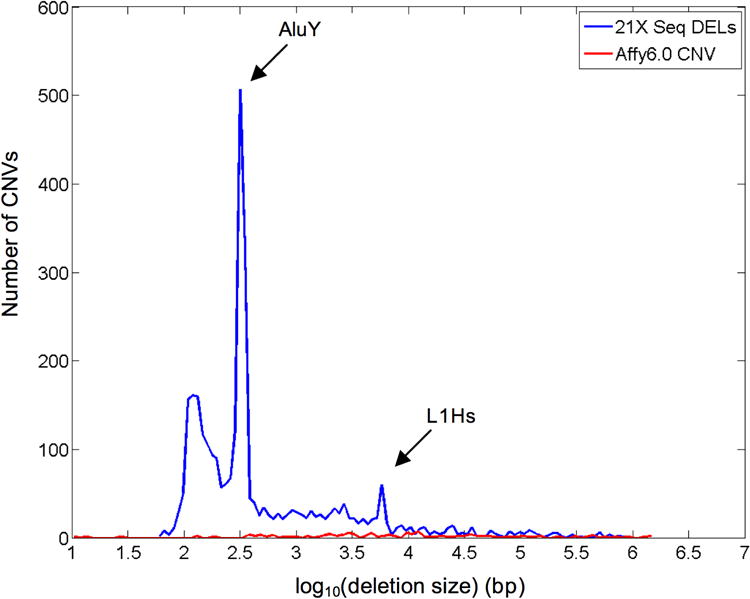
Size distribution of deletions detected in an AML genome. 3170 deletions were detected from the sequence data by BreakDancerMax ranging from 58 bp to 959,498 bp. To signature peaks at 300 bp and at 6,000 bp correspond respectively to the AluY and the L1Hs retro-transposon. In comparison, only 116 inherited CNVs were detected using Affymetrix 6.0 array on this sample.
Among the identified insertions, three appeared to be ancient alleles that are closer to chimp than to the human reference. In at least 4 inherited deletions we identified, there are stretches of 10-20 bp AT-rich microhomologous sequences inserted between the deletion breakpoints, likely formed by transposons hen they inserted into the genome.
We were only able to obtain high quality validation data for 13 inversions and 6 intra-chromosomal translocations. Of these, four inversions and to intra-chromosomal translocations were validated both in the tumor and in the normal (Supplementary Fig. 10a-f).
Detecting variants in a 1,000 Genomes dataset
We applied BreakDancerMax to the 1,000 Genomes Project18 data and compared our deletion calls with those that were previously known via fosmid ESP21 and array CGH28 on chromosome 5 of the CEU and the YRI trio individuals.
Each CEU individual had reads from to paired-end libraries with ∼15 × physical coverage (Supplementary Table 4). At the threshold of 4 s.d., mapping quality > 35 and Q ≥ 40, 125 deletions were detected in NA12878, 79 (63%) of which overlap DGV. Around 25-35% of known deletions were present in our calls (Supplementary Table 5). This percentage increased substantially to 35%-45% after lowering mapping quality threshold to 10, while the DGV concordance dropped to 54%. Reducing the separation distance cutoff from 4 s.d. to 3 s.d. increased the total number of Q ≥ 40 predictions by about 20%, but did not increase the numbers of known variants that were detected. Interestingly, 40-57% of known variants were detected when we jointly analyzed reads from all three individuals with library specific separation thresholds. There as a substantial overlap among the predicted deletions of the trio individuals: 88/120 (73%) deletions in the father (NA12891) and 98/133 (74%) in the mother (NA12892) were independently detected in the child (NA12878).
We repeated the same set of analyses using data from the YRI trio individuals. Each individual had reads from to paired-end libraries with about 50 × to 70 × physical coverage (Supplementary Table 4). At the threshold of 4 s.d., mapping quality > 35 and Q ≥ 40, 246 deletions were detected in NA19240, 123 (50%) of which overlapped DGV. Around 50%-100% known deletions were present in our calls (Supplementary Table 6). No additional known variants were detected after lowering mapping quality threshold to 10 or by performing pooled analysis. There as a substantial overlap among the deletions of the trio individuals: 168/235 (72%) deletions in the father (NA19239) and 126/164 (77%) in the mother (NA19238) were also independently detected in the child (NA19240).
In contrast to these substantial familial overlaps, the degree of overlap between individuals in different families as noticeably lower (31-37%).
Discussion
Our study indicates that BreakDancer has achieved accurate and sensitive structural variant discovery based on short-insert paired-end read mapping. The pooled analysis framework implemented in BreakDancer produces unified segmentation across pooled samples and libraries. In a family-/population-based study, it enhances the detection of common variants, as demonstrated in our analysis of the CEU trio. In a tumor-normal paired study, it improves the specificity of somatic variant prediction through effective elimination of inherited variants. This is particularly important hen discovery power is not matched in the paired genomes due to different insert size.
It is possible to further improve BreakDancer's performance by systematically integrating more information in confidence scoring. For example, it may be beneficial to incorporate the mapping quality rather than applying a fixed threshold. Moreover, there is evidence suggesting that integrating read depth may help improve segmentation and genotyping29, although an effective integration method is yet to be discovered. Our goal is to derive phred-style quality scores that accurately predict the error probability.
Some types of structural variants, such as inversions and translocations, appeared to be more difficult to detect and validate. Many putative predictions overlapped with regions of tandem or inverted repeat and required further sequence analysis and filtering, or the use of additional longer reads and longer inserts. Nonetheless, BreakDancer as able to identify bona fide instances of inversions and intra-chromosomal translocations in this study, and somatic inter-chromosomal translocations in our study of glioblastoma multiforme, ovarian, and other AML samples (data not shown).
The algorithms we implemented in BreakDancer are generic and can potentially be expanded to analyze data of different insert sizes or produced by different sequencing technologies. It can also be expanded to analyze paired-end data obtained from mRNA sequencing to identify instances of gene fusion and alternative splicing.
Methods
BreakDancerMax
Our first algorithm BreakDancerMax starts with the map files produced by MAQ20 (Fig. 1a). Read pairs mapped to a reference genome with sufficient mapping quality are independently classified into six types (Fig. 1b): normal, deletion, insertion, inversion, intra-chromosomal translocation, and inter-chromosomal translocation. This classification process is based on 1) the separation distance and alignment orientation between the paired reads, 2) the user-specified threshold, and 3) the empirical insert size distribution estimated from the alignment of each library contributing genome coverage. The algorithm then searches for genomic regions that anchor significantly more anomalous read pairs (ARPs) than expected on average. A putative structural variant is derived from the identification of one or more regions that are interconnected by at least to ARPs. A confidence score is estimated for each variant based on a Poisson model that takes into consideration the number of supporting ARPs, the size of the anchoring regions and the coverage of the genome. The dominant type of associated ARPs in a particular region determines the type of structural variant. The start and the end coordinates are defined as the inner boundaries of the constituent regions that are closest to the suspected breakpoints, while the size is estimated by subtracting the mean insert size from the average spanning distance in each library and then averaging across libraries.
Confidence score estimation
It is important to derive confidence scores that quantify the underlying error probabilities of the predicted structural variants. The accuracy of the score depends on many factors, for example, whether the set of reads represents an unbiased sampling of the genome and all alleles, whether the reads are mapped to correct locations, and whether the amount of observed evidence is significant.
One of the primary signals for the presence of a structural variant is the clustering of ARPs. Therefore, it is important to measure the degree of clustering from the perspective of both depth and breadth. We assume that under the null hypothesis of no variant, the genomic location of one particular type of insert is uniformly distributed14. For studies that define more than one insert type, the number of inserts at a particular location forms a mixture Poisson distribution with each mixture component representing one of the insert types. The statistic that summarizes the degree of clustering of a particular insert type is the probability of having more than the observed number of inserts in a given region:
Where ni denotes a Poisson random variable with mean equal to λi, i the type of the insert, and ki the number of observed type i inserts. The estimation of λi is straightforward based on uniform assumption:
Where s represents the cumulative size of the regions that the ARPs anchor to, Ni the total number of type i inserts in the entire data set, and G the length of the reference genome. Ni is counted directly from the data without assuming any form of insert size distribution. To detect indels, one could define three types of inserts: long, medium, and short defined by pre-determined thresholds. The task of indel detection is to find deletions from regions that contain significantly more long inserts and insertions from regions that contain significantly more short-inserts.
This probabilistic scoring system can conveniently integrate information from multiple libraries from the same or different individuals using Fisher's method30 assuming that the m libraries are produced independently:
Where χ2 denotes a chi-square distribution of 2m degree of freedom and Pj the P value obtained from the jth library.
This makes it straightforward to compute a combined P value from a set of variable insert-size libraries or from one or multiple individuals to fully harness the statistical power of the pooled data. For convenience of representation, we convert the combined P value to phred scale using:
However it should be noted that this Q score is not necessarily a phred quality score although they should have good correlation.
An analytic model of true positive rate (TPR) in simulation
Assuming that all the reads can be confidently mapped and that the ARPs cannot intersect with the variant breakpoint, we can analytically estimate the number of ARPs that a known structural variant may possess
Where G(·) represents the insert size distribution function with mean μ and standard deviation σ, size of the deletions θd, size of the insertions θi, threshold that defines the long inserts cd, threshold that defines the short inserts ci, read length l, physical coverage R, and allele frequency a.
We can compute the TPR in our simulation using this analytic model that summarizes information about the insert size, read length, coverage, and the variant size (Fig. 1). with a 200 bp insert library (s.d. 20 bp and read length 50 bp), 493 (58.69%) of 844 known variants (≥ 20 bp) on the chromosome 17 of J. Craig Venter's genome would possess 2 or more ARPs (≥ 3 s.d.) at 100 × physical coverage. This analytic TPR approaches an asymptote at 180 × here all deletions are detected and at 220 × here 307 (74%) of 415 insertions are detected (Supplementary Table 7). For a 400 bp insert library (s.d. 40 bp and read length 50 bp), the analytic TPR approaches an asymptote at 430 × here all deletions are detected and at 470 × here 87.5% of insertions are detected (Supplementary Table 8).
We can explicitly characterize the analytic TPR as a function of variant size and coverage based on the Poisson coverage model:
Where P(·) represents the Poisson distribution function.
With these formulas, it can be shown that insertions and deletions shorter than 40 bp are difficult to detect using the above 200 bp insert library due to the 20 bp standard deviation. Deletions longer than 60 bp took about 30 × coverage to reach an asymptote and those longer than 100 bp took only 20 × (Supplementary Fig. 11a). Insertions ranging from 60 bp to 80 bp were relatively easier to detect (Supplementary Fig. 11b), but those longer than 100 bp cannot be detected at all, as their detection is limited by the insert size and read length of DNA fragments.
BreakDancerMini
Our second algorithm BreakDancerMini analyzes the normally mapped read pairs that were ignored by BreakDancerMax. A genomic region of size equivalent to the mean insert size is classified as either normal or anomalous based on a sliding indo test that examines the difference of the separation distances between read pairs that are mapped within the indo versus those in the entire genome. Similar to BreakDancerMax, a putative structural variant can be derived from the anomalous genomic regions that are interconnected by at least to common read pairs. A confidence score is assigned based on the significance value of the sliding indo test. The start and the end coordinates are decided as the outer boundaries of the constituent regions, while the size is estimated using the same approach as BreakDancerMax.
The sliding Window test
We applied a sliding indo test to identify anomalous regions that contain read pairs significantly different from the entire genome. By default, BreakDancerMini using a fixed indo size of w = μ + 3σ - 2l bp and a step size of 1 bp, here μ and σ are the mean and the standard deviation estimated from the separation distance of normally and confidently (mapping quality > 40) mapped read pairs, and l is the average read length. A to-sample Kolmogorov–Smirnov (KS) test statistic26
is computed for each indo, here Fn(x) and Fn′(x) are the empirical cumulative distribution function (ECDF) estimated from the normal reads in the indo and in the entire genome respectively, and n and n′ are the number of reads in each set; x is the separation distance from 1 bp to a maximum size (∼300 bp); sup denotes the supremum of the set. Obviously, Dnn′ objectively measures the difference between the to ECDFs in terms of both location and shape. To model alignment orientation, we computed to statistics D+nn′ and D-nn′ per indo using reads that are mapped to the plus and the minus strands respectively. A genomic region is classified as anomalous in either the plus or the minus orientation if the corresponding KS statistic exceeds a user-selected threshold. Overlapping anomalous regions in the same orientation are filtered and only the highest scoring one is kept. For small indels, the anomalous regions that support the same variant are required to be in the opposite orientations. In principle, this approach works with any insert size distribution and does not require any predetermined cutoff on the separation distance.
Variant calling based on local assembly
A local assembly of the breakpoints within a suspected variant region can confirm the existence of the structural variant, precisely define the breakpoint locations, and determine any inserted sequences that may be present. In our AML study, we assembled reads mapped by MAQ to within 500 bp of the predicted variant boundaries, including unaligned reads hose mates mapped within the region using both Velvet31 and phrap. we found that using more than one assembly algorithm increased the chance of assembling a structural variant. If the derived contig sequences cumulatively covered over 75% of the region from which the reads were extracted, we aligned the contigs to a region of the human reference sequence containing the structural variant and 1 kbp of flanking sequence on either side using cross-match. The resulting pair-wise alignments were examined for the existence of breakpoints or gaps. A variant as called if there is a gap or if the tumor and the normal contigs contain consistent breakpoint.
Experimental validation
Experimental validation as performed on putative structural variants in the AML tumor and normal genomes. Primer3 as used in conjunction with internal software to design and select tailed PCR primers for structural variant validation. Efforts were made to avoid designing primers in repetitive regions and to select primers with average GC-content close to 50% and a predicted Tm of 60° C. Primers were selected by hand hen automated methods indicated a lo likelihood of success. For small insertions, small inversions, and deletions of most sizes, PCR primers were designed approximately 100-200 bp outside of the boundaries of the breakpoints defined by BreakDancer. For large inversions and intrachromosomal translocations, primers were designed with the same orientation as, but 10-200 bp upstream of any variant supporting read pairs. If a structural variant as supported by both forward and reverse read pairs across both breakpoints, a total of four primers were designed and to separate attempts were made to validate the variant with PCR amplification and Sanger sequencing. Structural variants were considered validated if any single resulting read sequence spanned the predicted breakpoints. No primers were designed for complex events, e.g., if conserved repeats spanned or flanked both ends of the predicted breakpoints. Genomic DNA from the tumor and a matched normal blood sample were amplified using standard PCR protocols. Putative small insertions, small inversions, and deletions of all sizes were amplified using Amplitaq Gold polymerase. Putative large inversions and intrachromosomal translocations were amplified using Accutaq Hotstart polymerase. All PCR products were evaluated on a 2% agarose gel. Regardless of yield, all products were sequenced in both directions using Big Dye Terminator reactions and subsequently loaded on an AB 3730xl capillary sequencer. The resulting traces were assembled to a reference sequence extracted from the region surrounding the predicted variant site on NCBI build 36 with an additional 1 kbp of flanking 3′ and 5′ sequence. All resulting diploid trace data were manually reviewed and those traces showing unambiguous evidence of homozygous or heterozygous SV were classified as either somatic or germline events, or alternatively, labeled as variants if the somatic status could not be determined due to lack of sequence data from the matched normal sample.
The NA18507 data
We downloaded approximately 3.5 billion end sequences (1.7 billion pairs) of length 36 to 41 bp and insert size 200bp from the NCBI Short Read Archive. This constituted about 42 × sequence and 120 × physical coverage of the human genome. we mapped all reads from the 200 bp library to the NCBI build 36.1 reference using MAQ-0.7.1 and obtained 37.2 × haploid coverage after removing the duplicated reads that have identical outer coordinates. Consistent with the previous reports24, the obtained insert size distribution is approximately normal with a mean of 209 bp and a s.d. of 13 bp.
The AML data
We constructed four Illumina paired-end libraries from the genomic DNA of the primary tumor cells and to libraries from the normal skin cells. The mean insert sizes range from 95 bp to 268 bp based on the empirical insert size distributions estimated from the alignment (Supplementary Table 1). All libraries had unimodal insert size distributions although the normal DNA libraries had a relatively larger s.d. than the tumor libraries (Supplementary Fig. 12). Some libraries have distributions clearly diverged from Gaussian and these can be problematic for variant detection methods that assume normality. For both the tumor and the skin genomes, we obtained 21 × haploid sequence coverage, corresponding to 63.5× and 39.9× physical coverage, respectively. Of the paired-end reads obtained, 67% were 50 bp and the rest between 35 bp and 36 bp. All reads were mapped to the NCBI build 36 human reference sequence using MAQ-0.7.1.
System Requirements and Software Availability
BreakDancer is currently written in Perl and is available at http://genome.ustl.edu/tools/cancer-genomics/. It usually takes three to five hours and between 200 MB to 500 MB memory to analyze one human chromosome at around 50-fold sequence redundancy.
Supplementary Material
Supplementary Figure 1: The size of indels detectable by MAQ paired end Smith-Waterman alignment algorithm
Supplementary Figure 2: The true positive rate (TPR) .r.t. coverage in different size bins
Supplementary Figure 3: Size and Breakpoint Accuracy of BreakDancerMax in simulation
Supplementary Figure 4: Receiver operator characteristics (ROC) .r.t. the number of anomalous read pairs (n) and the confidence score (Q)
Supplementary Figure 5: The true positive rate (TPR) and the false positive rate (FPR) given various separation thresholds
Supplementary Figure 6: The Receiver Characteristic (ROC) of BreakDancerMini at different threshold of Dnn′
Supplementary Figure 7: Accuracy of variant size estimated by BreakDancerMini
Supplementary Figure 8: Percent overlap between the AML structural variants and the DGV (v5) as functions of the confidence score or number of anomalous read pairs
Supplementary Figure 9: AML validation result .r.t variant size and confidence score
Supplementary Figure 10: Plots of identified inversions and intra-chromosomal translocations in the AML genome
Supplementary Figure 11: The analytic true positive rate .r.t. variant size and coverage
Supplementary Figure 12: The insert size distribution of the libraries in the AML project
Supplementary Table 1: List of structural variants detected in simulation
Supplementary Table 2: Number and type of structural variants detected by BreakDancerMax in the tumor-normal paired AML genome.
Supplementary Table 3: A list of AML2 structural variants detected by BreakDancer, refined by local assembly, and validated via PCR resequencing
Supplementary Table 4: The paired end libraries used for the structural variation detection of the 1000 genomes trio individuals
Supplementary Table 5: Deletions detected by BreakDancerMax on chromosome 5 of NA12878
Supplementary Table 6: Deletions detected by BreakDancerMax on chromosome 5 of NA19240
Supplementary Table 7: Analytic true positive rate in simulated structural variant detection using a 200 insert library
Supplementary Table 8: Analytic true positive rate in simulated structural variant detection using a 400 insert library
Supplementary Note: Additional results in simulation
Figure 4.
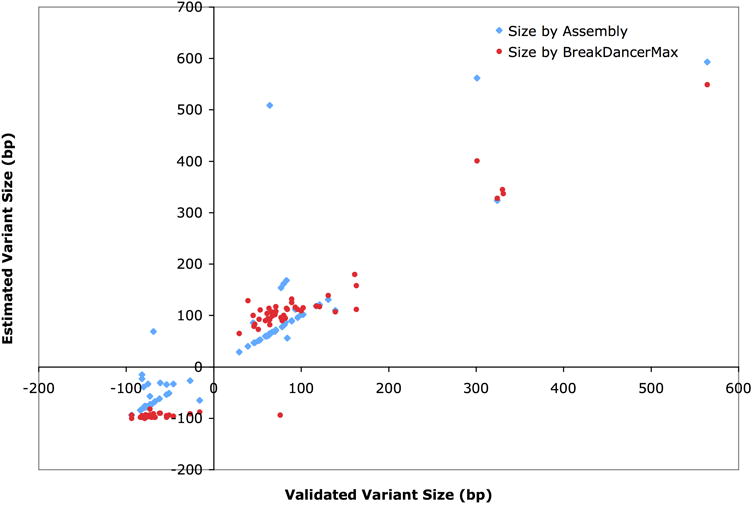
Accuracy of predicted variant sizes. Plotted are variant sizes predicted by BreakDancer and by local assembly versus true sizes determined from the PCR resequencing (x axis). Positive sizes represent deletions and negatives represent insertions.
Acknowledgments
We are grateful to the Genomics of AML Program Project Grant team at washington University Medical School (NCI PO1 CA101937, PI T. Ley) and the 1,000 Genomes Consortium for providing the data. We thank members of the 1,000 Genomes SV group, H. Li at wellcome Trust Sanger Institute for methodology discussions, D. Bentley and M. Ross at Illumina, C. Alkan and J. Kidd at University of ashington, Y. Li and H. Zheng at Beijing Genome Institute (BGI) for providing validation data. We also thank A. Chinalla, D. Dooling, S. Smith, J. Eldred, C. Harris, L. Cook, V. Magrini, Y. Tang, H. Schmidt, C. Haipek, G. Elliott, and R. Abbott at washington University Genome Center for assistance. This work as supported by a grant from the National Human Genome Research Institute (HG003079, PI R.K..).
Footnotes
Author's Contributions: E.R.M, R.K.W, L.D., and T.J.L.: project conception and oversight. K.C.: algorithm design and implementation. J.W.W.: variant assembly. J.M.K, M.D.M, and R.S.F.: experimental validation. C.S.P. and L.D.: primer design. S.D.M and D.P.L.: Illumina library preparation. Q.Z. and M.C.W.: statistical insight. J.W.W., D.E.L., X.S., and D.P.L: variant characterization and visualization. K.C., E.R.M., M.C.W., L.D., and J.W.W.: manuscript preparation.
References
- 1.Feuk L, Carson AR, Scherer SW. Structural variation in the human genome. Nat Rev Genet. 2006;7:85–97. doi: 10.1038/nrg1767. [DOI] [PubMed] [Google Scholar]
- 2.Ben-Shachar S, et al. 22q11.2 distal deletion: a recurrent genomic disorder distinct from DiGeorge syndrome and velocardiofacial syndrome. Am J Hum Genet. 2008;82:214–21. doi: 10.1016/j.ajhg.2007.09.014. [DOI] [PMC free article] [PubMed] [Google Scholar]
- 3.Sharp AJ, et al. A recurrent 15q13.3 microdeletion syndrome associated with mental retardation and seizures. Nat Genet. 2008;40:322–8. doi: 10.1038/ng.93. [DOI] [PMC free article] [PubMed] [Google Scholar]
- 4.Futreal PA, et al. A census of human cancer genes. Nat Rev Cancer. 2004;4:177–83. doi: 10.1038/nrc1299. [DOI] [PMC free article] [PubMed] [Google Scholar]
- 5.Comprehensive genomic characterization defines human glioblastoma genes and core pathways. Nature. 2008;455:1061–8. doi: 10.1038/nature07385. [DOI] [PMC free article] [PubMed] [Google Scholar]
- 6.Mitelman F, Johansson B, Mertens F. The impact of translocations and gene fusions on cancer causation. Nat Rev Cancer. 2007;7:233–45. doi: 10.1038/nrc2091. [DOI] [PubMed] [Google Scholar]
- 7.Urban AE, et al. High-resolution mapping of DNA copy alterations in human chromosome 22 using high-density tiling oligonucleotide arrays. Proc Natl Acad Sci U S A. 2006;103:4534–9. doi: 10.1073/pnas.0511340103. [DOI] [PMC free article] [PubMed] [Google Scholar]
- 8.Redon R, et al. Global variation in copy number in the human genome. Nature. 2006;444:444–54. doi: 10.1038/nature05329. [DOI] [PMC free article] [PubMed] [Google Scholar]
- 9.Istrail S, et al. Whole-genome shotgun assembly and comparison of human genome assemblies. Proc Natl Acad Sci U S A. 2004;101:1916–21. doi: 10.1073/pnas.0307971100. [DOI] [PMC free article] [PubMed] [Google Scholar]
- 10.Khaja R, et al. Genome assembly comparison identifies structural variants in the human genome. Nat Genet. 2006;38:1413–8. doi: 10.1038/ng1921. [DOI] [PMC free article] [PubMed] [Google Scholar]
- 11.Levy S, et al. The diploid genome sequence of an individual human. PLoS Biol. 2007;5:e254. doi: 10.1371/journal.pbio.0050254. [DOI] [PMC free article] [PubMed] [Google Scholar]
- 12.Wheeler DA, et al. The complete genome of an individual by massively parallel DNA sequencing. Nature. 2008;452:872–6. doi: 10.1038/nature06884. [DOI] [PubMed] [Google Scholar]
- 13.Mardis ER. The impact of next-generation sequencing technology on genetics. Trends Genet. 2008;24:133–41. doi: 10.1016/j.tig.2007.12.007. [DOI] [PubMed] [Google Scholar]
- 14.Bentley DR, et al. Accurate whole human genome sequencing using reversible terminator chemistry. Nature. 2008;456:53–9. doi: 10.1038/nature07517. [DOI] [PMC free article] [PubMed] [Google Scholar]
- 15.Wang J, et al. The diploid genome sequence of an Asian individual. Nature. 2008;456:60–5. doi: 10.1038/nature07484. [DOI] [PMC free article] [PubMed] [Google Scholar]
- 16.Volik S, et al. End-sequence profiling: sequence-based analysis of aberrant genomes. Proc Natl Acad Sci U S A. 2003;100:7696–701. doi: 10.1073/pnas.1232418100. [DOI] [PMC free article] [PubMed] [Google Scholar]
- 17.Raphael BJ, Volik S, Collins C, Pevzner PA. Reconstructing tumor genome architectures. Bioinformatics. 2003;19(2):ii162–71. doi: 10.1093/bioinformatics/btg1074. [DOI] [PubMed] [Google Scholar]
- 18.Kaiser J. DNA sequencing. A plan to capture human diversity in 1000 genomes. Science. 2008;319:395. doi: 10.1126/science.319.5862.395. [DOI] [PubMed] [Google Scholar]
- 19.Mardis ER, et al. Recurring Mutations Found by Sequencing an Acute Myeloid Leukemia Genome. N Engl J Med. doi: 10.1056/NEJMoa0903840. (accepted for publication) [DOI] [PMC free article] [PubMed] [Google Scholar]
- 20.Li H, Ruan J, Durbin R. Mapping short DNA sequencing reads and calling variants using mapping quality scores. Genome Res. 2008;18:1851–8. doi: 10.1101/gr.078212.108. [DOI] [PMC free article] [PubMed] [Google Scholar]
- 21.Kidd JM, et al. Mapping and sequencing of structural variation from weight human genomes. Nature. 2008;453:56–64. doi: 10.1038/nature06862. [DOI] [PMC free article] [PubMed] [Google Scholar]
- 22.Korbel JO, et al. Paired-end mapping reveals extensive structural variation in the human genome. Science. 2007;318:420–6. doi: 10.1126/science.1149504. [DOI] [PMC free article] [PubMed] [Google Scholar]
- 23.Tuzun E, et al. Fine-scale structural variation of the human genome. Nat Genet. 2005;37:727–32. doi: 10.1038/ng1562. [DOI] [PubMed] [Google Scholar]
- 24.Hormozdiari F, Alkan C, Eichler EE, Sahinalp SC. Combinatorial algorithms for structural variation detection in high-throughput sequenced genomes. Genome Res. 2009;19:1270–8. doi: 10.1101/gr.088633.108. [DOI] [PMC free article] [PubMed] [Google Scholar]
- 25.Lee S, Hormozdiari F, Alkan C, Brudno M. MoDIL: detecting small indels from clone-end sequencing with mixtures of distributions. Nat Methods. 2009;6:473–4. doi: 10.1038/nmeth.f.256. [DOI] [PubMed] [Google Scholar]
- 26.Stuart A, Ord K, Arnold S. Kendall's Advanced Theory of Statistics. 2A. Wiley; London: 1999. pp. 25.37–25.43. [Google Scholar]
- 27.Walter MJ, et al. Acquired Subcytogenetic Deletions and Amplifications in Adult Acute Myeloid Leukemia Genomes. Proc Natl Acad Sci U S A. accepted for publication. [Google Scholar]
- 28.McCarroll SA, et al. Integrated detection and population-genetic analysis of SNPs and copy number variation. Nat Genet. 2008;40:1166–74. doi: 10.1038/ng.238. [DOI] [PubMed] [Google Scholar]
- 29.Chiang DY, et al. High-resolution mapping of copy-number alterations with massively parallel sequencing. Nat Methods. 2009;6:99–103. doi: 10.1038/nmeth.1276. [DOI] [PMC free article] [PubMed] [Google Scholar]
- 30.Fisher RA. Combining independent tests of significance. American Statistician. 1948;2:30. [Google Scholar]
- 31.Zerbino DR, Birney E. Velvet: algorithms for de novo short read assembly using de Bruijn graphs. Genome Res. 2008;18:821–9. doi: 10.1101/gr.074492.107. [DOI] [PMC free article] [PubMed] [Google Scholar]
Associated Data
This section collects any data citations, data availability statements, or supplementary materials included in this article.
Supplementary Materials
Supplementary Figure 1: The size of indels detectable by MAQ paired end Smith-Waterman alignment algorithm
Supplementary Figure 2: The true positive rate (TPR) .r.t. coverage in different size bins
Supplementary Figure 3: Size and Breakpoint Accuracy of BreakDancerMax in simulation
Supplementary Figure 4: Receiver operator characteristics (ROC) .r.t. the number of anomalous read pairs (n) and the confidence score (Q)
Supplementary Figure 5: The true positive rate (TPR) and the false positive rate (FPR) given various separation thresholds
Supplementary Figure 6: The Receiver Characteristic (ROC) of BreakDancerMini at different threshold of Dnn′
Supplementary Figure 7: Accuracy of variant size estimated by BreakDancerMini
Supplementary Figure 8: Percent overlap between the AML structural variants and the DGV (v5) as functions of the confidence score or number of anomalous read pairs
Supplementary Figure 9: AML validation result .r.t variant size and confidence score
Supplementary Figure 10: Plots of identified inversions and intra-chromosomal translocations in the AML genome
Supplementary Figure 11: The analytic true positive rate .r.t. variant size and coverage
Supplementary Figure 12: The insert size distribution of the libraries in the AML project
Supplementary Table 1: List of structural variants detected in simulation
Supplementary Table 2: Number and type of structural variants detected by BreakDancerMax in the tumor-normal paired AML genome.
Supplementary Table 3: A list of AML2 structural variants detected by BreakDancer, refined by local assembly, and validated via PCR resequencing
Supplementary Table 4: The paired end libraries used for the structural variation detection of the 1000 genomes trio individuals
Supplementary Table 5: Deletions detected by BreakDancerMax on chromosome 5 of NA12878
Supplementary Table 6: Deletions detected by BreakDancerMax on chromosome 5 of NA19240
Supplementary Table 7: Analytic true positive rate in simulated structural variant detection using a 200 insert library
Supplementary Table 8: Analytic true positive rate in simulated structural variant detection using a 400 insert library
Supplementary Note: Additional results in simulation