

Abstract
OBJECTIVE
Individuals with type 2 diabetes have increased fracture risk despite higher bone mineral density (BMD). Our aim was to examine the influence of glucose control on skeletal complications.
RESEARCH DESIGN AND METHODS
Data of 4,135 participants of the Rotterdam Study, a prospective population-based cohort, were available (mean follow-up 12.2 years). At baseline, 420 participants with type 2 diabetes were classified by glucose control (according to HbA1c calculated from fructosamine), resulting in three comparison groups: adequately controlled diabetes (ACD; n = 203; HbA1c <7.5%), inadequately controlled diabetes (ICD; n = 217; HbA1c ≥7.5%), and no diabetes (n = 3,715). Models adjusted for sex, age, height, and weight (and femoral neck BMD) were used to test for differences in bone parameters and fracture risk (hazard ratio [HR] [95% CI]).
RESULTS
The ICD group had 1.1–5.6% higher BMD, 4.6–5.6% thicker cortices, and −1.2 to −1.8% narrower femoral necks than ACD and ND, respectively. Participants with ICD had 47–62% higher fracture risk than individuals without diabetes (HR 1.47 [1.12–1.92]) and ACD (1.62 [1.09–2.40]), whereas those with ACD had a risk similar to those without diabetes (0.91 [0.67–1.23]).
CONCLUSIONS
Poor glycemic control in type 2 diabetes is associated with fracture risk, high BMD, and thicker femoral cortices in narrower bones. We postulate that fragility in apparently “strong” bones in ICD can result from microcrack accumulation and/or cortical porosity, reflecting impaired bone repair.
Type 2 diabetes and osteoporosis are common diseases with increasing prevalence in the aging population. Due to their associated morbidity and mortality, the conditions cause a high health burden in Western societies (1–3).
There is increasing evidence supporting an association between type 2 diabetes and increased fracture risk, even though individuals with type 2 diabetes have high bone mineral density (BMD) (4–6). One of these studies was based on the Rotterdam Study, where de Liefde et al. (7) showed that individuals with type 2 diabetes had 69% increased fracture risk than those without diabetes despite having higher BMD at the femoral neck and lumbar spine. Results from a joint effort by three large prospective observational studies indicated that the fracture risk for any given femoral neck BMD T-score and age is increased in type 2 diabetic patients compared with those without diabetes (5). Recently, the World Health Organization’s fracture risk assessment tool (FRAX) has been shown to underestimate the osteoporotic fracture risk in individuals with diabetes; this is why diabetes as a risk factor will be considered for inclusion in future iterations of FRAX (8). These findings suggest that factors other than BMD may be underlying the higher fracture risk observed in diabetes patients, and that in fact the BMD measurement does not reflect the actual tendency of patients with type 2 diabetes to develop bone fragility. We recently meta-analyzed published studies that compared BMD in individuals with type 2 diabetes to those without diabetes, and using meta-regression, we established that higher HbA1c is associated with higher BMD across type 2 diabetes groups (6).
Our aim was to investigate if the intricate relationship between BMD, bone geometry, and fractures in type 2 diabetes is influenced by glucose control. Using data from the Rotterdam Study, a large, prospective, population-based study in elderly Dutch individuals, we examined bone parameters and incident fracture risk across groups of diabetic subjects with adequate and inadequate glucose control as compared with the rest of the population without diabetes.
RESEARCH DESIGN AND METHODS
Ethics statement
The Medical Ethics Committee of the Erasmus Medical Center has approved the Rotterdam Study, and informed consent was obtained from all participants.
The Rotterdam Study
The Rotterdam Study is a prospective, population-based cohort studying the determinants of chronic diseases and disability in Dutch men and women. Both the objectives and the study design have been described previously (9). The study targets investigations on endocrine diseases such as osteoporosis and diabetes, among others. In short, all inhabitants 55 years of age and over of the Ommoord district in the city of Rotterdam in the Netherlands were invited to participate from January 1990 onwards (response rate 78%). Between 1990 and 1993, a baseline home interview on medical history, risk factors for chronic diseases and medication use, and information on age at menopause was taken by trained interviewers. Falling was assessed using structured personal interviews by trained medical research nurses. A faller was defined as an individual with a history of one, two, or more falls without precipitating trauma (e.g., car accident or sport injury) in the 12 months preceding the baseline interview. Falling frequency at baseline was recorded as never, less than once a month, and more than once a month. Follow-up data were collected using a different questionnaire at the second and third follow-up. Smoking habits were coded as current, former, and never. A trained dietitian used an extensive, validated, semiquantitative food-frequency questionnaire to assess alcohol intake, which was reported in standard alcoholic drinks (9.8625 g/12.5 cc of alcohol) per day. Subsequently, participants were invited to the research center for clinical examination. During the baseline visit, height and weight were measured with indoor clothing and no shoes. BMI was calculated as weight (in kg)/height (in m2). Information on medication use included the use of antidiabetic medication, diuretics, hormonal replacement therapy, and systemic corticosteroids.
Laboratory investigations
Creatinine was measured using standard laboratory methods. Serum insulin and sex steroids (including testosterone, E1, E2, sex hormone–binding globulin, and dehydroepiandrosterone sulfate) levels were determined in plasma samples using radioimmunoassays purchased from Diagnostic Systems Laboratories, Inc. (Webster, TX) and Medgenix Diagnostics (Brussels, Belgium), respectively. Fasting serum insulin levels were measured only in those individuals not using antidiabetic medication. Fructosamine serum levels were measured by colorimetry and reported in micromoles per liter; fructosamine measurements in the Rotterdam Study had an interassay coefficient of variation (CV) of 3.0 (10). HbA1c was computed at baseline from fructosamine levels using the following formula as described previously (11): HbA1c = 0.017 × fructosamine (µmol/L) + 1.61.
Assessment of type 2 diabetes
All participants, except those on antidiabetic medication, underwent an oral glucose tolerance test (OGTT) with a 37.5% oral glucose solution (75 g of glucose) in a nonfasting state. Blood samples were drawn by venipuncture before and 2 h after the OGTT. Serum glucose levels were measured using glucose hexokinase. Diabetes was defined as antidiabetic medication use or a preload or postload serum glucose level >11.1 mmol/L. Medical profiles were checked to exclude type 1 diabetes subjects (e.g., restriction to those who reported having diabetes at or after 30 years of age) (7). Of the 4,135 included participants, 420 (10.2%) were classified as having type 2 diabetes at baseline according to both OGTT (n = 250) and antidiabetic medication use (n = 170, of which 39 were exogenous insulin users). Inadequate glucose control in diabetes was defined as a serum HbA1c level ≥7.5% (58 mmol/mol) measured at baseline. This way, three comparison groups were defined, including no diabetes (ND; n = 3,715), adequately controlled diabetes (ACD) with serum HbA1c level <7.5% (n = 203), and inadequately controlled diabetes (ICD) with serum HbA1c level ≥7.5% (n = 217). In addition, impaired glucose tolerance was defined as having a preload or postload OGTT serum glucose from 7.8 to 11.1 mmol/L.
Ophthalmic examinations
Visual acuity was measured at a 3-m distance using the Lighthouse Distance Visual Acuity Test, which is a modified Early Treatment Diabetic Retinopathy Study chart (12). For best-corrected visual acuity (BCVA), optimal refraction was obtained subjectively after objective autorefraction (Topcon RM-A2000; Topcon Optical Company, Tokyo, Japan). After pharmacologic mydriasis, participants underwent fundus photography, covering a 35° field centered on the macula of both eyes. For the assessment of visual impairment, two sets of commonly used criteria for categorization of blindness and low vision were applied based on 1) World Health Organization criteria (13), with blindness defined as BCVA <0.05 (Snellen, 20/400) in the better eye and low vision defined as 0.05 (20/400)≤ BCVA <0.3 (20/60) in the better eye; and 2) the most commonly used criteria in the U.S. defining blindness as BCVA <0.1 (20/200) in the better eye and low vision as 0.1 (20/200)≤ BCVA <0.5 (20/40) in the better eye. Retinopathy at baseline was defined as the presence of cotton wool spots, evidence of laser treatment for retinopathy, or the presence of one or more dot/blot hemorrhages or microaneurysms.
BMD and hip structural analysis
Femoral neck and lumbar spine BMD was measured by dual-energy X-ray absorptiometry (DXA) using a Lunar DPX-L densitometer (Lunar Radiation Corp., Madison, WI) (14). Hip structural analysis (15) was used to measure hip bone geometry from the DXA scans of the femur narrow neck region. BMD and bone width (outer diameter) were measured directly from mineral mass distributions (15). Estimates of mean cortical thickness and endocortical diameter were obtained by modeling the narrow neck region as a circular annulus, which assumes a proportion of cortical/trabecular bone of 60/40. The section modulus was calculated as CSMI/dmax, where CSMI is the cross-sectional moment of inertia and dmax is the maximum distance from the center of mass to the medial or lateral surface. Buckling ratios were computed as dmax divided by estimated mean cortical thickness. Data on bone geometry and glucose controls were available for 3,339 individuals, including those without diabetes (n = 2,995), with ACD with serum HbA1c level <7.5% (n = 157), and with ICD with serum HbA1c level ≥7.5% (n = 187).
Incident fracture assessment
All events, including fractures and death, were reported by general practitioners in the research area (covering 80% of the cohort) by means of a computerized system. All reported events were verified by two trained research physicians, who independently reviewed and coded the information. Subsequently, all coded events were reviewed by a medical expert for final classification. Subjects were followed from their baseline visit until 1 January 2007 or until a first fracture or death occurred, resulting in a mean fracture follow-up of 12.2 years (SD = 4.2 years).
Statistical analysis
Mean differences in continuous baseline characteristics, BMD, and geometry parameters were tested in models adjusted for age, sex, height, and weight using ANOVA and (post hoc) independent-samples t test of subgroups. Baseline characteristics that were counts were analyzed with Pearson χ2 and Fisher exact tests. Cox proportional hazard regression models were used to estimate the risk of fracture in a model adjusted for sex, age, height, and weight. In addition, the fracture analyses were adjusted for femoral neck BMD. The differences in β coefficients between groups were tested with a z test. Potential confounders were tested by adding them to the models, including serum creatinine, serum insulin, use of diuretics, systemic corticosteroid use, alcohol intake, smoking status, and falling frequency, in the year preceding the baseline visit. We evaluated if the change in effect estimate was 10% or more and if statistical significance was lost. The role of antidiabetic medication use was evaluated in a sensitivity analysis by running the regression model after excluding individuals who were using antidiabetic medication. S-plus software was used to generate Kaplan-Meier curves and to test for the proportionality of hazards. If not stated otherwise, SPSS 15.0 was used for the analyses.
RESULTS
Baseline characteristics by status of glycemic control
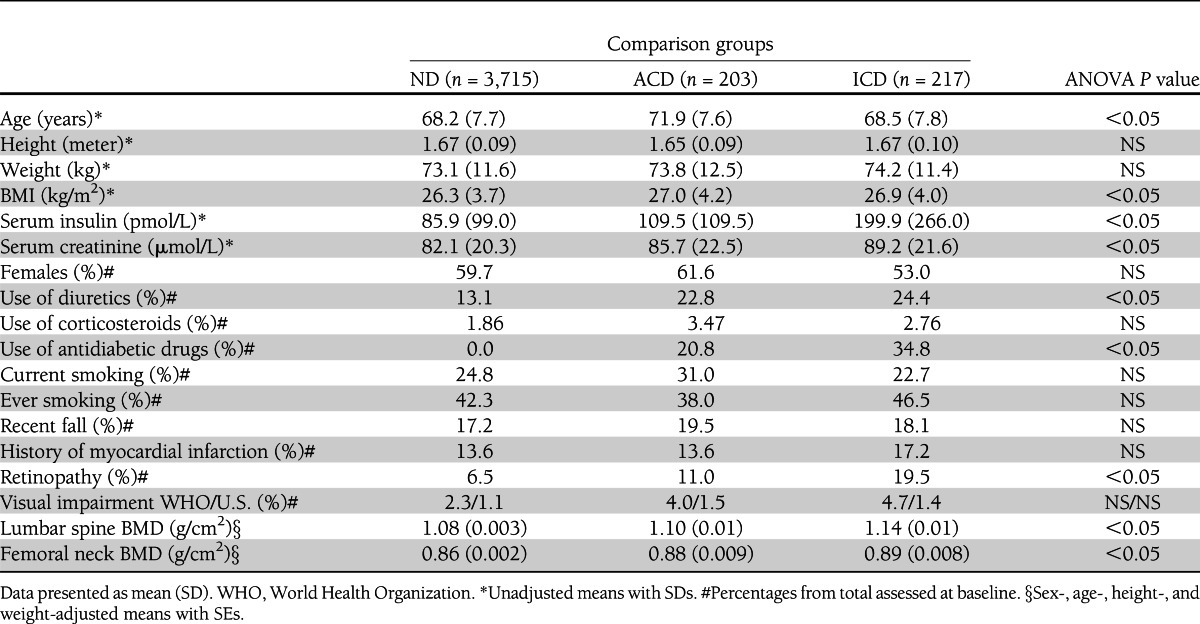
The baseline characteristics of the three comparison groups are shown in Table 1. On average, individuals with diabetes were older, had a higher BMI, higher serum insulin, and creatinine levels, and used diuretics more frequently than those without diabetes (ND). Individuals classified as ICD had the highest insulin levels and highest frequency of retinopathy and used antidiabetic medication more frequently. In female participants, the age at menopause, frequency of hormone replacement therapy, and serum sex steroid levels did not differ significantly between women in any of the comparison groups (data not shown).
Table 1.
Baseline characteristics of study participants stratified by comparison group
Association with BMD and hip bone geometry
Overall, participants with diabetes had a higher BMD than those without diabetes at the lumbar spine and femoral neck (Table 1). ICD had between 1.1 and 5.6% higher BMD (g/cm2) at both the femoral neck (0.89) and lumbar spine (1.14) as compared with the ACD group (femoral neck, 0.88, P = 0.26; lumbar spine, 1.10, P = 0.02) and ND (femoral neck, 0.86, P = 0.00006; lumbar spine, 1.08, P = 0.00003). In addition, bone geometry parameters of the narrow neck region assessed in a subset of the sample (n = 3,319) were studied across glucose-control comparison groups (Table 2). As expected from the results from the lumbar spine and the femoral neck region, the mean narrow neck BMD (g/cm2) was also the highest in individuals with ICD. As compared with ND, individuals with ICD had 5.6% thicker cortices than the ND group (P = 0.00002) and 4.6% thicker cortices than the ACD group (P = 0.02). No significant difference in cortical thickness was observed between the ND and ACD groups (P = 0.48). Differential effects were also seen for neck width, where individuals with ICD had −1.8% narrower femoral necks than the ND group (P = 0.0004) and −1.2% narrower femoral necks than the ACD group, although the latter difference did not achieve statistical significance (P = 0.10). The narrow neck width in individuals with ACD showed no significant differences from those observed in the ND group. No significant differences in bending strength (section modulus) were observed across comparison groups. In contrast, narrower necks with thicker cortices suggest higher cortical bone stability (lower buckling ratios), and ICD individuals had −6.8% significantly lower buckling ratios (higher cortical bone stability) than those observed in individuals from the ACD (P = 0.005) and ND groups (P = 0.0001). To further evaluate the relationship between cortical thickness, femoral neck width, and glucose control, we examined the relationship across age tertiles (Fig. 1A and B). The observed differences were particularly prominent in the oldest tertile, where individuals with ICD had 8.1% thicker cortices than ND individuals (P = 0.001) and 9.3% thicker than ACD individuals (P = 0.08). Similarly, the neck width of ICD individuals in this older tertile had −2.5% narrower necks than ND individuals (P = 0.003) and, though not statistically significant, −1.2% narrower necks than ACD individuals (P = 0.31).
Table 2.
Hip structural analysis (bone geometry) parameters stratified by glucose control groups
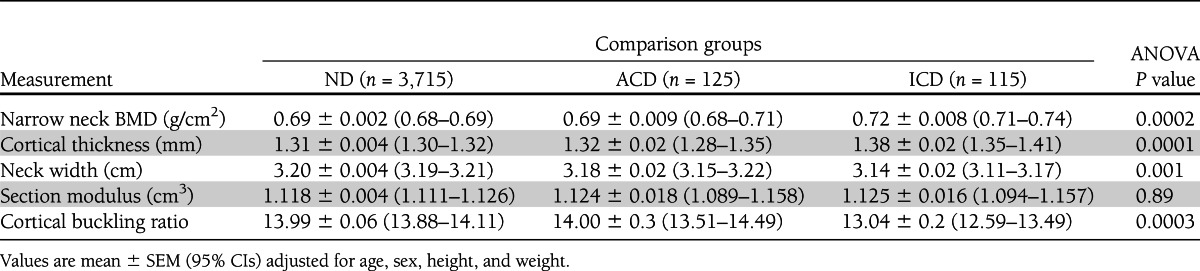
Figure 1.


Adjusted means of narrow neck width (A) and cortical thickness (B) in relation to glucose control by age tertiles: youngest, 55.0–63.6 years of age; middle, 63.6–71.4 years of age; oldest, >71.4 years of age. Kaplan-Meier curve per comparison group showing the adjusted cumulative hazards for fracture using follow-up time as timescale (C). Cox proportional hazard model: ICD vs. no diabetes HR 1.47 (95% CI 1.12–1.92), P = 0.005; ACD vs. no diabetes HR 0.91 (0.67–1.23), P = 0.54. Cumulative HR adjusted for femoral neck BMD, age, sex, height, and weight. Light gray, ND; dark gray or dashed, ACD; black, ICD.
Fracture-free survival analysis
Tables 3 and 4 show the site-specific fracture incidence rates and hazard ratios (HRs) stratified by glucose control. During follow-up, 1,068 subjects experienced at least one incident fracture, including 253 individuals presenting with a hip fracture and 257 individuals with a wrist fracture. Individuals in the ICD group had an increased fracture risk compared with ACD (HR 1.62 [95% CI 1.09–2.40]) and ND (1.47 [1.12–1.92]), whereas those with ACD had an HR of 0.91 (0.67–1.23) as compared with ND. Kaplan-Meier fracture-free survival curves are shown in Fig. 1C. The analysis of fracture subtypes showed a similar trend for wrist (Colles distal forearm) fracture as that observed for all types of fracture, whereas the pattern for hip fracture risk was inconsistent (Tables 3 and 4).
Table 3.
Site-specific fracture incidence rates stratified by glucose control groups
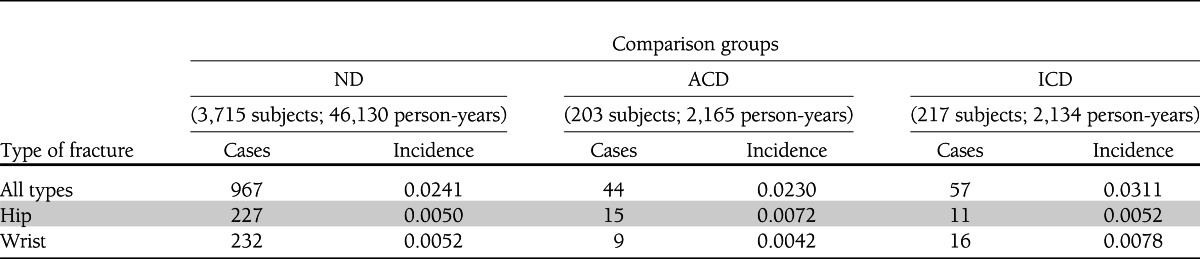
Table 4.
HRs stratified by glucose control groups
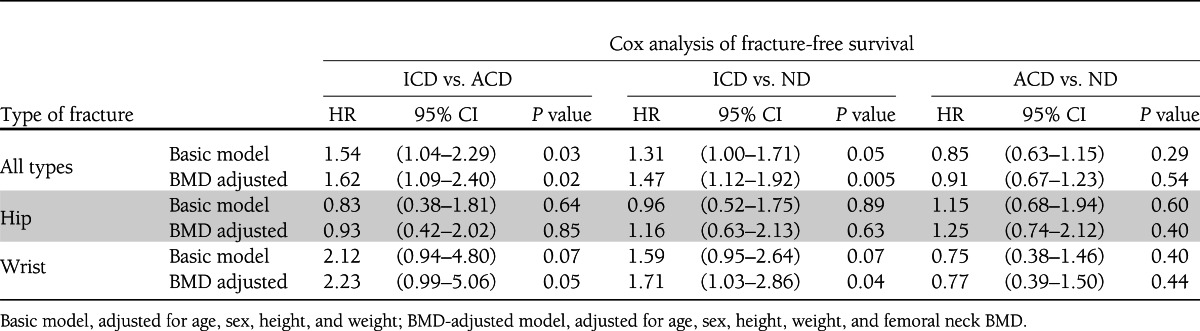
Even though mean BMD was higher in individuals with diabetes, being the highest in the ICD group, lower femoral neck BMD was significantly associated with increased fracture risk across all study groups: ND (HR 1.60 per SD decrease [95% CI 1.46–1.75]), ACD (HR 2.72 per SD decrease [1.76–4.20]), and ICD (1.54 [1.11–2.14]). These analyses and those with correction for BMD described before suggest that the ICD group tends to fracture at a higher BMD than the ACD group. We tested for sex interaction and found that the increase in fracture risk was significantly stronger in women (P = 0.02): ICD vs. ACD (HR women 2.08 [1.31–3.30]; HR men 0.72 [0.33–1.56]); ICD vs. ND (HR women 1.64 [1.20–2.22]; HR men 1.09 [0.62–1.92]).
The effect of inadequate glucose control on fracture risk, BMD, or bone geometry was not essentially changed by any of the confounders tested. For example, falling more than once a month was independently and highly significantly associated with fracture risk (HR 1.80 [95% CI 1.18–2.74]) as expected, but when added to the model, the risk estimates for the diabetes comparison groups remained similar (ICD vs. ACD effect estimate −0.9% and ICD vs. ND effect estimate −1.4%). Also, serum creatinine as a measure of kidney function was independently significantly associated with fracture risk (HR 0.89 per SD increase in serum creatinine [0.81–0.98]), but when added to the model, the estimates for the diabetes comparison groups remained statistically significant and essentially the same magnitude (ICD vs. ACD effect estimate +2.0% and ICD vs. ND effect estimate −6.4%). The elevated HR for fracture risk in the inadequately controlled group remained after excluding individuals who were using antidiabetic medication. In addition, further adjustment of the analyses for serum insulin levels in a subset of the study population did not essentially alter the effect estimates. Finally, according to the classification used in de Liefde et al. (7), we examined the group without diabetes classified by the presence of impaired glucose tolerance (preload or postload OGTT serum glucose from 7.8 to 11.1 mmol/L) and observed no differences in BMD or bone geometry parameters. In contrast, individuals without diabetes and an impaired glucose tolerance test had 0.80 (95% CI 0.66–0.97) decreased risk for any type of fracture as compared with individuals without diabetes and no impaired glucose tolerance, a finding that requires further evaluation in future studies.
CONCLUSIONS
To our knowledge, this is the first study examining glucose control in subjects with type 2 diabetes in relation to BMD, bone geometry parameters, and fracture risk. ICD individuals have higher BMD at the lumbar spine and femoral neck, with thicker cortices and smaller bone diameter at the femoral neck. This hip bone geometry configuration results in lower estimates of femoral narrow neck instability and no differences in bending strength. ICD individuals present stronger geometry associated with a lower risk of fracture (16,17). However, we found that ICD individuals have an increased fracture risk compared with individuals with ACD and individuals without diabetes. This association did not seem to be influenced by potential confounders or arising from diabetes complications (extraskeletal risk factors), such as risk of falling at baseline or decline in renal function, nor by the use of systemic corticosteroids or diuretics. The discrepancy between BMD and geometrical findings with fracture incidence observed here could be attributed to a weaker material causing failure at lower stress or biomechanical skeletal properties, which cannot be detected by DXA assessments.
Our study has several strengths. First, this is a large, prospective, population-based study including 4,135 participants with long and comprehensive follow-up of more than 12 years on average. Second, we had various covariables available for analyses, including the fracture incidence, bone geometry parameters at baseline, and various other determinants of fractures. Third, the classification of type 2 diabetes was robustly determined, taking into account OGTT and antidiabetic medication use. The broad availability of assessments in our study enabled extensive analyses. Yet, our study has limitations. The age of onset of diabetes was unknown, and we cannot be sure about the duration of the glucose control assessment beyond the 3–4 months around the fructosamine measurement. Similarly, deriving HbA1c from fructosamine may result in a somewhat different classification of glycemic control. Yet, it has been shown that fructosamine is as, or even more, strongly associated with microvascular conditions than HbA1c, with excellent assay reliability (10,18). In addition, hip structural properties and risk of falling during follow-up were assessed with different methods than at baseline, so we were less able to infer relationships with incident fractures that occurred many years after the baseline visit. Falling risk is a potential confounder because patients with diabetes have an increased risk of falling (19). We showed that the risk of falling at baseline does not explain the association with increased fracture risk. Nevertheless, we cannot exclude that during follow-up, falling frequency and subsequent fracture risk can increase as a consequence of diabetes complications (i.e., retinopathy or neuropathy), which we show is higher in the inadequately controlled group of individuals with diabetes. Alternatively, insulin users with low HbA1c levels are reported to fall more, likely as a consequence of hypoglycemia (20). We propose that even with a similar risk for falling, individuals in the ICD group would have (when falling) a higher propensity to fracture given their unfavorable skeletal properties.
Interestingly, ICD individuals actually seem to have a stronger bone geometry, which would protect against fractures. Unfortunately, no bone geometry parameters for sites other than the femoral neck were available in our study, nor did we have access to techniques, such as peripheral quantitative computed tomography (pQCT) scanning, that allow a three-dimensional assessment of bone structure and microarchitecture. Others have shown before that bone strength in patients with type 2 diabetes may be compromised despite a higher BMD (21–23) and particularly as a result of altered adaptation to loading (21). Sex-specific differences may exist, reflecting differential patterns of bone apposition between sexes (bone dimorphism). A direct interaction between estradiol and IGF-I in the determination of periosteal apposition has been proposed, (24) and serum IGF-I levels are negatively associated with increased risk for prevalent vertebral fractures in postmenopausal women but not in men with type 2 diabetes (25). Yet, our sex-specific analyses are restricted because of a lower power setting in men, partly due to survival bias and lower incidence of fractures. A final caveat to bear in mind in relation to the applicability of our findings is that our study population consisted of Dutch individuals of Northeastern European background. Additional studies in multiple settings with sufficiently large sample sizes are required.
Some studies evaluated the relationship between glycemic control and fracture risk and found conflicting results (26–30). A study by Ivers et al. (27) in 3,654 Australian middle-aged subjects found that fasting blood glucose >7 mmol/L, disease duration >10 years, insulin treatment, and the presence of diabetic retinopathy were associated with increased risk of all fractures. On the other hand, Melton et al. (29) found no association of fracture risk with baseline fasting plasma glucose level, yet the follow-up time was limited. None of these studies measured HbA1c (a better indicator of diabetes control), which correlates strongly with disease severity. In a study in Japanese men, Kanazawa et al. (28) found that obese individuals with HbA1c >9 and higher BMD had three times increased risk of vertebral fracture than nonobese men with diabetes. In another study, Forsén et al. (26) used a similarly high cutoff of HbA1c >9.5 for diabetic subjects from a large Norwegian population (n = 35,444) and found no association. Yet, they did find that fracture risk was higher in subjects with disease duration >5 years and being treated with insulin. A threshold of HbA1c >7% was used by Strotmeyer et al. (30) to define poor glycemic control for patients with diabetes, in a study in 3,075 older white and black adults from the Health ABC study. Individuals with diabetes had 1.6 increased risk of fracture (after correction for BMD and fracture risk factors), but when comparing diabetes patients with and without fractures, poor glycemic control, longer disease duration, and insulin use were not significantly different. Therefore, different HbA1c thresholds can make a difference in the definition of glucose control and the relationship with fracture. In our study, we used a 7.5% cutoff (closest to the median/mean HbA1c in our data), which has been proposed for patients of old age (mean age in our study was 69 years), those with comorbidities, and those with established cardiovascular complications (31), in line with the established relationship between diabetes control, (cardiovascular) complications, and mortality (32).
Our data on hip bone geometry show how individuals with ICD have persistently thicker cortices than those with ND and ACD (Fig. 2). In addition, a lesser tendency to undergo physiological bone expansion (periosteal apposition) is also inferred from narrower bone diameters in individuals with ICD. A recent study by Burghardt et al. (33), using high-resolution pQCT, reported that the cortical porosity in type 2 diabetic patients was up to twice that of controls. Our findings are compatible with those described by Ahlborg et al. (34), where impaired bone remodeling is suggested by a lack of cortical thinning, with consequent lack of compensatory bone expansion. Since such differences in geometry are accentuated at older ages, we postulate that an accumulation of microcracks and/or cortical porosity in time may well be the consequence of impaired bone repair or decreased bone remodeling. Taken together, these results suggest an inefficient redistribution of bone in ICD. This configuration can predispose individuals with ICD to increased bone fragility as a result of increased microcracks and/or cortical porosity. Additional studies using high-resolution pQCT to evaluate bone properties in type 2 diabetes while considering glucose control are thus warranted.
Figure 2.

Cartoon depicting the differences in bone geometry across glucose control groups for a cross-section of the femoral neck. Individuals with ICD have thicker cortices and narrower neck width than those without diabetes and ACD. With lower instability of cortical bone (lower buckling ratios), the accumulation of microcracks and cortical porosity becomes a possibility to explain bone fragility and fracture susceptibility. Drawing is not to scale.
The exact mechanisms underlying these bone parameters in ICD remain to be elucidated. Nevertheless, it can be hypothesized that the following factors may play a role: the accumulation of advanced glycation end products (35), impaired bone healing (36), altered body composition (e.g., sarcopenia) (37), and increased production of nonenzymatic cross-links within collagen fibers negatively influencing bone matrix properties (38), among others. Probably both osteoclastic (39) and osteoblastic (40) cell lineages are compromised, knowing that bone remodeling involves both bone resorption and formation. From this perspective, the narrower neck width observed in ICD may well reflect alterations in the differentiation and/or function of the osteoblastic lineage. Considering the known anabolic effects of IGF-I and insulin on bone and periosteal expansion (41–43), it can be expected that the altered insulin–IGF-I–growth hormone axis (lower bioavailability of IGF-I) present in ICD (44–46) may also contribute to the observed geometrical alterations we observed. Also, follow-up studies focusing on the actual metabolic pathways involved in such mechanisms are thus needed.
Our findings indicate that the detrimental effects of chronically elevated glucose levels on bone should be added to the more well-known complications of inadequately regulated diabetes, such as retinopathy, nephropathy, and micro- and macrocardiovascular disease. Furthermore, a high BMD in those with ICD may in fact reflect a skeletal complication of the disease. If so, evaluation of BMD and the most commonly used clinical risk factors might be inadequate for predicting fracture risk in those with ICD, who (due to their high BMD) are unlikely to be diagnosed with osteoporosis and increased risk of fracture. Similarly, our data showed that individuals with type 2 diabetes who are adequately controlled have a similar fracture risk as ND. This indicates that the first line of action for fracture prevention in diabetes is targeting adequate glycemic control. However, results from a randomized trial published very recently did not find changes in fracture or fall risk between standard glycemia and intensive glycemia (47). Nevertheless, the average follow-up until now was merely 3.8 (SD 1.3) years, so inference of long-term effects, i.e., from long-standing control and diminishing carryover of pretreatment glycemic exposure, is not yet possible. Type 2 diabetes can seriously affect the patient’s quality of life, especially in the presence of diabetes-related complications (48). Bone fractures occurring on top of these altered conditions might further increase the health burden already observed in individuals with inadequate glucose control of their diabetes. Randomized controlled trials could reveal if certain antidiabetic drugs associated with increased risk of fracture (i.e., thiazolidinediones) are cases of confounding by indication (inadequate glucose control) (49), or alternatively, if skeletal-specific interventions to activate remodeling (e.g., vibration plate) could indeed benefit the bone health of individuals with diabetes.
Increased fracture risk in type 2 diabetes is driven by poor glycemic control and occurs in the presence of higher BMD and thicker femoral cortices in narrower bones. We postulate that fragility in the apparently strong bones of those with ICD can be the consequence of an accumulation of microcracks (cortical porosity) that reflect sustained impairment of bone repair. This should be investigated in future research. We recommend that fracture risk assessments in ICD should not be based on BMD alone, since high BMD could actually reflect a complication of inadequate glycemic control. A reassessment of risk factors (particularly BMD) is needed for the prevention of this skeletal complication in ICD. Finally, the maintenance of more stringent parameters of glycemic control can emerge as the first line of action to prevent fractures and their subsequent deleterious consequences on the quality of life of individuals with diabetes.
Acknowledgments
The Rotterdam Study was funded by Erasmus Medical Center and Erasmus University (Rotterdam, the Netherlands); the Netherlands Organization for Health Research and Development; the Research Institute for Diseases in the Elderly; the Ministry of Education, Culture, and Science; the Ministry of Health, Welfare, and Sports; the European Commission (DG XII); the Netherlands Genomics Initiative; the Netherlands Consortium of Healthy Ageing (Project 050-060-810); and the Municipality of Rotterdam. L.O. was sponsored by the FP7-GEFOS Project funded by the European Commission (HEALTH-F2-2008-201865, GEFOS). A.D. was supported by an Erasmus University Rotterdam fellowship. J.C.M.W. was supported by a grant from the Netherlands Organization for Scientific Research (VICI, 918-76-619).
No potential conflicts of interest relevant to this article were reported.
The funders had no role in study design, data collection and analysis, decision to publish, or preparation of the manuscript.
L.O. and F.R. conceived and designed the current study, analyzed and interpreted the data, and wrote the first draft of the paper. M.C.Z., M.C.C.-B., K.E., E.H.G.O., J.A.M.J.L.J., J.P.T.M.v.L., and O.H.F. interpreted the data. A.D., H.A.P.P., and C.C.W.K. enrolled participants and interpreted the data. G.H.S.B. analyzed and interpreted the data. L.S. and J.B.J.v.M. enrolled participants. A.H. conceived and obtained funding for the Rotterdam Study and enrolled participants. J.C.M.W. and A.G.U. conceived and obtained funding for the Rotterdam Study, enrolled participants, and interpreted the data. All authors contributed to the writing of the paper, read and met the criteria for authorship, and agree with the manuscript’s results and conclusions. F.R. is the guarantor of this work and, as such, had full access to all the data in the study and takes responsibility for the integrity of the data and the accuracy of the data analysis.
Parts of this study were presented at the Third Joint Meeting of the European Calcified Tissues Society and the International Bone and Mineral Society, Athens, Greece, 7–11 May 2011, and the 2011 Annual Meeting of the American Society of Bone Mineral Research, San Diego, California, 16–20 September 2011.
The authors would like to thank Dr. Thomas J. Beck (The Johns Hopkins University School of Medicine, Baltimore, MD) for his help in creating the Hip Structural Analysis dataset and critical insights into its interpretation. The authors acknowledge all the participating general practitioners, research physicians, and many field workers in the research center in Ommoord, Rotterdam, the Netherlands. The authors are very grateful to the Erasmus Medical Center contributors of the fracture data set, DXA, and research technicians, particularly J.H. van den Boogert and Jolande Verkroost-van Heemst (Erasmus Medical Center).
References
- 1.National Diabetes Statistics [article online], 2011. Available from http://diabetes.niddk.nih.gov/dm/pubs/statistics/ Accessed 1 July 2011
- 2.DECODE Study Group. Age- and sex-specific prevalences of diabetes and impaired glucose regulation in 13 European cohorts. Diabetes Care 2003;26:61–69 [DOI] [PubMed]
- 3.Ström O, Borgström F, Kanis J, et al. Osteoporosis: burden, health care provision and opportunities in the EU: a report prepared in collaboration with the International Osteoporosis Foundation (IOF) and the European Federation of Pharmaceutical Industry Associations. Arch Osteoporos 2011;6:59–155 [DOI] [PubMed] [Google Scholar]
- 4.Janghorbani M, Van Dam RM, Willett WC, Hu FB. Systematic review of type 1 and type 2 diabetes mellitus and risk of fracture. Am J Epidemiol 2007;166:495–505 [DOI] [PubMed] [Google Scholar]
- 5.Schwartz AV, Vittinghoff E, Bauer DC, et al. Study of Osteoporotic Fractures (SOF) Research Group. Osteoporotic Fractures in Men (MrOS) Research Group. Health, Aging, and Body Composition (Health ABC) Research Group Association of BMD and FRAX score with risk of fracture in older adults with type 2 diabetes. JAMA 2011;305:2184–2192 [DOI] [PMC free article] [PubMed] [Google Scholar]
- 6.Ma L, Oei L, Jiang L, et al. Association between bone mineral density and type 2 diabetes mellitus: a meta-analysis of observational studies. Eur J Epidemiol 2012;27:319–332 [DOI] [PMC free article] [PubMed] [Google Scholar]
- 7.de Liefde II, van der Klift M, de Laet CE, van Daele PL, Hofman A, Pols HA. Bone mineral density and fracture risk in type-2 diabetes mellitus: the Rotterdam Study. Osteoporos Int 2005;16:1713–1720 [DOI] [PubMed] [Google Scholar]
- 8.Giangregorio LM, Leslie WD, Lix LM, et al. FRAX underestimates fracture risk in patients with diabetes. J Bone Miner Res 2012;27:301–308 [DOI] [PubMed] [Google Scholar]
- 9.Hofman A, van Duijn CM, Franco OH, et al. The Rotterdam Study: 2012 objectives and design update. Eur J Epidemiol 2011;26:657–686 [DOI] [PMC free article] [PubMed] [Google Scholar]
- 10.Stolk RP, Pols HA, Lamberts SW, de Jong PT, Hofman A, Grobbee DE. Diabetes mellitus, impaired glucose tolerance, and hyperinsulinemia in an elderly population. The Rotterdam Study. Am J Epidemiol 1997;145:24–32 [DOI] [PubMed] [Google Scholar]
- 11.Cohen RM, Holmes YR, Chenier TC, Joiner CH. Discordance between HbA1c and fructosamine: evidence for a glycosylation gap and its relation to diabetic nephropathy. Diabetes Care 2003;26:163–167 [DOI] [PubMed] [Google Scholar]
- 12.University of Maryland School of Medicine, Department of Epidemiology and Preventative Medicine. Early Treatment Diabetic Retinopathy Study (ETDRS). Manual of Operations Baltimore, ETDRS Coordinating Center, 1980 [Google Scholar]
- 13.World Health Organization. International Statistical Classification of Diseases and Related Health Problems 10th Revision Geneva, World Health Org., 1992 [Google Scholar]
- 14.Burger H, de Laet CE, van Daele PL, et al. Risk factors for increased bone loss in an elderly population: the Rotterdam Study. Am J Epidemiol 1998;147:871–879 [DOI] [PubMed] [Google Scholar]
- 15.Beck TJ, Looker AC, Ruff CB, Sievanen H, Wahner HW. Structural trends in the aging femoral neck and proximal shaft: analysis of the Third National Health and Nutrition Examination Survey dual-energy X-ray absorptiometry data. J Bone Miner Res 2000;15:2297–2304 [DOI] [PubMed] [Google Scholar]
- 16.Melton LJ, 3rd, Beck TJ, Amin S, et al. Contributions of bone density and structure to fracture risk assessment in men and women. Osteoporos Int 2005;16:460–467 [DOI] [PubMed] [Google Scholar]
- 17.Rivadeneira F, Zillikens MC, De Laet CE, et al. Femoral neck BMD is a strong predictor of hip fracture susceptibility in elderly men and women because it detects cortical bone instability: the Rotterdam Study. J Bone Miner Res 2007;22:1781–1790 [DOI] [PubMed] [Google Scholar]
- 18.Selvin E, Francis LM, Ballantyne CM, et al. Nontraditional markers of glycemia: associations with microvascular conditions. Diabetes Care 2011;34:960–967 [DOI] [PMC free article] [PubMed] [Google Scholar]
- 19.Schwartz AV, Hillier TA, Sellmeyer DE, et al. Older women with diabetes have a higher risk of falls: a prospective study. Diabetes Care 2002;25:1749–1754 [DOI] [PubMed] [Google Scholar]
- 20.Schwartz AV, Vittinghoff E, Sellmeyer DE, et al. Health, Aging, and Body Composition Study Diabetes-related complications, glycemic control, and falls in older adults. Diabetes Care 2008;31:391–396 [DOI] [PMC free article] [PubMed] [Google Scholar]
- 21.Garg R, Chen Z, Beck T, et al. Hip geometry in diabetic women: implications for fracture risk. Metabolism 2012;61:1756–1762 [DOI] [PMC free article] [PubMed] [Google Scholar]
- 22.Melton LJ, 3rd, Riggs BL, Leibson CL, et al. A bone structural basis for fracture risk in diabetes. J Clin Endocrinol Metab 2008;93:4804–4809 [DOI] [PMC free article] [PubMed] [Google Scholar]
- 23.Petit MA, Paudel ML, Taylor BC, et al. Osteoporotic Fractures in Men (MrOs) Study Group Bone mass and strength in older men with type 2 diabetes: the Osteoporotic Fractures in Men Study. J Bone Miner Res 2010;25:285–291 [DOI] [PMC free article] [PubMed] [Google Scholar]
- 24.Seeman E. Clinical review 137: Sexual dimorphism in skeletal size, density, and strength. J Clin Endocrinol Metab 2001;86:4576–4584 [DOI] [PubMed] [Google Scholar]
- 25.Kanazawa I, Yamaguchi T, Sugimoto T. Serum insulin-like growth factor-I is negatively associated with serum adiponectin in type 2 diabetes mellitus. Growth Horm IGF Res 2011;21:268–271 [DOI] [PubMed] [Google Scholar]
- 26.Forsén L, Meyer HE, Midthjell K, Edna TH. Diabetes mellitus and the incidence of hip fracture: results from the Nord-Trøndelag Health Survey. Diabetologia 1999;42:920–925 [DOI] [PubMed] [Google Scholar]
- 27.Ivers RQ, Cumming RG, Mitchell P, Peduto AJ, Blue Mountains Eye Study Diabetes and risk of fracture: the Blue Mountains Eye Study. Diabetes Care 2001;24:1198–1203 [DOI] [PubMed] [Google Scholar]
- 28.Kanazawa I, Yamaguchi T, Yamamoto M, Yamauchi M, Yano S, Sugimoto T. Combination of obesity with hyperglycemia is a risk factor for the presence of vertebral fractures in type 2 diabetic men. Calcif Tissue Int 2008;83:324–331 [DOI] [PubMed] [Google Scholar]
- 29.Melton LJ, 3rd, Leibson CL, Achenbach SJ, Therneau TM, Khosla S. Fracture risk in type 2 diabetes: update of a population-based study. J Bone Miner Res 2008;23:1334–1342 [DOI] [PMC free article] [PubMed] [Google Scholar]
- 30.Strotmeyer ES, Cauley JA, Schwartz AV, et al. Nontraumatic fracture risk with diabetes mellitus and impaired fasting glucose in older white and black adults: the health, aging, and body composition study. Arch Intern Med 2005;165:1612–1617 [DOI] [PubMed] [Google Scholar]
- 31.Benhalima K, Standl E, Mathieu C. The importance of glycemic control: how low should we go with HbA1c? Start early, go safe, go low. J Diabetes Complications 2011;25:202–207 [DOI] [PubMed] [Google Scholar]
- 32.Currie CJ, Peters JR, Tynan A, et al. Survival as a function of HbA(1c) in people with type 2 diabetes: a retrospective cohort study. Lancet 2010;375:481–489 [DOI] [PubMed] [Google Scholar]
- 33.Burghardt AJ, Issever AS, Schwartz AV, et al. High-resolution peripheral quantitative computed tomographic imaging of cortical and trabecular bone microarchitecture in patients with type 2 diabetes mellitus. J Clin Endocrinol Metab 2010;95:5045–5055 [DOI] [PMC free article] [PubMed] [Google Scholar]
- 34.Ahlborg HG, Johnell O, Turner CH, Rannevik G, Karlsson MK. Bone loss and bone size after menopause. N Engl J Med 2003;349:327–334 [DOI] [PubMed] [Google Scholar]
- 35.Brownlee M. The pathobiology of diabetic complications: a unifying mechanism. Diabetes 2005;54:1615–1625 [DOI] [PubMed] [Google Scholar]
- 36.Blakytny R, Spraul M, Jude EB. Review: the diabetic bone: a cellular and molecular perspective. Int J Low Extrem Wounds 2011;10:16–32 [DOI] [PubMed] [Google Scholar]
- 37.Evans WJ, Campbell WW. Sarcopenia and age-related changes in body composition and functional capacity. J Nutr 1993;123(Suppl.):465–468 [DOI] [PubMed] [Google Scholar]
- 38.Yamaguchi T, Sugimoto T. Bone metabolism and fracture risk in type 2 diabetes mellitus [Review]. Endocr J 2011;58:613–624 [DOI] [PubMed] [Google Scholar]
- 39.Schurman L, McCarthy AD, Sedlinsky C, et al. Metformin reverts deleterious effects of advanced glycation end-products (AGEs) on osteoblastic cells. Exp Clin Endocrinol Diabetes 2008;116:333–340 [DOI] [PubMed] [Google Scholar]
- 40.Zhou Z, Immel D, Xi CX, et al. Regulation of osteoclast function and bone mass by RAGE. J Exp Med 2006;203:1067–1080 [DOI] [PMC free article] [PubMed] [Google Scholar]
- 41.Mohan S, Richman C, Guo R, et al. Insulin-like growth factor regulates peak bone mineral density in mice by both growth hormone-dependent and -independent mechanisms. Endocrinology 2003;144:929–936 [DOI] [PMC free article] [PubMed] [Google Scholar]
- 42.Libanati C, Baylink DJ, Lois-Wenzel E, Srinvasan N, Mohan S. Studies on the potential mediators of skeletal changes occurring during puberty in girls. J Clin Endocrinol Metab 1999;84:2807–2814 [DOI] [PubMed] [Google Scholar]
- 43.Vanderschueren D, Venken K, Ophoff J, Bouillon R, Boonen S. Clinical review: sex steroids and the periosteum—reconsidering the roles of androgens and estrogens in periosteal expansion. J Clin Endocrinol Metab 2006;91:378–382 [DOI] [PubMed] [Google Scholar]
- 44.Chestnut RE, Quarmby V. Evaluation of total IGF-I assay methods using samples from type I and type II diabetic patients. J Immunol Methods 2002;259:11–24 [DOI] [PubMed] [Google Scholar]
- 45.Clauson PG, Brismar K, Hall K, Linnarsson R, Grill V. Insulin-like growth factor-I and insulin-like growth factor binding protein-1 in a representative population of type 2 diabetic patients in Sweden. Scand J Clin Lab Invest 1998;58:353–360 [DOI] [PubMed] [Google Scholar]
- 46.Sesti G, Sciacqua A, Cardellini M, et al. Plasma concentration of IGF-I is independently associated with insulin sensitivity in subjects with different degrees of glucose tolerance. Diabetes Care 2005;28:120–125 [DOI] [PubMed] [Google Scholar]
- 47.Schwartz AV, Margolis KL, Sellmeyer DE, et al. Intensive glycemic control is not associated with fractures or falls in the ACCORD randomized trial. Diabetes Care 2012;35:1525–1531 [DOI] [PMC free article] [PubMed] [Google Scholar]
- 48.Vadstrup ES, Frølich A, Perrild H, Borg E, Røder M. Health-related quality of life and self-related health in patients with type 2 diabetes: effects of group-based rehabilitation versus individual counselling. Health Qual Life Outcomes 2011;9:110. [DOI] [PMC free article] [PubMed] [Google Scholar]
- 49.Habib ZA, Havstad SL, Wells K, Divine G, Pladevall M, Williams LK. Thiazolidinedione use and the longitudinal risk of fractures in patients with type 2 diabetes mellitus. J Clin Endocrinol Metab 2010;95:592–600 [DOI] [PMC free article] [PubMed] [Google Scholar]