

Abstract
OBJECTIVE
Several studies showed low bone mineral density (BMD) and elevated risk of symptomatic fractures in patients with type 1 diabetes (T1D). To our knowledge, there has been no investigation on the prevalence of asymptomatic vertebral fractures (VFx) in T1D. In the current study, we assessed BMD and the prevalence of VFx in T1D.
RESEARCH DESIGN AND METHODS
We evaluated 82 T1D patients (26 males and 56 females, aged 31.1 ± 8.6 years, BMI 23.5 ± 3.3 kg/m2, disease duration 12.8 ± 8.3 years) and 82 controls (22 females and 60 males, aged 32.9 ± 5.8 years, BMI 23.9 ± 4.8 kg/m2). Spinal and femoral BMD (as Z-score, Z-LS and Z-FN, respectively) and the prevalence of VFx were evaluated by dual X-ray absorptiometry.
RESULTS
T1D patients had lower Z-LS and Z-FN than controls (−0.55 ± 1.3 vs. 0.35 ± 1.0, P < 0.0001, and −0.64 ± 1.1 vs. 0.29 ± 0.9, P < 0.0001, respectively) and a higher prevalence of VFx (24.4 vs. 6.1%, P = 0.002). Age, diabetes duration, age at diabetes manifestation, glycosylated hemoglobin, Z-LS, Z-FN, and the prevalence of chronic complications were similar for patients with and without VFx. In the logistic regression analysis, the presence of VFx was associated with the presence of T1D but not with lumbar spine BMD. Whereas moderate or severe VFx was associated with low lumbar spine BMD in the whole combined group of T1D patients and controls, there was no association between moderate or severe VFx and lumbar spine BMD in the T1D group.
CONCLUSIONS
T1D patients have low BMD and elevated prevalence of asymptomatic VFx, which is associated with the presence of T1D independently of BMD.
Type 1 diabetes (T1D) has been suggested to be associated with an increased risk of fractures (1). The exact mechanisms accounting for bone fragility in T1D are not known in detail (2,3). In most but not all studies, bone mineral density (BMD), as measured by dual X-ray absorbtiometry (DXA), appears to be reduced (1–3). In particular, in adults, who have reached the peak of bone mass, the findings are somewhat heterogeneous, although most studies point toward a negative effect of T1D on BMD (2,4). In keeping with this, combined study analysis estimated that T1D increases the risk of clinical fractures by 1- to 2-fold at the spine, 1.5- to 2.5-fold at the hip, and 2-fold at the distal radius (2). No data are available regarding the risk of asymptomatic morphometric vertebral fracture (VFx) in T1D patients. This is an important lack of knowledge, because it is known that the presence of a morphometric VFx increases the risk of a subsequent spinal or hip fracture, regardless of BMD (5). In addition, a recent meta-analysis demonstrated an absolute risk of hip fracture in T1D higher than that expected on the basis of BMD variation (1). This suggests that in T1D the reduction of BMD estimates the fracture risk only partially. In this study, we evaluated the BMD and the prevalence of morphometric VFx in a group of adult T1D patients.
RESEARCH DESIGN AND METHODS
This cross-sectional case-control study was performed in the following 3 Belarusian Medical hospitals: Republic Clinical Hospital of Medical Rehabilitation (Minsk, Belarus), 1st Minsk City Clinical Hospital (Minsk, Belarus), and 10th Minsk City Clinical Hospital (Minsk, Belarus). From 2007 to 2011, a total of 200 consecutive T1D patients were evaluated. The diagnosis of T1D was based on the American Diabetes Association criteria (6). Inclusion criteria were as follows: age between 20 and 55 years, duration of disease ≥2 years, and eugonadal status. The exclusion criteria were as follows: 1) the presence of severe chronic kidney disease, 2) the presence or history of diseases and syndromes associated with low BMD (i.e., noncompensated hypothyroidism, hyperthyroidism, hyperparathyroidism, intestinal malabsorption, inflammatory bowel disease, or history of malignancy), 3) intake of drugs that can influence bone metabolism, 4) the pregnancy and lactation periods, and 5) the presence of acute infectious disease. Ultimately, 82 T1D patients were enrolled.
In the same period, 82 healthy subjects were recruited as controls among 932 subjects referred to our outpatient clinic by health providers of general medicine for the suspicion of hypothyroidism or Hashimoto thyroiditis. The control subjects were enrolled in the study if they had normal thyroid function and negative autoimmunity and if they fulfilled the inclusion criteria (age 20–55 years, eugonadal status) without any exclusion criteria (the presence of diabetes mellitus; the presence or history of diseases and syndromes associated with low BMD, such as hyperparathyroidism, intestinal malabsorption, inflammatory bowel disease, or history of malignancy; intake of drugs that can influence bone metabolism; the pregnancy and lactation periods; and the presence of acute infectious disease).
All subjects gave their witnessed, informed consent before entering the study, which was approved by local ethical committees and conducted in accordance with Helsinki Declaration II.
In all patients and controls, height and weight were measured and BMI was calculated. In all subjects, BMD was assessed with DXA (Prodigy Lunar; General Electric Medical Systems) and expressed as SD units (Z-values) in relation to an age-matched reference population at both lumbar spine (Z-LS) and femoral neck (Z-FN). BMD was adjusted for weight and classified as normal, osteopenic, or osteoporotic on the basis of Z-LS or Z-FN BMD (7). We decided to use both Z-score and T-score because the sample was composed of premenopausal women and men younger than 50 years. Indeed, as stated by the International Society of Clinical Densitometry (7), T-score and Z-score are equal for young people aged between 20 and 50 years. In addition, the T-score yields important clinical information regarding the presence or absence of osteoporosis, whereas the use of Z-score normalizes for age. Only 1 subject among both patients and controls was older than 50 years (a 54-year-old premenopausal woman), and we decided not to eliminate her from the study.
Data from lumbar spine scans were used only if at ≥3 vertebrae were visualized without interfering artifacts. Fractured vertebrae were excluded from BMD measurement. The coefficient of variation BMD measurements at lumbar spine and femoral neck was <1.5%. X-ray loading in one projection was 0.04 mSv. In both T1D patients and controls, the presence of morphometric VFx was assessed with DXA with the software Vertebral Fracture Assessment (VFA) from T4 to L4 vertebrae. This software is a program within the Prodigy Lunar system, including a lateral projection of the spine. The manufacturer refers to this lateral projection as “dual-energy vertebral assessment, DVA.” VFx was diagnosed according to the classification of Genant et al. (8). Each vertebra was considered as intact (grade 0) or as having approximately mild (20–25% compression), moderate (25–40% compression), or severe (>40% compression) deformity (grades 1, 2, and 3, respectively).The DXA and VFA reviewers were blinded to the presence of diabetes. In all patients with evidence of a VFx on VFA, conventional spinal radiographs in lateral (T4–L4) and anteroposterior projection (L1–L4) were obtained. In all cases, the X-ray evaluation confirmed the VFA results.
In T1D patients the presence of chronic complications was evaluated. Diabetic neuropathy evaluation was based on symptoms, quantitative sensory testing (temperature, vibration, and pressure perception) and quantitative motor testing (patellar and ankle reflexes). All T1D patients underwent funduscopic examination. Diabetic retinopathy was categorized as nonproliferative, preproliferative, or proliferative (9). Diabetic nephropathy was assessed by measuring microalbumin in 24-h urine samples (normal values <30 mg/day) twice (at enrolment and after 3–6 months) to determine persistent microalbuminuria. Microalbuminuria and macroalbuminuria were diagnosed on the basis of albumin excretion rate between 30 and 300 mg/day or >300 mg/day, respectively (9). For each patient, the diabetes complication score was calculated on the basis of the presence of 0, 1, 2, or 3 complications among neuropathy, retinopathy, and nephropathy (score of 0, 1, 2, or 3, respectively).
Venous blood samples were taken from all T1D patients in the morning before the insulin injection after a 10-h fast, centrifuged, and stored at −70°C until analysis. Glycosylated hemoglobin (HbA1c, normal value 4.0–6.0%) and serum creatinine were measured by high-performance liquid chromatography with autoanalyzer D10 (Bio-Rad) and with analyzer HITACHI 911 (Roche Diagnostics, Germany), respectively. Creatinine clearance (ClCr) was calculated with the formula of Cockcroft-Gault: ClCr (mL/min) = [140 – age (years) × weight (kg)/72 × 11.3 × serum creatinine (mmol/L)] for males and ClCr (mL/min) = 0.85 × [140 – age (years) × weight (kg)/72 × 11.3 × serum creatinine (mmol/L)] for females (9).
Because all T1D patients had completed complex education aimed at diabetes management in everyday life, all were motivated to complete standardized physical activity ≥30 min/day 5 days/week (a brisk walk, jogging, swimming, bicycling outside and indoors, dancing, playing tennis), as recommended by the American Diabetes Association (6). During the personal visit, the patients were asked how much time in a day and how many days in a week they spent on physical activity as previously described. The average values of physical activity in a week and in a day (expressed as hours/day) were then calculated.
Statistical analysis
Statistical analysis was performed with the SPSS version 18.0 statistical package (IBM Corporation, Armonk, NY). The distribution of variables was tested with the Kolmogorov-Smirnov test. The results are expressed as mean ± SD or median as appropriate. The comparison of continuous variables between patients and controls was performed with the Student t test or Mann-Whitney U test as appropriate. General linear modeling was performed to compare the continuous variables between patients and controls after adjusting for age. The categorical variables were compared by χ2 test or Fisher exact test. The associations between variables were tested by either Pearson or Spearman correlation, as appropriate. Multivariate logistic or linear regression analysis assessed the association between the presence of morphometric VFx (categorical dependent variable) and the following independent variables: age, sex, BMI, lumbar spine BMD, score of diabetes complications (expressed as a continuous variable), and physical activity. These variables were chosen because they are factors known to influence the skeletal metabolism. P < 0.05 was considered significant.
RESULTS
T1D patients versus controls
The general characteristics of T1D patients and controls are reported in Table 1. Age, anthropometric parameters (height, weight, and BMI), sex distribution, and renal function were comparable between patients and controls. Patients with T1D had significantly lower Z-LS and Z-FN and higher prevalence of low BMD (Z-score less than −1.0). General linear modeling confirmed these results after adjusting for age. Moreover, T1D patients showed significantly higher prevalence of morphometric VFx than did controls. About the 25% of T1D patients (n = 20) had at least 1 VFx. Among these, 14 patients had only mild VFx, whereas the remaining 4 and 2 patients had moderate or severe VFx, respectively; the difference from controls was statistically significant for mild VFx but not for moderate or severe VFx (Table 1). Even after excluding patients with mild fractures, these differences were substantially confirmed (T1D vs. controls, subjects with VFx 8.5 vs. 1.2%, P = 0.064, respectively).
Table 1.
Clinical characteristics of patients with T1D and control subjects
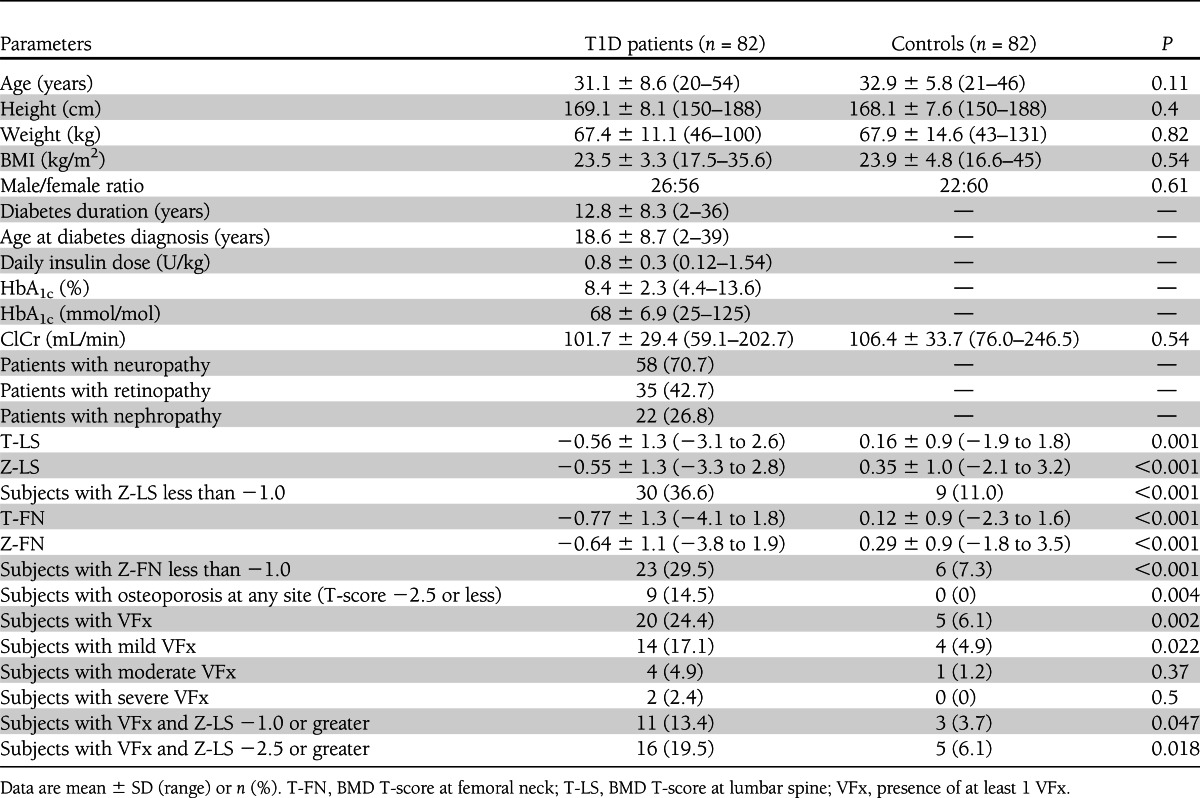
When analyzing male and female subjects separately, the results were the same as for the whole T1D group both for T1D males (T1D males vs. controls, Z-LS −1.0 ± 1.1 vs. 0.4 ± 0.67, P < 0.001, and Z-FN −1.0 ± 1.1 vs. 0.35 ± 0.6, P < 0.001; subjects with VFx 23.1 vs. 4.5%, P = 0.078, respectively) and T1D females (T1D female patients vs. controls, Z-LS −0.34 ± 1.3 vs. 0.32 ± 1.1, P = 0.003, and Z-FN −0.45 ± 1.2 vs. 0.27 ± 1.0, P = 0.01; subjects with VFx 25 vs. 6.7%, P = 0.009, respectively).
Patients with VFx versus those without
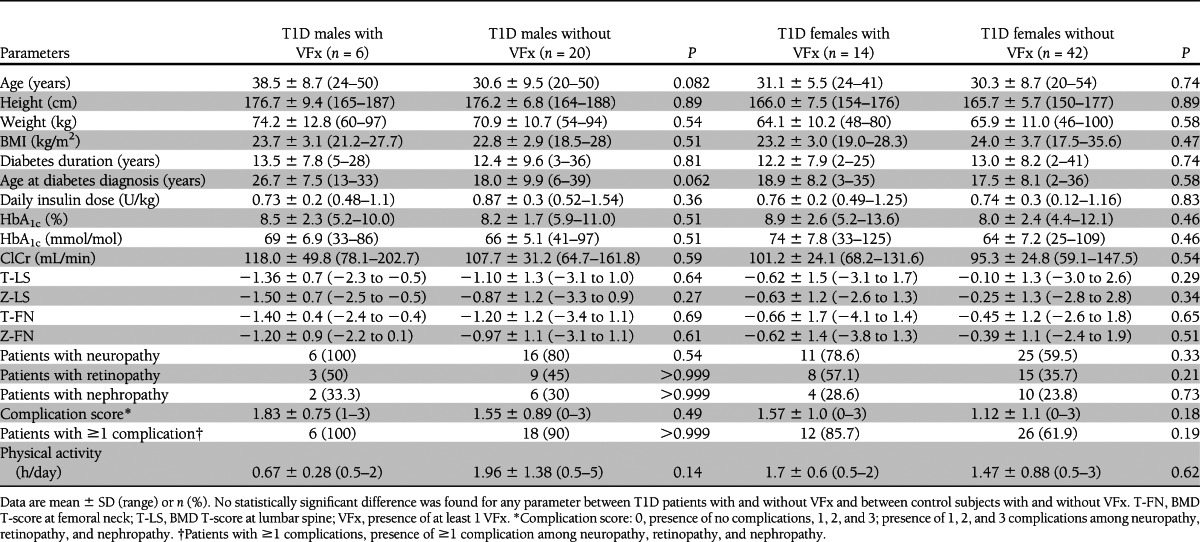
Comparing T1D patients with and without VFx, no differences were found in age, BMI, sex distribution, diabetes duration, age at T1D manifestation, HbA1c, renal function, and physical activity (Table 2). T1D patients with VFx tended, however, to have a lower BMD at both lumbar spine and femoral neck and higher prevalences of neuropathy and retinopathy and higher complication score relative to patients without VFx. The same trend toward lower BMD at both sites was seen also in controls with VFx relative to those without. Comparing T1D patients with and without VFx divided by sex, we found substantially the same results (Table 3).
Table 2.
Clinical characteristics of patients with and without T1D with and without VFx
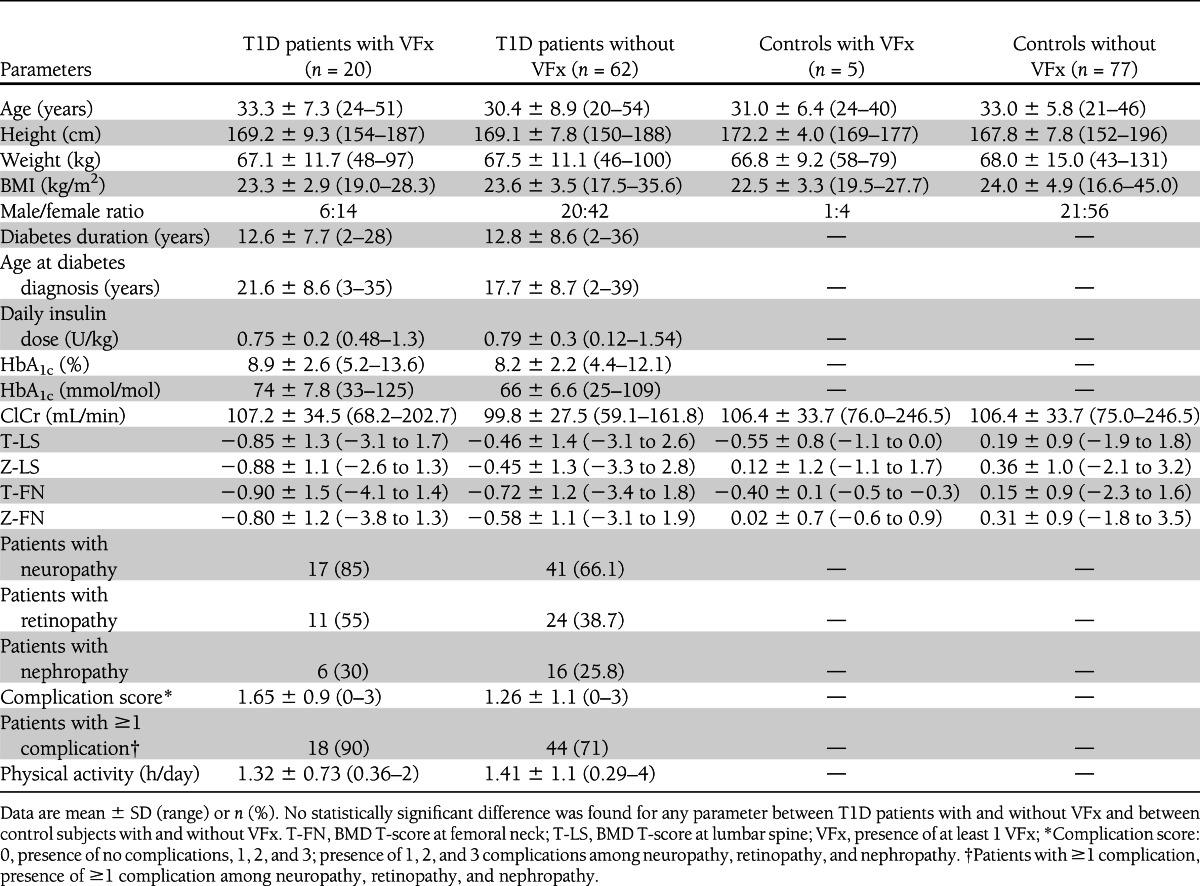
Table 3.
Clinical characteristics of males and females with T1D with VFx and without VFx
Logistic regression analysis
Analyzing diabetic patients together with controls, we found that the presence of mild, moderate, or severe VFx was associated with the presence of T1D but not with spine BMD after adjusting for age, sex, and BMI (Table 4). Separately analyzing T1D patients, we found that the presence of mild, moderate, or severe VFx tended to be associated with low spine BMD after adjusting for age, sex, BMI, complication score, and physical activity (Table 4).
Table 4.
Odds ratios for the presence of VFx after adjustment for lumbar spine BMD and other risk factors
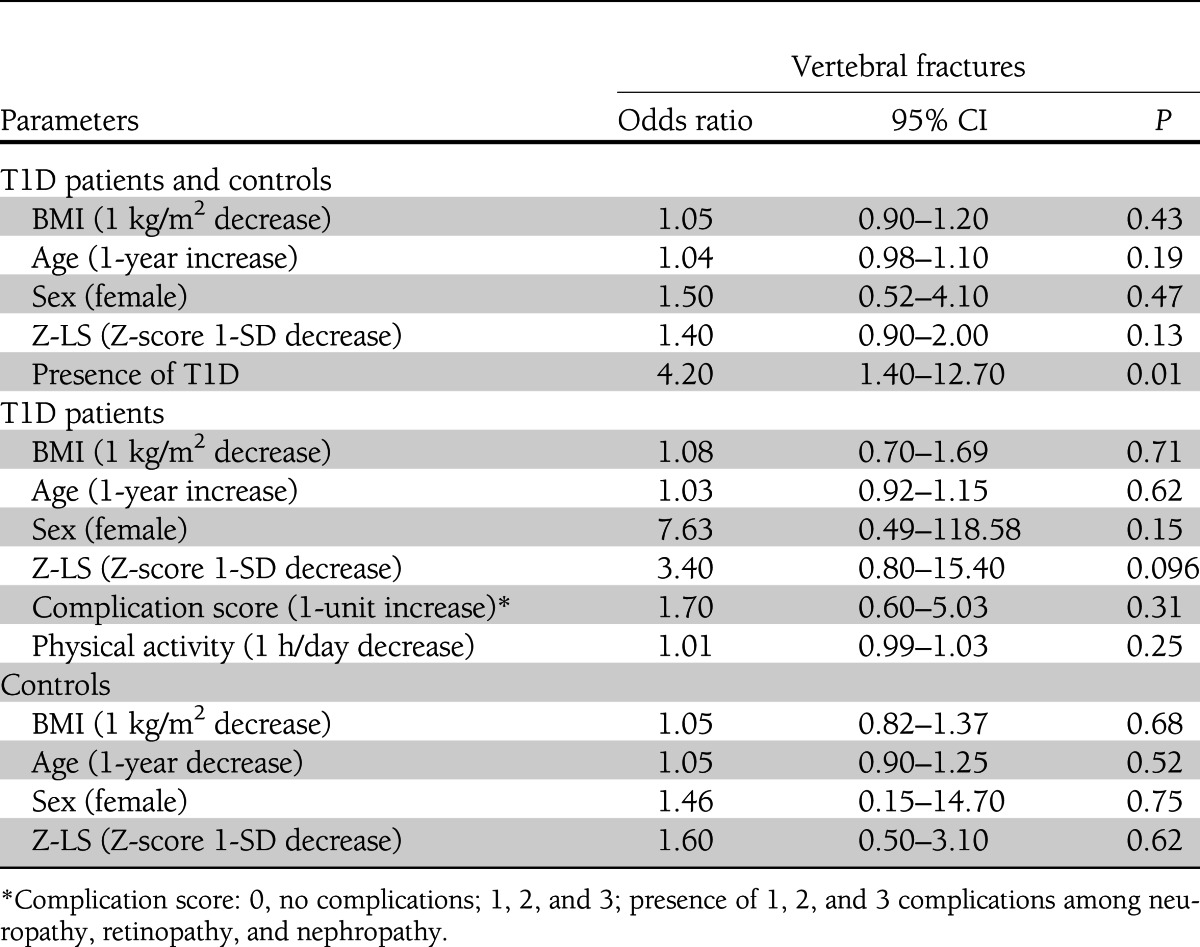
In the whole sample of T1D patients and controls, the presence of VFx of only moderate or severe grade was significantly associated with BMD at the lumbar spine (odds ratio 2.78 [95% CI, 1.09–7.14]; P = 0.033), but not with T1D (2.20 [0.20–24.40]; P = 0.51) after adjusting for age (1.06 [0.96–1.17]; P = 0.28), male sex (2.50 [0.48–13.16]; P = 0.28), and BMI (1.04 [0.84–1.29]; P = 0.69). This association was lost when only T1D patients were considered (BMI 1.00 [0.51–2.00]; P = 0.98; age 1.07 [0.92–1.26]; P = 0.37; female sex 2.16 [0.73–64.02]; P = 0.66; Z-LS 4.17 [0.48–35.70]; P = 0.20; complication score 1.43 [0.24–8.46]; P = 0.69; physical activity 1.01 [0.99–1.04]; P = 0.27).
CONCLUSIONS
To our knowledge, this is the first study evaluating the prevalence of morphometric VFx in patients with T1D. We found that BMD is decreased and the prevalence of morphometric VFx is increased in T1D patients.
It is well known that T1D patients frequently show low bone mass, the pathogenesis of which is still not clear (2,3). In this study, we confirmed that adults with T1D have significantly lower BMD and higher prevalence of low BMD (Z-score BMD less than −1.0) both at the lumbar spine and at the femoral neck relative to controls, as already suggested by previous studies (1,4).
In addition to low bone mass, T1D has been suggested to be characterized by elevated risk of clinical fractures (1,2,10); this also is consistent with our results, because in this study about 25% of T1D patients had VFx. On the other side, it has been recently suggested that fractures in T1D might be not entirely explained by reduced BMD (1), as happens in several forms of secondary osteoporosis (11). This is in keeping with the results of the logistic regression analysis (Table 4), which confirms the association of T1D with the presence of VFx regardless of BMD. When limiting the analysis to the moderate or severe fractures, BMD but not T1D was found to be associated with VFx. These apparently discordant findings may have arisen because the reduction of BMD remains crucial and overcomes the role of T1D when only more severe VFx is considered. It is not possible, however, to exclude the possibility that the number of patients with moderate or severe VFx (n = 5) was insufficient to evaluate the effect of T1D reliably in this subset of patients.
Notwithstanding these limits, these finding are of clinical importance, because the prevalence of VFx predicts future fractures regardless of BMD (5) and because the recognition of VFx by imaging of the spine may change the patient diagnostic classification, estimation of fracture risk, and threshold for pharmacological intervention.
In our sample, no potential risk factors for VFx other than BMD (among age, sex, BMI, physical activity, and complications) were found to be significantly associated with the presence of VFx in the logistic regression analysis (Table 4). Because T1D patients with VFx tended to have higher complication score and higher prevalence of diabetes complications, in particular retinopathy and neuropathy, the presence of chronic diabetes complications might be an adjunctive tool in addition to BMD in evaluating risk factors for fractures in T1D. The statistical significance for complication score was not reached, possibly because of the large SD and the relatively small number of patients with VFx. The link between the presence of the chronic complications and the presence of osteoporosis in T1D is debated (12–18). Recently, the presence of the chronic diabetes complications has been shown to be associated with low BMD in T1D (4). In contrast, Vestergaard et al. (10) showed that the complications of diabetes other than diabetic kidney disease add little to the overall risk of fracture.
Some data suggest that the nonenzymatic glycosylation of type 1 collagen, with subsequent formation of advanced glycation end products, has a negative impact on mechanical properties of cancellous and cortical bone. The alteration of the organic matrix in bone by advanced glycation end products could be relevant to increased bone fragility with aging and in such disease as diabetes (19,20). This is a suitable explanation for poor bone quality in T1D. In this study, the lack of association between BMD and VFx in T1D patients may suggest the loss of bone quality as a cause of the increased VFx prevalence in T1D patients.
This study has some limitations. First, we measured HbA1c only at enrollment. Because HbA1c levels are representative of the metabolic status of the last 3 months, we could not exclude the possibility that the metabolic status of an individual subject was different during the previous years and therefore not reliably mirrored by the current HbA1c levels. Second, in our study we used VFA for the identification of VFx. This technique uses a lower radiation level than standard radiography; however, it also provides lower image resolution (21). It has a good sensitivity (87–93%) and specificity (93–95%) for detecting moderate and severe VFx, but its performance for diagnosing mild VFx in the presence of scoliosis or osteoarthritis has been questioned (21). In our sample, however, no subjects had severe osteoarthritis, and an anteroposterior view of the spine by VFA was obtained to identify the patients with scoliosis. Moreover, in all patients with evidence of a VFx at VFA, the conventional spinal radiographs confirmed the VFA results, and even after excluding patients with mild fractures, the results were substantially confirmed. Finally, another limitation of this study is related to its cross-sectional design, which does not allow assessment of causality but only of association between variables.
In conclusion, this study confirms that BMD is reduced in T1D. Moreover, it shows that the prevalence of morphometric VFx is increased in T1D and not associated only with the reduction of BMD.
Acknowledgments
No potential conflicts of interest relevant to this article were reported.
V.V.Z. participated in data collection, analysis and interpretation of the data, and preparation of the manuscript. C.E.-V. participated in analysis and interpretation of the data and preparation of the manuscript. V.V.V. participated in data collection and performance of dual-energy X-ray absorptiometry. A.P.S. participated in data collection and analysis and interpretation of the data. I.V.Z. participated in data collection and database preparation. G.G.K. and O.B.S. participated in data collection. E.C. participated in analysis and interpretation of the data. P.B.-P. participated in analysis and interpretation of the data and review of the manuscript. I.C. participated in analysis and interpretation of the data, preparation of the manuscript, and review of the manuscript. I.C. is the guarantor of this work and, as such, had full access to all the data in the study and takes responsibility for the integrity of the data and the accuracy of the data analysis.
Writing groups: the Italian research group, V.V.Z., C.E.-V., E.C., P.B.-P., and I.C.; the Belarusian research group, V.V.V., A.P.S., I.V.Z., G.G.K., and O.B.S.
References
- 1.Vestergaard P. Discrepancies in bone mineral density and fracture risk in patients with type 1 and type 2 diabetes—a meta-analysis. Osteoporos Int 2007;18:427–444 [DOI] [PubMed] [Google Scholar]
- 2.Hofbauer LC, Brueck CC, Singh SK, Dobnig H. Osteoporosis in patients with diabetes mellitus. J Bone Miner Res 2007;22:1317–1328 [DOI] [PubMed] [Google Scholar]
- 3.McCabe LR. Understanding the pathology and mechanisms of type I diabetic bone loss. J Cell Biochem 2007;102:1343–1357 [DOI] [PubMed] [Google Scholar]
- 4.Eller-Vainicher C, Zhukouskaya VV, Tolkachev YV, et al. Low bone mineral density and its predictors in type 1 diabetic patients evaluated by the classic statistics and artificial neural network analysis. Diabetes Care 2011;34:2186–2191 [DOI] [PMC free article] [PubMed] [Google Scholar]
- 5.Crans GG, Genant HK, Krege JH. Prognostic utility of a semiquantitative spinal deformity index. Bone 2005;37:175–179 [DOI] [PubMed] [Google Scholar]
- 6.American Diabetes Association Standards of medical care in diabetes—2007. Diabetes Care 2007;30(Suppl. 1):S4–S41 [DOI] [PubMed] [Google Scholar]
- 7.Leib ES, Lewiecki EM, Binkley N, Hamdy RC, International Society for Clinical Densitometry Official positions of the International Society for Clinical Densitometry. South Med J 2004;97:107–110 [DOI] [PubMed] [Google Scholar]
- 8.Genant HK, Wu CY, van Kuijk C, Nevitt MC. Vertebral fracture assessment using a semiquantitative technique. J Bone Miner Res 1993;8:1137–1148 [DOI] [PubMed] [Google Scholar]
- 9.Donnelly R, Horton E (Eds.). Vascular Complications Of Diabetes: Current Issues in Pathogenesis and Treatment. 2nd ed. Hoboken, NJ, Wiley-Blackwell, 2005. [Google Scholar]
- 10.Vestergaard P, Rejnmark L, Mosekilde L. Diabetes and its complications and their relationship with risk of fractures in type 1 and 2 diabetes. Calcif Tissue Int 2009;84:45–55 [DOI] [PubMed] [Google Scholar]
- 11.Morelli V, Eller-Vainicher C, Salcuni AS, et al. Risk of new vertebral fractures in patients with adrenal incidentaloma with and without subclinical hypercortisolism: a multicenter longitudinal study. J Bone Miner Res 2011;26:1816–1821 [DOI] [PubMed] [Google Scholar]
- 12.Klotzbuecher CM, Ross PD, Landsman PB, Abbott TA, 3rd, Berger M. Patients with prior fractures have an increased risk of future fractures: a summary of the literature and statistical synthesis. J Bone Miner Res 2000;15:721–739 [DOI] [PubMed] [Google Scholar]
- 13.Rozadilla A, Nolla JM, Montaña E, et al. Bone mineral density in patients with type 1 diabetes mellitus. Joint Bone Spine 2000;67:215–218 [PubMed] [Google Scholar]
- 14.Clausen P, Feldt-Rasmussen B, Jacobsen P, et al. Microalbuminuria as an early indicator of osteopenia in male insulin-dependent diabetic patients. Diabet Med 1997;14:1038–1043 [DOI] [PubMed] [Google Scholar]
- 15.Rix M, Andreassen H, Eskildsen P. Impact of peripheral neuropathy on bone density in patients with type 1 diabetes. Diabetes Care 1999;22:827–831 [DOI] [PubMed] [Google Scholar]
- 16.Miazgowski T, Pynka S, Noworyta-Zietara M, Krzyzanowska-Swiniarska B, Pikul R. Bone mineral density and hip structural analysis in type 1 diabetic men. Eur J Endocrinol 2007;156:123–127 [DOI] [PubMed] [Google Scholar]
- 17.Alexopoulou O, Jamart J, Devogelaer JP, Brichard S, de Nayer P, Buysschaert M. Bone density and markers of bone remodelin g in type 1 male diabetic patients. Diabetes Metab 2006;32:453–458 [DOI] [PubMed] [Google Scholar]
- 18.Hamilton EJ, Rakic V, Davis WA, et al. Prevalence and predictors of osteopenia and osteoporosis in adults with Type 1 diabetes. Diabet Med 2009;26:45–52 [DOI] [PubMed] [Google Scholar]
- 19.Saito M, Marumo K. Collagen cross-links as a determinant of bone quality: a possible explanation for bone fragility in aging, osteoporosis, and diabetes mellitus. Osteoporos Int 2010;21:195–214 [DOI] [PubMed] [Google Scholar]
- 20.Hamada Y, Kitazawa S, Kitazawa R, Fujii H, Kasuga M, Fukagawa M. Histomorphometric analysis of diabetic osteopenia in streptozotocin-induced diabetic mice: a possible role of oxidative stress. Bone 2007;40:1408–1414 [DOI] [PubMed] [Google Scholar]
- 21.Lewiecki EM, Laster AJ. Clinical review: clinical applications of vertebral fracture assessment by dual-energy x-ray absorptiometry. J Clin Endocrinol Metab 2006;91:4215–4222 [DOI] [PubMed] [Google Scholar]