

Abstract
OBJECTIVE
Laboratory studies suggest that exposure to methylmercury at a level similar to those found in fish may induce pancreatic islet β-cell dysfunction. Few, if any, human studies have examined the association between mercury exposure and diabetes incidence. We examined whether toenail mercury levels are associated with incidence of diabetes in a large prospective cohort.
RESEACH DESIGN AND METHODS
A prospective cohort of 3,875 American young adults, aged 20–32 years, free of diabetes in 1987 (baseline), were enrolled and followed six times until 2005. Baseline toenail mercury levels were measured with instrumental neutron-activation analysis. Incident diabetes was identified by plasma glucose levels, oral glucose tolerance tests, hemoglobin A1C levels, and/or antidiabetes medications.
RESULTS
A total of 288 incident cases of diabetes occurred over 18 years of follow-up. In multivariate analyses adjusted for age, sex, ethnicity, study center, education, smoking status, alcohol consumption, physical activity, family history of diabetes, intakes of long-chain n-3 fatty acids and magnesium, and toenail selenium, toenail mercury levels were positively associated with the incidence of diabetes. The hazard ratio (95% CI) of incident diabetes compared the highest to the lowest quintiles of mercury exposure was 1.65 (1.07–2.56; P for trend = 0.02). Higher mercury exposure at baseline was also significantly associated with decreased homeostasis model assessment of β-cell function index (P for trend < 0.01).
CONCLUSIONS
Our results are consistent with findings from laboratory studies and provide longitudinal human data suggesting that people with high mercury exposure in young adulthood may have elevated risk of diabetes later in life.
Whereas type 2 diabetes mellitus is considered a lifestyle-mediated chronic disease, the importance of environmental risk factors of diabetes is increasingly recognized. Exposure to heavy metals may play a role in the induction or exacerbation of diabetes (1). Mercury is a widespread pollutant with high toxicity both for organic and inorganic forms. The major sources of mercury accumulation in humans result from methylmercury (MeHg) exposure from fish or seafood consumption and elemental mercury exposure from dental amalgam fillings (2). MeHg in particular has been linked to human health disorders including neurodevelopmental delays (3), immune system suppression (4), and cardiovascular dysfunction (5).
Mercury exposure, at levels similar to those found in fish, can induce oxidative stress and cause pancreatic islet β-cell dysfunction in experimental models (6–8), suggesting that mercury exposure may be a risk factor for diabetes. To the best of our knowledge, there are no longitudinal human studies that have investigated mercury exposure and diabetes risk. Therefore, we prospectively examined toenail mercury levels in relation to incidence of diabetes in a large cohort of American young adults over 18 years of follow-up using data from the Coronary Artery Risk Development in Young Adults (CARDIA) Study.
RESEARCH DESIGN AND METHODS
Study design
CARDIA is an ongoing, multicenter, prospective observational study to investigate the evolution of cardiovascular disease risk factors from young adulthood to midlife. In 1985 to 1986, 5,114 American young adults, aged 18–30 years, were recruited from four U.S. cities: Birmingham, AL; Chicago, IL; Minneapolis, MN; and Oakland, CA. The sampling scheme was designed to achieve a balance at each site by age (18–24 and 25–30 years), sex, ethnicity (African American and Caucasian), and education (high school degree or less and more than high school). Participants were followed every 2–5 years from 1985–2005. Detailed information on study design and recruitment protocol has been published (9).
Toenail clippings were provided by 4,362 CARDIA participants. The nail mass was too small to be used in 18 samples. Among 4,344 participants with toenail mercury data available, we excluded 31 participants with prevalent diabetes at baseline in 1987, 36 with no information on key covariates, 191 with insufficient information for defining incident diabetes during follow-up, and 211 women who were pregnant at any exam. A total of 3,875 participants remained in the analysis after these exclusions.
Assessment of toenail mercury
Toenail clippings were collected with a stainless-steel clipper from all 10 toes by the participants themselves during the clinical examination in 1987 and stored at ambient room temperature and humidity. All toenail clippings were processed with a washing procedure in a sonicator with deionized water. Toenail mercury concentrations were assessed by instrumental neutron-activation analysis at the University of Missouri-Columbia Research Reactor Center (10). Toenail clippings were assayed in random order by laboratory personnel blinded to other clinical measures. The limit of detection was 0.001 μg/g. The coefficient of variation of subsamples of clippings from the same participants was 6.8%. Duplicate samples of two different quality-control materials were introduced in 48 batches. The overall recovery rate was 101.2% (SE 2.5%).
Toenail mercury levels are recognized as excellent biomarkers of long-term MeHg exposure and have been used in epidemiological studies (11–13). A study found that Spearman correlation coefficient for the reproducibility of toenail levels of mercury was 0.54 over 6 years among 127 U.S. women (12).
Measurement of insulin, glucose, and hemoglobin A1C
Fasting blood samples were collected according to standardized CARDIA procedures and processed at central laboratories (9). Fasting plasma insulin was measured originally by a nonspecific insulin assay at baseline and in later examinations by a new radioimmunoassay (Linco Research Inc., St. Charles, MO). To assure comparability of insulin across examinations, sera stored from baseline was remeasured by the new assay 8 years later (14). The Pearson correlation of log insulin values for baseline by the original (15) and the new method (16) was 0.81. Fasting glucose was detected by hexokinase method on a Cobas Mira Plus chemistry analyzer (Roche Diagnostic Systems, Montclair, NJ) at each examination (14). Based on reassays of glucose in 2006 and 2007 in ∼200 samples per examination drawn at exam years 7, 10, 15, and 20 and of insulin in 100 samples stored since exam year 15, glucose and insulin were recalibrated to harmonize them with the previous measurements. Recalibrated glucose values were 6.98 + 0.94 × year 7 glucose concentrations, 7.15 + 0.96 × year 10 glucose concentration, 6.99 + 1.01 × year 15 glucose concentration, and 4.06 + 0.97 × year 20 glucose concentration. Recalibrated insulin was −0.36 + 0.93 × year 20 insulin concentration (17). Homeostasis model assessment (HOMA) of insulin resistance (HOMA-IR) was calculated as follows: glucose (mmol/L) × insulin (mU/L)/22.5. HOMA of β-cell function was computed as follows: (20 × insulin)/(glucose − 3.5) (18). Hemoglobin A1C was assessed using a Tosoh G7 high-performance liquid chromatography instrument (Tosoh Bioscience) at year 20. The interassay coefficients of variation were 2.0–3.0%.
Case identification
At any follow-up examination, participants with one or more of the following were determined to have incident diabetes: 1) fasting plasma glucose ≥7.0 mmol/L; 2) nonfasting plasma glucose ≥11.1 mmol/L; 3) postprandial 2-h plasma glucose ≥11.1 mmol/L from an oral glucose tolerance test (OGTT); 4) hemoglobin A1C ≥6.5%; or 5) reported use of antidiabetes medications, which were verified by medication names (19). We could not clearly distinguish diabetes type, because some participants were young at diagnosis and used insulin as treatment. Therefore, we used the term diabetes rather than type 2 diabetes, although presumably the great majority of participants had type 2 diabetes.
Assessment of covariates
Demographic variables, including age, sex, ethnicity and education level, were collected through a self-administered questionnaire and verified during clinic examinations. Smoking status was determined based on self-report, and participants were classified into five groups: never smokers, former smokers, and current smokers (0–4, 5–10, and ≥11 pack-year). Alcohol consumption was measured by a validated questionnaire and classified into four groups according to total daily intake: 0 (never drink), 0.1–9.9, 10.0–19.9, or ≥20 g/day. Body weight and height were measured in light clothes without shoes during the clinical examination. BMI was calculated as weight in kilograms divided by the square of height in meters. Three measurements of resting systolic and diastolic fifth-phase blood pressures were taken using a random-zero sphygmomanometer. The average of the second and third measurements was used in the analyses. Physical activity was assessed using the CARDIA Physical Activity History Questionnaire, an interviewer-administered self-report of frequency of participation in 13 categories of recreational sports, exercise, leisure, and occupational activities over the previous 12 months. The physical activity score was calculated in exercise units (EU) reflecting the frequency and duration of activity over the previous year. A score of 100 EU is roughly equivalent to participation in a vigorous activity 2 to 3 h/week for 6 months of the year (20–22). Family history of diabetes was defined as either mother or father having diabetes. Diet was assessed three times at baseline and years 7 and 20 with an interview-based diet history questionnaire. The evaluation of the dietary measurement was published previously (23,24).
Statistical analysis
Participants were divided into quintiles according to their toenail mercury levels. Group comparisons of baseline characteristics were performed using ANOVA, Kruskal-Wallis test, or χ2 test as appropriate. Cox proportional hazards models were used to estimate the hazard ratios (HRs) and 95% CIs of incident diabetes. Follow-up time was calculated as the difference between the baseline examination and the year in which diabetes was first identified, the year a participant was censored, or the end of the study. If a case was diagnosed prior to a visit and the exact date could not be determined, the follow-up time was assigned as the midpoint between the current and the previous visit. Because of limited literature, potential confounders were identified based mainly on statistical tests and our previous knowledge in studying mercury exposure and fish consumption in relation to other health end points. We considered several sequential models in the main analysis: model 1 adjusted for age, sex, ethnicity, and study center; model 2 additionally adjusted for BMI; model 3 further adjusted for other major lifestyle variables, including education, family history of diabetes, smoking status, alcohol consumption, and physical activity; and models 4–6 additionally adjusted for intake of long-chain n-3 polyunsaturated fatty acid fatty acids (LCn-3PUFAs), magnesium, and toenail selenium sequentially. These three nutrients were selected because they concentrate in fish (25) and have been related to diabetes risk (26). A continuous variable using the median mercury concentration in each quintile was created for trend tests. Moreover, we tested for possible interactions between toenail mercury levels and preidentified potential-effect modifiers by adding corresponding multiplicative interaction terms in the models, followed by the likelihood ratio test. We also stratified data according to these variables to determine whether they modified the associations. Furthermore, because the cutoff point of fasting glucose for defining diabetes was changed from 140 to 126 mg/dL in 1997, we used a cutoff point of 140 mg/dL at exam years before 1997 in a sensitivity analysis to test the robustness of our results.
In addition, we examined the association between toenail mercury concentrations and fasting insulin, glucose, HOMA-IR, and HOMA of β-cell function. A logarithmic transformation was used to improve the normality of the distribution of these parameters. Since fasting insulin and glucose were measured multiple times, generalized estimating equations with exchangeable correlation structure for simplicity were used. All analyses were performed with SAS (version 9.2; SAS Institute, Cary, NC). P ≤ 0.05 was considered statistically significant.
RESULTS
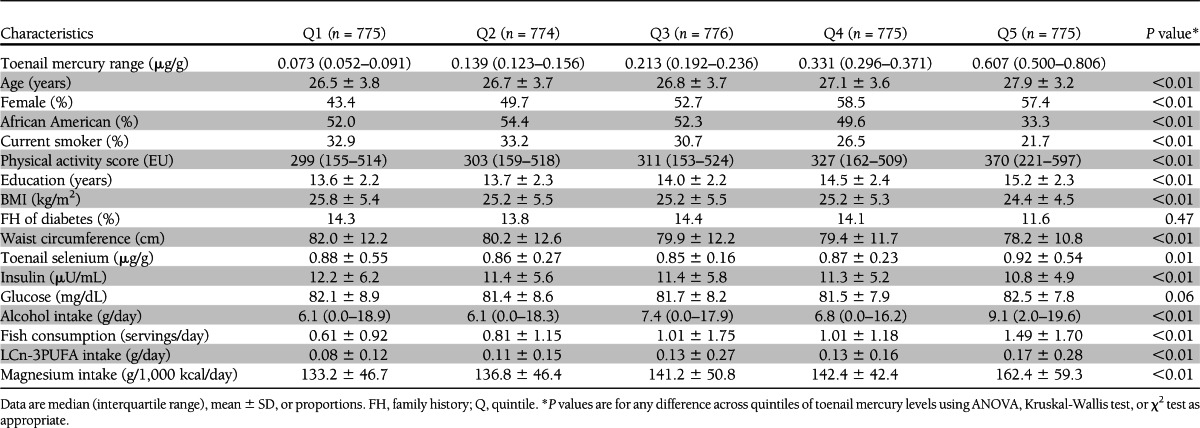
The median values of toenail mercury across quintiles were 0.073, 0.139, 0.213, 0.332, and 0.607 μg/g (Table 1). Compared with those in the lowest quintile of toenail mercury, participants in the highest quintile were slightly older, were more likely to be females and Caucasians, exercised more, had a higher education level, had higher toenail selenium levels, had lower BMI and waist circumference, were less likely to be current smokers, and had slightly lower fasting insulin levels. In addition, participants with higher mercury exposure consumed more alcohol, fish, LCn-3PUFAs, and magnesium.
Table 1.
Baseline characteristics by toenail mercury levels (quintiles): the CARDIA Trace Element Study, 1987–2005 (n = 3,875)
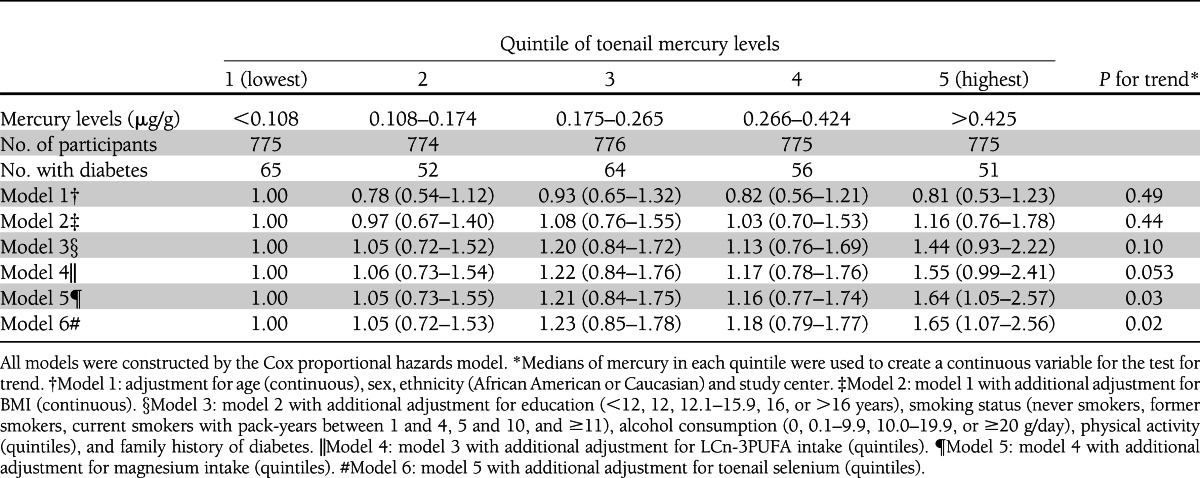
During the 18 years of follow-up, 288 participants developed diabetes, including 193 case subjects identified by fasting criteria and 3, 35, 25, and 32 case subjects determined by nonfasting glucose, 2-h glucose after OGTT, hemoglobin A1C, and antidiabetes medication use criteria, respectively. After adjustment for demographic and major lifestyle variables, especially BMI, a statistically nonsignificant positive association was found (Table 2). After further adjustment for intake of LCn-3PUFAs and magnesium and for toenail selenium, the observed positive association became statistically significant. Compared with those in the lowest quintile of toenail mercury levels, the fully adjusted HR (95% CI) for participants in the highest quintile was 1.65 (1.07–2.56; P for trend = 0.02).
Table 2.
Multivariable-adjusted HRs and 95% CIs of diabetes according to quintiles of toenail mercury levels
In sensitivity analyses, we considered other potential dietary and nondietary confounders in the analyses, we substituted waist circumference for BMI in the models, and we used different definitions of diabetes based on the time period of the examination. Our results were essentially the same as findings from the primary analysis (data not shown).
In stratified analyses according to a few prespecified factors, the observed association between mercury exposure and diabetes risk was not appreciably modified by sex, BMI (normal weight or overweight), ethnicity (African American or Caucasian), or selenium concentration (below or above median). Intake of LCn-3PUFAs or magnesium above the median appeared to attenuate the potential effect of mercury exposure on diabetes risk (data not shown). Nonetheless, the tests for interactions were only marginally significant (P for interaction is 0.08 for LCn-3PUFAs and 0.15 for magnesium).
To explore the potential mechanisms, we investigated the associations between toenail mercury concentrations and fasting plasma glucose and insulin levels and HOMA-IR score, as well as HOMA of β-cell function index, excluding those under diabetes treatment and those whose fasting time was <8 h (Fig. 1). Higher mercury exposure was associated with elevated fasting glucose and insulin levels, increased HOMA-IR, and decreased HOMA of β-cell function index, but only the association with HOMA of β-cell function index showed a significant linear trend.
Figure 1.

Multivariable-adjusted associations between toenail mercury levels and fasting glucose and insulin levels, HOMA-IR, and HOMA of β-cell function (HOMA-β). Participants were excluded if they were on diabetes medication and fasting levels were <8 h. All of the models were constructed by using generalized estimating equations. Results were adjusted for the covariates listed for model 6 in Table 2 plus measurement occasions (indictor variables) and baseline values of outcome of interest (continuous). (A high-quality color representation of this figure is available in the online issue.)
CONCLUSIONS
In this prospective cohort study, mercury exposure measured in toenails was associated with increased incidence of diabetes in a dose-response manner among American young adults. This association was evident only after adjustment for demographic, major lifestyle, and dietary factors, particularly BMI and intake of long-chain n-3 fatty acid and magnesium. Results from this study also suggest that high mercury exposure may be associated with pancreatic islet β-cell dysfunction.
Our findings are supported by experimental studies. Both in vitro and in vivo studies (6,7) found that MeHg exposure, at a level similar to that in some seafood, significantly decreased cell viability in the pancreatic β-cell line and caused pancreatic islet β-cell dysfunction, which may lead to diabetes development (1). In particular, laboratory studies demonstrated that islet β-cell function and survival was affected by mercury exposure through an oxidative stress pathway (6,7). In mouse models, even low-dose mercury exposure caused pancreatic islet β-cell dysfunction by inducing oxidative stress and phosphatidylinositol 3-kinase activation (7). Also, MeHg was observed to induce oxidative stress–triggered β-cell apoptosis and death (6). In addition, a study found that 8-hydroxy-2’-deoxyguanosine, a biomarker of oxidative DNA damage, was significantly higher in urine samples of mercury-exposed persons compared with control subjects (27).
Human data relating mercury exposure to diabetes are sparse, and the results were contradictory. A study conducted in Japan reported that mercury levels in hair from patients including patients with diabetes were considerably higher than that of healthy people of the same age groups (28). This finding was in agreement with results from studies conducted in Turkey (29) and Mexico (30), but was not consistent with another Japanese survey in which the prevalence of diabetes among people living in an MeHg-polluted area was not increased (31). In a recent study conducted in Taiwan (32), blood mercury concentrations were significantly associated with HOMA-IR and HOMA of β-cell function index. In addition, a study conducted in Korea reported that hair mercury levels in patients with metabolic syndrome were significantly higher than those in normal control subjects (33). Data from Western countries are not available. Our investigation provides evidence from a human study supporting that mercury exposure at young adulthood may be longitudinally associated with increased risk of diabetes and pancreatic islet β-cell dysfunction.
Of note, MeHg is a major contaminant in some fish, and toenail mercury concentration is generally correlated with fish consumption. While LCn-3PUFAs, largely derived from fish consumption, are considered to be the key nutrients responsible for the potential benefits of fish intake, fish is also a good dietary source of selenium and magnesium. It is likely that the overall health impact of fish consumption may reflect the interactions of nutrients and contaminants in fish (34). Thus, studying any of these nutrients and contaminants such as mercury should consider confounding from other components in fish. In the current study, the association between mercury exposure and diabetes incidence was substantially strengthened after controlling for intake of LCn-3PUFAs and magnesium. Although the existing literature is inconsistent, some studies suggest that LCn-3PUFAs are beneficial to glucose metabolism (35,36), which may lead to reduced risk of diabetes. In addition, a body of evidence suggests that magnesium intake is significantly inversely related to diabetes risk (26). Hence, a possible association between mercury exposure and risk of diabetes can be attenuated or masked by LCn-3PUFAs and/or magnesium and vice versa. Recent meta-analyses found that fish consumption was not associated with risk of diabetes (37,38). However, none of the primary studies considered mercury contamination. Thus, the possibility of a null association between fish and diabetes biased by mercury exposure could not be excluded. Moreover, the association between selenium and diabetes is still not quite clear. In the current study, further adjustment for selenium levels did not materially change the observed association.
In addition to a large cohort of young adults and a long-term prospective follow-up period, a few strengths of our study need to be highlighted. Mercury exposure was measured in toenails using instrumental neutron-activation analysis, which is considered as a reliable objective biomarker reflecting relatively long-term exposure (12,13). Also, we defined diabetes cases based mainly on fasting and postprandial glucose levels from an OGTT and hemoglobin A1C measurements in addition to a self-reported questionnaire. Furthermore, we longitudinally measured fasting insulin levels, which enable us to calculate HOMA-IR and HOMA of β-cell function over 18 years of follow-up and explore potential pathophysiological mechanisms linking mercury exposure to diabetes risk.
Similar to other observational studies, the possibility of confounding from unknown or unmeasured factors including other pollutants (e.g., polychlorinated biphenyl) cannot be completely excluded. However, the likelihood should be small that our results were largely explained by confounding, given our extensive data analysis, consistent findings in sensitivity analyses, and the supportive biological mechanisms. In fact, the baseline data indicated that participants in the highest quintile of toenail mercury levels, presumably due to higher fish consumption, had a relatively healthy lifestyle. For example, they had lower BMI and waist circumference, exercised more, and were less likely to be current smokers. In addition, our capability to further explore the effect modifications was limited by the relatively small number of cases. Finally, the generalizability may be limited since the young adult cohort was recruited from urban areas. However, there is little evidence that biological effects of MeHg in this study population would be different from those in the general population.
In summary, this prospective cohort study provides evidence supporting that high mercury exposure may affect pancreatic islet β-cell function and lead to elevated risk of diabetes among American young adults. The potential adverse effect of mercury exposure, presumably derived from diet, may be attenuated by other nutrients, in particular LCn-3PUFAs and magnesium.
Acknowledgments
This study was supported by grant R01-HL-081572. CARDIA was supported by grants N01-HC-48047, N01-HC-48048, N01-HC-48049, N01-HC-48050, and N01-HC-95095 from the National Heart, Lung, and Blood Institute.
No potential conflicts of interest relevant to this article were reported.
K.H. came up with the concept and design, researched the data, wrote the manuscript, and reviewed and edited the manuscript. P.X. researched the data, prepared the tables and figures, contributed to the discussion, and reviewed and edited the manuscript. K.L., S.M., J.R., and E.G. contributed to the discussion and reviewed and edited the manuscript. All authors have read and approved the final version of the manuscript. K.H. is the guarantor of this work and, as such, had full access to all the data in the study and takes responsibility for the integrity of the data and the accuracy of the data analysis.
The authors thank Dr. Carmen Alicia Peralta (Division of Nephrology, Department of Medicine, University of California at San Francisco, San Francisco, CA) for helpful comments and Dr. Winston Hwanseok Choi (Division of Preventive Medicine, Department of Medicine, University of Alabama at Birmingham, Birmingham, AL) for verifying SAS programming. The authors also thank the other investigators and the staff of the CARDIA Study for valuable contributions.
References
- 1.Chen YW, Yang CY, Huang CF, Hung DZ, Leung YM, Liu SH. Heavy metals, islet function and diabetes development. Islets 2009;1:169–176 [DOI] [PubMed] [Google Scholar]
- 2.Selin NE, Sunderland EM, Knightes CD, Mason RP. Sources of mercury exposure for U.S. seafood consumers: implications for policy. Environ Health Perspect 2010;118:137–143 [DOI] [PMC free article] [PubMed] [Google Scholar]
- 3.Castoldi AF, Johansson C, Onishchenko N, et al. Human developmental neurotoxicity of methylmercury: impact of variables and risk modifiers. Regul Toxicol Pharmacol 2008;51:201–214 [DOI] [PubMed] [Google Scholar]
- 4.Vas J, Monestier M. Immunology of mercury. Ann N Y Acad Sci 2008;1143:240–267 [DOI] [PubMed] [Google Scholar]
- 5.Houston MC. Role of mercury toxicity in hypertension, cardiovascular disease, and stroke. J Clin Hypertens (Greenwich) 2011;13:621–627 [DOI] [PMC free article] [PubMed] [Google Scholar]
- 6.Chen YW, Huang CF, Tsai KS, et al. Methylmercury induces pancreatic beta-cell apoptosis and dysfunction. Chem Res Toxicol 2006;19:1080–1085 [DOI] [PubMed] [Google Scholar]
- 7.Chen YW, Huang CF, Tsai KS, et al. The role of phosphoinositide 3-kinase/Akt signaling in low-dose mercury-induced mouse pancreatic beta-cell dysfunction in vitro and in vivo. Diabetes 2006;55:1614–1624 [DOI] [PubMed] [Google Scholar]
- 8.Chen YW, Huang CF, Yang CY, Yen CC, Tsai KS, Liu SH. Inorganic mercury causes pancreatic beta-cell death via the oxidative stress-induced apoptotic and necrotic pathways. Toxicol Appl Pharmacol 2010;243:323–331 [DOI] [PubMed] [Google Scholar]
- 9.Friedman GD, Cutter GR, Donahue RP, et al. CARDIA: study design, recruitment, and some characteristics of the examined subjects. J Clin Epidemiol 1988;41:1105–1116 [DOI] [PubMed] [Google Scholar]
- 10.Cheng TP, Morris JS, Koirtyohann SR. The analysis of human nails for 24 elements via k0 and cyclic neutron activation analysis. Nucl Inst Methods Phys Res 1994;353:457–460 [Google Scholar]
- 11.Yoshizawa K, Rimm EB, Morris JS, et al. Mercury and the risk of coronary heart disease in men. N Engl J Med 2002;347:1755–1760 [DOI] [PubMed] [Google Scholar]
- 12.Garland M, Morris JS, Rosner BA, et al. Toenail trace element levels as biomarkers: reproducibility over a 6-year period. Cancer Epidemiol Biomarkers Prev 1993;2:493–497 [PubMed] [Google Scholar]
- 13.He K. Trace elements in nails as biomarkers in clinical research. Eur J Clin Invest 2011;41:98–102 [DOI] [PMC free article] [PubMed] [Google Scholar]
- 14.Folsom AR, Jacobs DR, Jr, Wagenknecht LE, et al. Increase in fasting insulin and glucose over seven years with increasing weight and inactivity of young adults. The CARDIA Study. Coronary Artery Risk Development in Young Adults. Am J Epidemiol 1996;144:235–246 [DOI] [PubMed] [Google Scholar]
- 15.Herbert V, Lau KS, Gottlieb CW, Bleicher SJ. Coated charcoal immunoassay of insulin. J Clin Endocrinol Metab 1965;25:1375–1384 [DOI] [PubMed] [Google Scholar]
- 16.Haffner SM, Bowsher RR, Mykkänen L, et al. Proinsulin and specific insulin concentration in high- and low-risk populations for NIDDM. Diabetes 1994;43:1490–1493 [DOI] [PubMed] [Google Scholar]
- 17.Park K, Lee DH, Erickson DJ, Himes JH, Shikany JM, Jacobs DR., Jr Association of long-term change in waist circumference with insulin resistance. Obesity (Silver Spring) 2010;18:370–376 [DOI] [PMC free article] [PubMed] [Google Scholar]
- 18.Matthews DR, Hosker JP, Rudenski AS, Naylor BA, Treacher DF, Turner RC. Homeostasis model assessment: insulin resistance and beta-cell function from fasting plasma glucose and insulin concentrations in man. Diabetologia 1985;28:412–419 [DOI] [PubMed] [Google Scholar]
- 19.American Diabetes Association Diagnosis and classification of diabetes mellitus. Diabetes Care 2011;34(Suppl.1):S62–S69 [DOI] [PMC free article] [PubMed] [Google Scholar]
- 20.Jacobs DR, Jr, Ainsworth BE, Hartman TJ, Leon AS. A simultaneous evaluation of 10 commonly used physical activity questionnaires. Med Sci Sports Exerc 1993;25:81–91 [DOI] [PubMed] [Google Scholar]
- 21.Pereira MA, FitzerGerald SJ, Gregg EW, et al. A collection of Physical Activity Questionnaires for health-related research. Med Sci Sports Exerc 1997;29(Suppl.):S1–S205 [PubMed] [Google Scholar]
- 22.Schmitz KH, Jacobs DR, Jr, Leon AS, Schreiner PJ, Sternfeld B. Physical activity and body weight: associations over ten years in the CARDIA study. Coronary Artery Risk Development in Young Adults. Int J Obes Relat Metab Disord 2000;24:1475–1487 [DOI] [PubMed] [Google Scholar]
- 23.McDonald A, Van Horn L, Slattery M, et al. The CARDIA dietary history: development, implementation, and evaluation. J Am Diet Assoc 1991;91:1104–1112 [PubMed] [Google Scholar]
- 24.Liu K, Slattery M, Jacobs D, Jr, et al. A study of the reliability and comparative validity of the cardia dietary history. Ethn Dis 1994;4:15–27 [PubMed] [Google Scholar]
- 25.USDA National Nutrient Database for Standard Reference. Release 18 [article online], 2011. Available from http://www.ars.usda.gov/services/docs.htm?docid=9673 Accessed 9 September 2012
- 26.Dong JY, Xun P, He K, Qin LQ. Magnesium intake and risk of type 2 diabetes: meta-analysis of prospective cohort studies. Diabetes Care 2011;34:2116–2122 [DOI] [PMC free article] [PubMed] [Google Scholar]
- 27.Chen C, Qu L, Li B, et al. Increased oxidative DNA damage, as assessed by urinary 8-hydroxy-2′-deoxyguanosine concentrations, and serum redox status in persons exposed to mercury. Clin Chem 2005;51:759–767 [DOI] [PubMed] [Google Scholar]
- 28.Nakagawa R. Concentration of mercury in hair of diseased people in Japan. Chemosphere 1995;30:135–140 [DOI] [PubMed] [Google Scholar]
- 29.Serdar MA, Bakir F, Haşimi A, et al. Trace and toxic element patterns in nonsmoker patients with noninsulin-dependent diabetes mellitus, impaired glucose tolerance, and fasting glucose. Int J Diabetes Dev Ctries 2009;29:35–40 [DOI] [PMC free article] [PubMed] [Google Scholar]
- 30.Flores CR, Puga MP, Wrobel K, Garay Sevilla ME, Wrobel K. Trace elements status in diabetes mellitus type 2: possible role of the interaction between molybdenum and copper in the progress of typical complications. Diabetes Res Clin Pract 2011;91:333–341 [DOI] [PubMed] [Google Scholar]
- 31.Futatsuka M, Kitano T, Wakamiya J. An epidemiological study on diabetes mellitus in the population living in a methyl mercury polluted area. J Epidemiol 1996;6:204–208 [DOI] [PubMed] [Google Scholar]
- 32.Chang JW, Chen HL, Su HJ, Liao PC, Guo HR, Lee CC. Simultaneous exposure of non-diabetics to high levels of dioxins and mercury increases their risk of insulin resistance. J Hazard Mater 2011;185:749–755 [DOI] [PubMed] [Google Scholar]
- 33.Park SB, Choi SW, Nam AY. Hair tissue mineral analysis and metabolic syndrome. Biol Trace Elem Res 2009;130:218–228 [DOI] [PubMed] [Google Scholar]
- 34.He K. Fish, long-chain omega-3 polyunsaturated fatty acids and prevention of cardiovascular disease—eat fish or take fish oil supplement? Prog Cardiovasc Dis 2009;52:95–114 [DOI] [PubMed] [Google Scholar]
- 35.Storlien LH, Kraegen EW, Chisholm DJ, Ford GL, Bruce DG, Pascoe WS. Fish oil prevents insulin resistance induced by high-fat feeding in rats. Science 1987;237:885–888 [DOI] [PubMed] [Google Scholar]
- 36.Ajiro K, Sawamura M, Ikeda K, et al. Beneficial effects of fish oil on glucose metabolism in spontaneously hypertensive rats. Clin Exp Pharmacol Physiol 2000;27:412–415 [DOI] [PubMed] [Google Scholar]
- 37.Xun P, He K. Fish Consumption and Incidence of Diabetes: meta-analysis of data from 438,000 individuals in 12 independent prospective cohorts with an average 11-year follow-up. Diabetes Care 2012;35:930–938 [DOI] [PMC free article] [PubMed] [Google Scholar]
- 38.Wallin A, Di Giuseppe D, Orsini N, Patel PS, Forouhi NG, Wolk A. Fish consumption, dietary long-chain n-3 fatty acids, and risk of type 2 diabetes: systematic review and meta-analysis of prospective studies. Diabetes Care 2012;35:918–929 [DOI] [PMC free article] [PubMed] [Google Scholar]