

Abstract
OBJECTIVE
Ethnic differences in type 2 diabetes risk between South Asians and white Europeans originate before adult life and are not fully explained by higher adiposity levels in South Asians. Although metabolic sensitivity to adiposity may differ between ethnic groups, this has been little studied in childhood. We have therefore examined the associations among adiposity, insulin resistance, and glycemia markers in children of different ethnic origins.
RESEARCH DESIGN AND METHODS
Cross-sectional study of 4,633 9- to 10-year-old children (response rate 68%) predominantly of South Asian, black African-Caribbean, and white European origin (n = 1,266, 1,176, and 1,109, respectively) who had homeostasis model assessments of insulin resistance (HOMA-IR), glycemia markers (HbA1c and fasting glucose), and adiposity (BMI, waist circumference, skinfold thicknesses, and bioimpedance [fat mass]).
RESULTS
All adiposity measures were positively associated with HOMA-IR in all ethnic groups, but associations were stronger among South Asians compared to black African-Caribbeans and white Europeans. For a 1-SD increase in fat mass percentage, percentage differences in HOMA-IR were 37.5% (95% CI 33.3–41.7), 29.7% (25.8–33.8), and 27.0% (22.9–31.2), respectively (P interaction < 0.001). All adiposity markers were positively associated with HbA1c in South Asians and black African-Caribbeans but not in white Europeans; for a 1-SD increase in fat mass percentage, percentage differences in HbA1c were 0.04% (95% CI 0.03–0.06), 0.04% (0.02–0.05), and 0.02% (−0.00 to 0.04), respectively (P interaction < 0.001). Patterns for fasting glucose were less consistent.
CONCLUSIONS
South Asian children are more metabolically sensitive to adiposity. Early prevention or treatment of childhood obesity may be critical for type 2 diabetes prevention, especially in South Asians.
The prevalence of type 2 diabetes has been rising, both in the U.K. population (1) and worldwide (2,3). In the U.K., there are marked ethnic differences in the risks of type 2 diabetes, which are particularly high among South Asians and to a lesser extent black African-Caribbeans (4); increased type 2 diabetes risks are also apparent in these ethnic groups in the U.S. (5,6). Recent evidence suggests that ethnic differences in risks of type 2 diabetes are apparent in childhood, with higher levels of insulin resistance (a key precursor of type 2 diabetes), glycated hemoglobin (HbA1c), and (less consistently) fasting blood glucose concentrations observed in U.K. South Asians and to a lesser extent black African-Caribbeans compared with white Europeans by the age of 10 years (7).
Excess body fat (adiposity) is an important independent risk factor for the development of type 2 diabetes and insulin resistance both in adults (8,9) and children (10). However, the role of adiposity in these ethnic differences in type 2 diabetes is complex. In South Asian adults, it is well-recognized that BMI underestimates adiposity (11) and that body fat levels (particularly of central body fat) are higher than those of white Europeans (10,12–14). However, in most studies, adjusting for the higher body fat levels (usually assessed using skinfold thickness or waist and hip circumferences) has not accounted for the higher risks of diabetes and insulin resistance observed in South Asians (13,15–17). It has also been observed that the risks of diabetes, insulin resistance, and cardiovascular disease emerge at lower levels of adiposity (particularly BMI) in South Asian populations and that their associations with adiposity are stronger than those in white Europeans (13,17). We have previously shown in U.K. South Asian children that higher insulin and HbA1c levels do not appear to be explained by higher adiposity levels (7,18). In a preliminary study, we also showed that insulin resistance in U.K. South Asian children may be more sensitive to adiposity than in white Europeans (18). However, this latter observation needs to be substantiated in larger scale studies in which insulin resistance, glycemia marker levels, and a range of adiposity markers are assessed in children from the relevant ethnic groups.
We have therefore examined the cross-sectional associations among adiposity, insulin resistance, and glycemia markers in a study of ∼5,000 children of South Asian and white European origin aged 9 to 10 years; we also report on associations among children of black African-Caribbean origin. We hypothesized that metabolic sensitivity to adiposity would be greater in South Asians than white Europeans. Several adiposity markers were assessed, including measures based on skinfold thickness and bioimpedance, which provide robust measures of adiposity in this multiethnic population (19), as well as BMI and waist circumference. We have also included data on leptin, an adipokine with circulating levels that are strongly correlated with total body fat percentage (20). Because other studies have suggested that lower lean mass may be an important determinant of insulin resistance in young South Asian men (21), we also report on the influence of fat-free mass (FFM) on insulin resistance and glycemia.
RESEARCH DESIGN AND METHODS
The Child Heart and Health Study in England (CHASE) is an investigation into the health of 9- to 10-year-old British school children of South Asian, black African-Caribbean, and white European origin. Methods have been described elsewhere (7). Ethical approval was obtained from the relevant Multicentre Research Ethics Committee. The study was carried out between October 2004 and February 2007 in a sample of 200 state primary schools within London, Birmingham, and Leicester. These included 100 schools with a high proportion (20–80%) of pupils of South Asian origin, stratified to include balanced numbers of schools with a high proportion of Indian, Pakistani, and Bangladeshi origin and 100 schools with a high proportion (20–80%) of pupils of black African-Caribbean origin, and stratified to include balanced numbers of schools with high proportions of black African and black Caribbean origin. In all, 70% of schools initially approached agreed to participate and those that did not were replaced by a school in the same borough with a similar ethnic composition. Parents or guardians were sent invitation letters (translated where necessary), and informed written consent was obtained for all children participating in the study.
Physical measurements and blood analytes
A single survey team including three trained research nurses carried out all measurements; each observer measured approximately one-third of all children in each ethnic group. All observers were trained in measurement techniques at the start of the study and reviewed at intervals throughout data collection. Height was measured to the last complete millimeter using a portable stadiometer (Chasmors Ltd, London, U.K.). Weight was measured to the nearest 0.1 kg using an electronic digital scale (Tanita Inc, Tokyo, Japan). Waist circumference was measured to the last complete millimeter at the midpoint between the lower margin of the ribs and the pelvic crest in the midaxillary line. Skinfold thickness was measured in subscapular, suprailiac, biceps, and triceps locations using a Holtain skinfold caliper (Chasmors Ltd, London, U.K.); the sum of skinfolds was used in analyses. Leg to arm bioimpedance was measured using the Bodystat 1500 bioimpedance monitor (Bodystat Ltd, Isle of Man, U.K.); the validity of FFM (and fat mass) using this instrument has previously been demonstrated in children of this age group (22,23). FFM was obtained using an equation derived for children of a similar age using dual energy X-ray absorptiometry validation (22) and fat mass by subtraction. Fat mass percentage was calculated as a proportion of body weight. Observers assessed pubertal status in girls using the Tanner breast development scoring system with participants in light clothing (24).
A blood sample was collected after overnight fasting. Whole blood was sent overnight to the Department of Clinical Biochemistry, Newcastle Hospitals NHS Trust, for analysis. Serum and plasma samples were separated immediately after collection and frozen on dry ice. All laboratory analyses were carried out blind to participant ethnicity. Glucose was measured in plasma using the hexokinase method. HbA1c was measured in whole blood by ion-exchange high-performance liquid chromatography; HbA1c values were recalculated to adjust for abnormal hemoglobin variants or for increased amounts of normal variant fetal hemoglobin where present (in 15% of black African-Caribbeans and in <1% of white Europeans and South Asians). Insulin was measured in serum in the Department of Medicine, University of Newcastle, U.K., using an ELISA method, which does not cross-react with proinsulin (25). The homeostasis model assessment (HOMA) equations were used to provide an estimate of insulin resistance (HOMA-IR) (26). Serum leptin was measured by an in-house radioimmunoassay validated against the commercially available Linco assay at the BHF Glasgow Cardiovascular Research Centre, University of Glasgow (27).
Ethnic origin
The ethnic origin of participating children was primarily defined using the parental self-reported ethnicity of both parents where available or using parental information on the ethnicity of the child. In a small number of children (1% of participants), for whom this information was not available, ethnic origin was defined using self-reported information by the child on their parental and grandparental place of birth, cross-checked with observer assessment of ethnicity. Children were defined as white European, South Asian, black African-Caribbean, or other ethnic origin. White European includes children whose ethnic origin was defined as white British, white Irish, and white European (or a combination of these) and excludes white Other. South Asian includes Indian, Pakistani, Bangladeshi, and Sri Lankan (or a combination of these). Black African-Caribbean includes black African, black Caribbean, black British, and black Other (or a combination of these). The other ethnic group includes all other categories of individual and those of mixed ethnic origin; for example, Asian other, white/black African, white/black Caribbean, and white/Asian.
Statistical methods
Statistical analyses were carried out using STATA/SE software (Stata/SE 12 for Windows; StataCorp LP, College Station, TX). Variables were checked for normality and log-transformed where appropriate. Adjusted means were obtained using multilevel linear regression modeling in which school was fitted as a random effect (to take account of the clustering of children within school); sex, age quartiles, and month were fitted as fixed effects throughout. Likelihood ratio tests were used to test for heterogeneity in association with sex and ethnicity. The strengths of associations between adiposity and metabolic markers are presented as percentage differences in metabolic markers (HOMA-IR and fasting glucose log-transformed, HbA1c untransformed) per SD increase in adiposity measure in order to assess the strength of association of each adiposity marker on a standardized scale. For most adiposity markers, associations with metabolic risk markers were linear, except those for leptin, which (as is common practice) was log-transformed in analyses. Differences in the associations by ethnicity were tested for by including an interaction term between ethnicity and the adiposity measure. Due to the presence of significant differences between boys and girls in the strength of association between metabolic risk markers and adiposity markers (including FFM), an additional interaction term between adiposity and sex was added to models examining ethnic differences in associations. The shapes of these associations by ethnicity are presented as graphs of metabolic risk markers by quintiles of adiposity marker (including FFM and height). Additional analyses were carried out to determine whether the associations examined were affected by adjustment for height and pubertal status.
RESULTS
Among 8,641 children invited, 5,887 took part (68%), of whom 5,004 (85%) provided fasting blood samples. After exclusion of 7 children with type 1 diabetes, analyses were based on 4,633 children (2,237 boys and 2,396 girls) with complete measurements of adiposity and blood markers. Participation rates were similar for white Europeans, South Asians, and other ethnicity (69, 72, and 70%, respectively) but slightly lower for black African-Caribbeans (66%); participant numbers for children of white European, South Asian, black African-Caribbean, and other ethnicity were similar (n = 1,109, 1,266, 1,176, and 1,082, respectively). All adiposity markers were strongly correlated with each other and with height, which was strongly correlated with BMI (r = 0.39), waist circumference (r = 0.48), sum of skinfolds (r = 0.33), fat mass percentage (r = 0.28), and fat mass (r = 0.47). Height was also strongly correlated with FFM (r = 0.82).
Characteristics of study participants
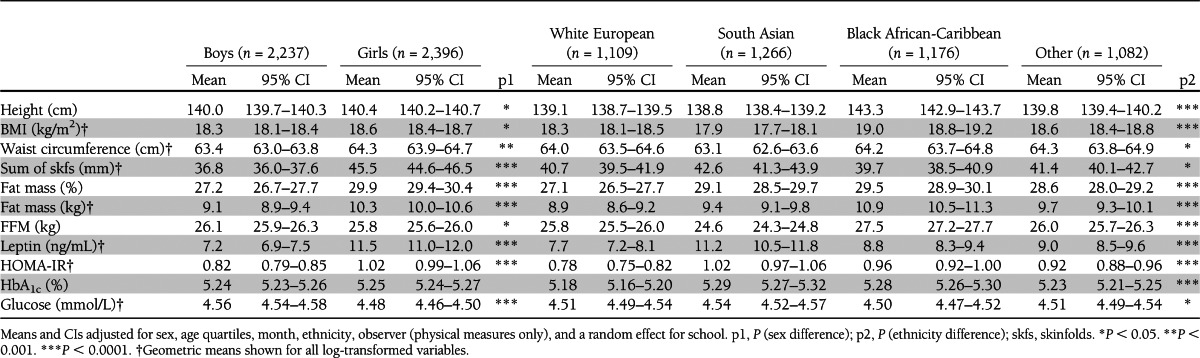
Summary characteristics of study participants are shown in Table 1, overall and separately by sex and ethnicity. Girls were taller and had higher mean levels of adiposity markers than boys (including BMI, waist circumference, sum of skinfolds, fat mass, fat mass percentage, and leptin), although a lower mean FFM. They also had a higher mean HOMA-IR than boys, though HbA1c was similar and fasting glucose lower. There were appreciable ethnic differences in height, adiposity, FFM, HOMA-IR, HbA1c, and fasting glucose. Black African-Caribbeans were appreciably taller than white Europeans and South Asians. Mean levels of BMI, waist circumference, and FFM were highest among black African-Caribbeans, intermediate among white Europeans, and lowest among South Asians. However, South Asians and black African-Caribbeans had higher levels of fat mass and fat mass percentage than white Europeans. Mean sum of skinfolds was higher among South Asians and similar in black African-Caribbeans and white Europeans. Mean leptin was highest among South Asians, intermediate in black African-Caribbeans, and lowest in white Europeans. South Asians had the highest mean levels of HOMA-IR, HbA1c, and fasting glucose; black African-Caribbeans had intermediate HOMA-IR and HbA1c levels, though fasting glucose levels were similar to white Europeans.
Table 1.
Body size, adiposity, and metabolic risk markers by sex and ethnic group
Adiposity markers, HOMA-IR, HbA1c, and glucose: by sex
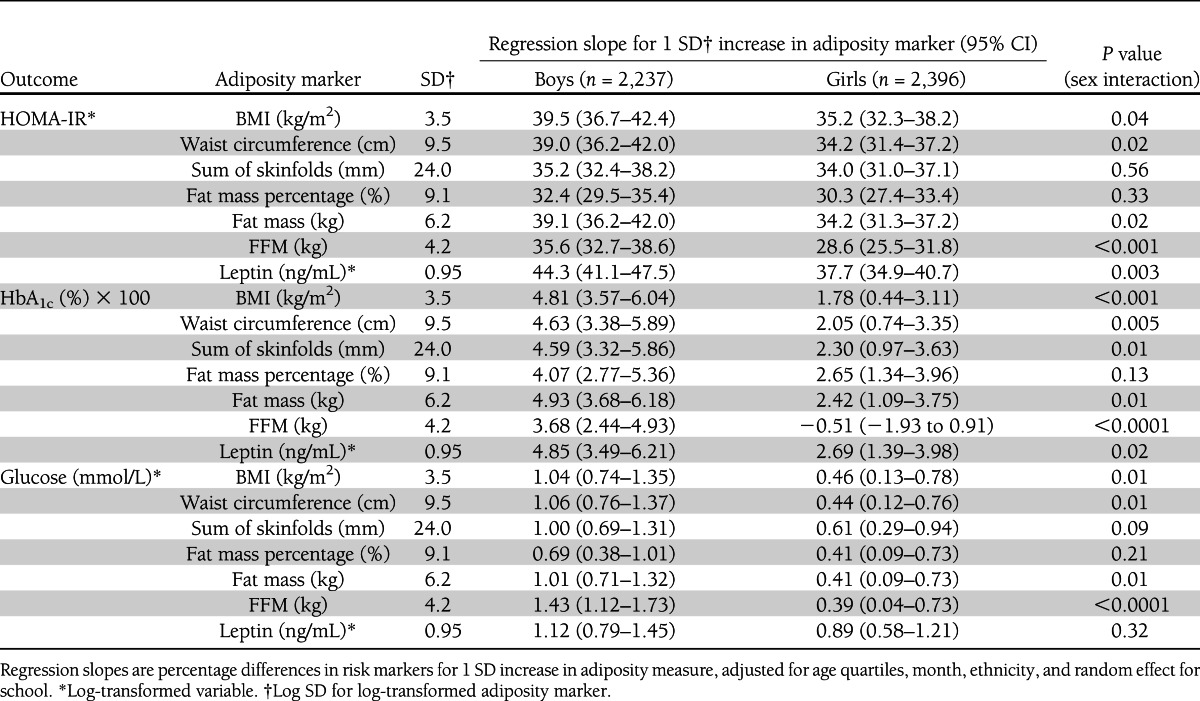
The associations between adiposity markers and insulin resistance, HbA1c, and fasting glucose, expressed as percentage differences for 1 SD increase in adiposity markers, are shown for boys and girls separately in Table 2. All adiposity markers and FFM shown were positively associated with insulin resistance, HbA1c, and fasting glucose, with the exception of FFM and HbA1c in girls. The strengths of association for BMI, waist circumference, sum of skinfolds, fat mass percentage, fat mass, FFM, and leptin were generally quite similar within each sex. However, several of these associations, particularly those for BMI, waist circumference, fat mass, FFM, and leptin, were stronger in boys than girls.
Table 2.
Associations between adiposity and metabolic risk markers by sex
Adiposity markers, HOMA-IR, HbA1c, and glucose: by ethnic group
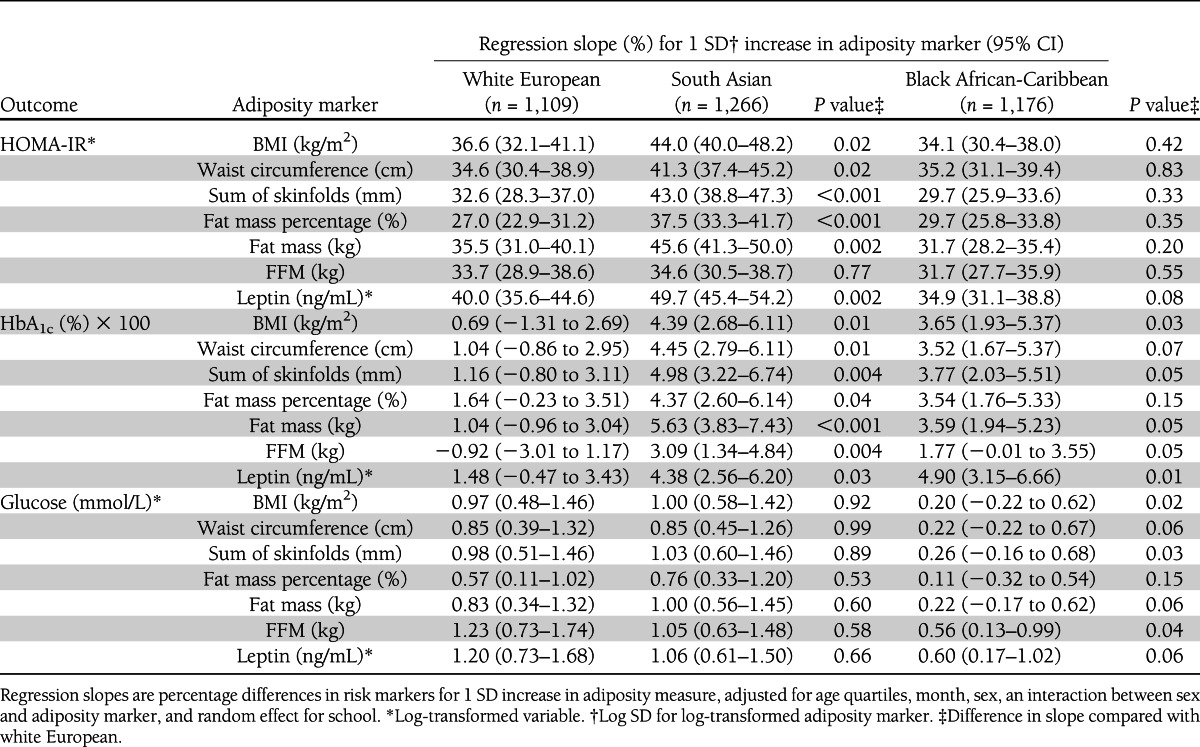
Associations among adiposity, insulin resistance, and circulating glycemia markers are shown separately for different ethnic groups in Table 3 and Supplementary Fig. 1, in analyses that allow for the sex difference in adiposity–metabolic marker associations described above, with the inclusion of an interaction term between sex and adiposity marker. In the case of HOMA-IR, positive associations with adiposity markers were apparent in all ethnic groups. However, the slopes relating adiposity markers and HOMA-IR were steeper by between 20 and 40% in South Asians compared with white Europeans; these differences (most marked for sum of skinfolds and fat mass percentage) were statistically significant for all adiposity markers. Associations in black African-Caribbeans were similar to those in white Europeans for all adiposity markers. In the case of HbA1c, both South Asians and black African-Caribbeans showed positive associations for all adiposity markers, whereas white Europeans showed little or no consistent associations with adiposity. Differences between South Asians and white Europeans were statistically significant for all adiposity markers, whereas differences between black African-Caribbeans and white Europeans were statistically significant for BMI and leptin only. Fasting glucose showed a less consistent pattern, with positive associations with adiposity markers of a similar strength among South Asians and white Europeans. Black African-Caribbeans, in contrast, showed little or no association between adiposity markers and fasting glucose, though statistically significant differences from white Europeans were apparent only for BMI and sum of skinfolds. These patterns are illustrated in Supplementary Fig. 1, which shows the associations between adiposity and insulin resistance, HbA1c, and fasting glucose separately for different ethnic groups plotted in fifths of each adiposity marker. The differences in HOMA-IR between South Asians and white Europeans are apparent even at low levels of adiposity and tend to become more marked at higher levels of adiposity (Supplementary Fig. 1A). Similarly, the differences in HbA1c between both South Asians and black African-Caribbeans and white Europeans were apparent at low levels of adiposity and became more marked at higher adiposity levels. Among white Europeans, there was no appreciable increase in HbA1c with increases in any adiposity marker (Supplementary Fig. 1B). Patterns for fasting glucose were less consistent, though differences in glucose level among Black African-Caribbeans, South Asians, and white Europeans tended to increase at higher levels of adiposity (Supplementary Fig. 1C). Additional analysis of associations stratified by sex showed mostly similar patterns in boys and girls, although less consistently statistically significant. The ethnic differences in associations among adiposity, HOMA-IR, HbA1c, and fasting glucose were little affected by adjustment for pubertal status in girls (data not presented).
Table 3.
Associations between metabolic risk markers and adiposity by ethnicity
FFM, height, HOMA-IR, HbA1c, and glucose: by ethnic group
The associations among FFM, insulin resistance, and glycemia markers were also examined (Table 3 and Supplementary Fig. 1). FFM was positively associated with insulin resistance, to a similar degree in all ethnic groups. However, associations between FFM and glycemia markers were less consistent. FFM was positively associated with HbA1c in South Asians but not in white Europeans or black African-Caribbeans, whereas it was positively associated with fasting glucose in South Asians and white Europeans and to a lesser extent in black African-Caribbeans. Because it has been suggested that ethnic differences in lean mass rather than fat mass could be important in the high risk of type 2 diabetes among South Asians (21), we have examined the associations between fat mass and metabolic markers, taking FFM and height into account, and the associations between FFM and metabolic markers, taking fat mass and height into account (Supplementary Table 1). The ethnic differences in associations among fat mass, HOMA-IR, HbA1c, and fasting glucose were not materially affected by adjustment for FFM and height. Similarly, the ethnic differences in the associations of FFM with HOMA-IR, HbA1c, and fasting glucose were largely unaffected by adjustment for fat mass and height.
The effect of adjustment for height in the analysis of ethnic differences in the associations among adiposity, HOMA-IR, HbA1c, and fasting glucose are shown in Supplementary Table 2. The associations among adiposity, HOMA-IR, and fasting glucose (but not HbA1c) were weakened by height adjustment in all ethnic groups. However, the pattern of ethnic differences in associations among adiposity, HOMA-IR, and HbA1c remained similar.
CONCLUSIONS
Summary of findings
The results of this study, the first to our knowledge to examine ethnic differences in the associations between type 2 diabetes precursors and adiposity in U.K. children of South Asian, black African-Caribbean, and white European origin, showed marked ethnic differences in the associations between adiposity and metabolic risk markers (HOMA-IR, HbA1c, and fasting glucose). In particular, South Asian children showed stronger associations among adiposity, insulin resistance, and HbA1c than white Europeans. Black African-Caribbeans showed stronger associations between adiposity and HbA1c than in white Europeans, who showed no association between adiposity and HbA1c. These patterns were, however, less apparent for fasting glucose, which showed weak positive associations for South Asians and white Europeans but no consistent associations among black African-Caribbeans.
Relation to previous studies
Previous studies have shown that the higher risks of type 2 diabetes and insulin resistance in South Asian adults are not accounted for by their higher levels of adiposity, particularly central adiposity (13,15–17). The results of the current study, showing that both insulin resistance and HbA1c levels are higher in South Asian children than white Europeans, are consistent with earlier studies in adults, adolescents, and children (4,13,15,18,28,29). The finding that higher adiposity levels are apparent in South Asians, despite their lower BMI levels, is also consistent with earlier evidence both in adults and children (10,11,14). Our findings that the positive associations of adiposity markers with insulin resistance and HbA1c in South Asians are stronger than those for white Europeans, suggesting a greater metabolic sensitivity to adiposity among South Asians, are consistent with our earlier report in children, based on a much smaller study (18), and with the results of some previous studies in adults (13,15,17). These particularly included the study of U.K. South Asians and white Europeans by McKeigue et al. (13), which showed that the associations among waist/hip ratio, diabetes risk, and insulin appeared to be stronger in South Asians than white Europeans, and a report from the Nurses’ Health Study (15), which showed that the impact of a five-unit increment in BMI on type 2 diabetes incidence was more than twice as large in Asians compared with whites (an 84% increase vs. 37% in whites). In addition, in a Canadian study, the association between BMI and HbA1c appeared steeper in South Asians than in whites (17). However, a further Canadian study showed a similar association between BMI and type 2 diabetes risk in South Asians and whites, though the association in Chinese Asians was considerably steeper (30). Other smaller studies both in adults and adolescents have not consistently observed ethnic differences in adiposity–insulin relationships, possibly reflecting their limited precision and statistical power (10,31).
Published data comparing the associations among adiposity, insulin resistance, and glycemia among black African-Caribbeans and white Europeans are limited, with no previous U.K. reports. The results of the current study, showing that black African-Caribbean children have higher levels of insulin and HbA1c, are consistent with differences between African American and white adults and children reported in the U.S. (32–34). The similar associations observed in this study between adiposity and insulin resistance are consistent with a previous report from the U.S. showing that the incremental effects of BMI on fasting insulin levels were similar among black and white adolescent girls (35). Although we observed stronger adiposity–HbA1c associations in black African-Caribbeans compared with white Europeans, associations between adiposity and diabetes risk in black Americans were similar to those in white Americans (15,36) or showed inconsistent patterns in men and women, with little overall difference (37).
Strengths and limitations
Strengths of the current study include its large size and balanced samples of U.K. South Asians (including Indians, Pakistanis, and Bangladeshis) and U.K black African-Caribbeans (including both African and Caribbean groups), drawn from three cities that together account for more than two-thirds of all U.K. South Asians and black African-Caribbeans. Although response rates were moderate, children who did or did not provide a blood sample were similar in sex proportions, mean height, and weight; ethnic differences in response rates were limited. We used HOMA-IR, a moderately strong marker of insulin resistance (38); similar findings were observed with fasting insulin, which was very strongly correlated with fasting insulin in this study population (r = 0.99) and is a comparable marker of insulin resistance (38). The inclusion of HbA1c measurements, reflecting postprandial as well as fasting glucose levels (39), is likely to have strengthened the ability of the study to detect early changes in glycemic control, reflected in the more consistent associations between adiposity and HbA1c than were observed for fasting glucose. The study included several independently valid measures of adiposity based on skinfold thicknesses, bioimpedance (40), and serum leptin (41,42) as well as BMI and waist circumference, all of which showed comparable overall associations with HOMA-IR and HbA1c and similar patterns of ethnic differences. Although these measures are likely to have provided an accurate view of the associations among general adiposity, insulin resistance, and glycemia, none would have been expected to provide an accurate measure of visceral adiposity, which requires separate investigation in future studies. Although skinfold thickness in particular is prone to observer bias, efforts were made to limit observer bias and its effects by observer training and review and by study-design features (ensuring that each observer measured approximately equal proportions of children of each ethnic group and sex). It is unlikely that observer bias was important because adjustment of ethnic differences in associations between metabolic risk markers and adiposity for skinfold observer had no effect on the results, which were similar for all adiposity measures. An important potential limitation with bioimpedance measurements was the use of a single equation to derive FFM (and indirectly fat mass and fat mass percentage) from bioimpedance for all ethnic groups (43). However, we have recently confirmed the validity of the bioimpedance equation used in this study (22) in 900 U.K. children of South Asian, black African-Caribbean, and white European origin and observed that the use of ethnic-specific bioimpedance equations do not materially affect the study results (C. Nightingale, A. Rudnicka, D. Cook, P. Whincup, unpublished observations). Although pubertal assessment was only carried out in girls in the current study because boys would not be expected to enter puberty until a later age (44–46), adjustment for pubertal status in girls had no important effect on the results. Moreover, the similarity of the main findings in girls and boys suggests that differences in puberty do not account for the study findings.
Implications
The results of this study suggest that the South Asian phenotype related to diabetes risk is not simply an increase in insulin resistance and levels of glycemia markers, but also includes an element of greater metabolic sensitivity to higher overall body fat levels, particularly affecting insulin resistance and postprandial glucose in this age-group. This finding does not simply reflect the underestimation of body fat levels by BMI among South Asians [already reported in the current study population (19)], since it is observed with other adiposity markers based on bioimpedance, skinfold thickness, and serum leptin, which do not underestimate body fat levels in the same way (19). The finding that the associations between adiposity and insulin resistance are more consistent than those for glycemia may reflect the role of β-cell function as a determinant of glycemia (47). The patterns observed do not appear to be explained by ethnic differences in FFM, though further assessment of its role is needed. In the current study, FFM is positively related to insulin resistance in all ethnic groups and less consistently to glycemia; however, adjustment for FFM did not account for the observed ethnic differences in the associations among fat mass, insulin resistance, and glycemia. The reasons for the altered metabolic sensitivity to adiposity remain unclear, but may reflect the influence of other exposures differing by ethnic group and operating in childhood, infancy, or fetal life. Such factors might include childhood dietary factors or physical activity, both observed to differ between South Asians and white Europeans (48,49). The influence of growth and nutrition in utero (e.g., on pancreatic development) or specific genetic influences could also be important. The results have important potential implications for efforts to prevent type 2 diabetes and other chronic diseases in U.K. South Asians. In particular, efforts to control excessive weight gain and fat-tissue accumulation need to be established as a priority in childhood, especially among South Asians. The results of the current study emphasize the importance of this issue. However, despite the importance of avoiding excessive fat accumulation in childhood, the results suggest that control of adiposity alone will not abolish the South Asian-white European differences in insulin resistance and HbA1c; ethnic differences in these markers are present, although diminished in size, even at the lowest body fat levels. These findings are likely to have particular importance in the Indian subcontinent, where rising adiposity levels are a major and growing concern (50), and >100 million people are projected to have diabetes by 2030 (2). The findings may also be relevant for other Asian populations (for example, in China), though this has yet to be established.
Acknowledgments
C.M.N. was supported by a National Institute for Health Research fellowship (Grant DRF-2010-02-101). Data collection in the CHASE Study was supported by grants from the Wellcome Trust (Grant 068362/Z/02/Z) and the National Prevention Research Initiative (Grant G0501295). The funding partners for this National Prevention Research Initiative award were: the British Heart Foundation, Cancer Research UK, Department of Health, Diabetes UK, the Economic and Social Research Council, the Medical Research Council, the Research and Development Office for the Northern Ireland Health and Social Services, Chief Scientist Office, Scottish Executive Health Department, and the Welsh Assembly Government.
No potential conflicts of interest relevant to this article were reported.
C.M.N. developed the idea for this article, carried out the statistical analyses, and drafted the paper. A.R.R. helped develop the idea for this article, helped carry out the statistical analyses, and helped direct the CHASE Study. C.G.O. helped direct the CHASE Study. J.C.K.W. helped develop the idea for this article. N.S. provided leptin assays. D.G.C. helped develop the idea for this article and helped direct the CHASE Study. P.H.W. developed the idea for this article and conceived, raised funding for, and directed the CHASE Study. All authors critically reviewed the scientific content and approved the final version to be published. C.M.N. and P.H.W. are the guarantors of this work and, as such, had full access to all the data in the study and take responsibility for the integrity of the data and the accuracy of the data analysis.
Data from this study were presented in abstract form at the Society for Social Medicine 56th Annual Scientific Meeting, London, U.K., 12–14 September 2012.
The authors thank the CHASE field study team members and all participating schools, pupils, and parents. Insulin assays were carried out in the Department of Diabetes, University of Newcastle-on-Tyne (H. Gilbert), and leptin assays in the BHF Glasgow Cardiovascular Research Centre, University of Glasgow (Dr. L. Cherry and Prof. N. Sattar).
Footnotes
This article contains Supplementary Data online at http://care.diabetesjournals.org/lookup/suppl/doi:10.2337/dc12-1726/-/DC1.
References
- 1.González EL, Johansson S, Wallander MA, Rodríguez LA. Trends in the prevalence and incidence of diabetes in the UK: 1996-2005. J Epidemiol Community Health 2009;63:332–336 [DOI] [PubMed] [Google Scholar]
- 2.Wild S, Roglic G, Green A, Sicree R, King H. Global prevalence of diabetes: estimates for the year 2000 and projections for 2030. Diabetes Care 2004;27:1047–1053 [DOI] [PubMed] [Google Scholar]
- 3.Zimmet P, Alberti KG, Shaw J. Global and societal implications of the diabetes epidemic. Nature 2001;414:782–787 [DOI] [PubMed] [Google Scholar]
- 4.National Center for Social Research Health Survey for England 2004: The Health of Ethnic Minority Hroups. Vol. 1 Sproston K, Mindell J, Eds. London, The Information Centre, 2006 [Google Scholar]
- 5.Cowie CC, Rust KF, Byrd-Holt DD, et al. Prevalence of diabetes and impaired fasting glucose in adults in the U.S. population: National Health And Nutrition Examination Survey 1999-2002. Diabetes Care 2006;29:1263–1268 [DOI] [PubMed] [Google Scholar]
- 6.McNeely MJ, Boyko EJ. Type 2 diabetes prevalence in Asian Americans: results of a national health survey. Diabetes Care 2004;27:66–69 [DOI] [PubMed] [Google Scholar]
- 7.Whincup PH, Nightingale CM, Owen CG, et al. Early emergence of ethnic differences in type 2 diabetes precursors in the UK: the Child Heart and Health Study in England (CHASE Study). PLoS Med 2010;7:e1000263. [DOI] [PMC free article] [PubMed] [Google Scholar]
- 8.Hyppönen E, Power C, Smith GD. Prenatal growth, BMI, and risk of type 2 diabetes by early midlife. Diabetes Care 2003;26:2512–2517 [DOI] [PubMed] [Google Scholar]
- 9.Owen CG, Whincup PH, Orfei L, et al. Is body mass index before middle age related to coronary heart disease risk in later life? Evidence from observational studies. Int J Obes (Lond) 2009;33:866–877 [DOI] [PMC free article] [PubMed] [Google Scholar]
- 10.Ehtisham S, Crabtree N, Clark P, Shaw N, Barrett T. Ethnic differences in insulin resistance and body composition in United Kingdom adolescents. J Clin Endocrinol Metab 2005;90:3963–3969 [DOI] [PubMed] [Google Scholar]
- 11.Deurenberg P, Deurenberg-Yap M, Guricci S. Asians are different from Caucasians and from each other in their body mass index/body fat per cent relationship. Obes Rev 2002;3:141–146 [DOI] [PubMed] [Google Scholar]
- 12.Chinn S, Rona RJ, Gulliford MC, Hammond J. Weight-for-height in children aged 4-12 years. A new index compared to the normalized body mass index. Eur J Clin Nutr 1992;46:489–500 [PubMed] [Google Scholar]
- 13.McKeigue PM, Shah B, Marmot MG. Relation of central obesity and insulin resistance with high diabetes prevalence and cardiovascular risk in South Asians. Lancet 1991;337:382–386 [DOI] [PubMed] [Google Scholar]
- 14.Shaw NJ, Crabtree NJ, Kibirige MS, Fordham JN. Ethnic and gender differences in body fat in British schoolchildren as measured by DXA. Arch Dis Child 2007;92:872–875 [DOI] [PMC free article] [PubMed] [Google Scholar]
- 15.Shai I, Jiang R, Manson JE, et al. Ethnicity, obesity, and risk of type 2 diabetes in women: a 20-year follow-up study. Diabetes Care 2006;29:1585–1590 [DOI] [PubMed] [Google Scholar]
- 16.McKeigue PM, Pierpoint T, Ferrie JE, Marmot MG. Relationship of glucose intolerance and hyperinsulinaemia to body fat pattern in south Asians and Europeans. Diabetologia 1992;35:785–791 [DOI] [PubMed] [Google Scholar]
- 17.Razak F, Anand S, Vuksan V, et al. SHARE Investigators Ethnic differences in the relationships between obesity and glucose-metabolic abnormalities: a cross-sectional population-based study. Int J Obes (Lond) 2005;29:656–667 [DOI] [PubMed] [Google Scholar]
- 18.Whincup PH, Gilg JA, Papacosta O, et al. Early evidence of ethnic differences in cardiovascular risk: cross sectional comparison of British South Asian and white children. BMJ 2002;324:635. [DOI] [PMC free article] [PubMed] [Google Scholar]
- 19.Nightingale CM, Rudnicka AR, Owen CG, Cook DG, Whincup PH. Patterns of body size and adiposity among UK children of South Asian, black African-Caribbean and white European origin: Child Heart And health Study in England (CHASE Study). Int J Epidemiol 2011;40:33–44 [DOI] [PMC free article] [PubMed] [Google Scholar]
- 20.Sattar N, Wannamethee SG, Forouhi NG. Novel biochemical risk factors for type 2 diabetes: pathogenic insights or prediction possibilities? Diabetologia 2008;51:926–940 [DOI] [PubMed] [Google Scholar]
- 21.Unni US, Ramakrishnan G, Raj T, et al. Muscle mass and functional correlates of insulin sensitivity in lean young Indian men. Eur J Clin Nutr 2009;63:1206–1212 [DOI] [PubMed] [Google Scholar]
- 22.Clasey JL, Bradley KD, Bradley JW, Long DE, Griffith JR. A new BIA equation estimating the body composition of young children. Obesity (Silver Spring) 2011;19:1813–1817 [DOI] [PubMed] [Google Scholar]
- 23.Deurenberg P, van der Kooy K, Leenen R, Weststrate JA, Seidell JC. Sex and age specific prediction formulas for estimating body composition from bioelectrical impedance: a cross-validation study. Int J Obes 1991;15:17–25 [PubMed] [Google Scholar]
- 24.Tanner J. Growth at Adolescence. Oxford, Blackwell Scientific Publications, 1962 [Google Scholar]
- 25.Andersen L, Dinesen B, Jørgensen PN, Poulsen F, Røder ME. Enzyme immunoassay for intact human insulin in serum or plasma. Clin Chem 1993;39:578–582 [PubMed] [Google Scholar]
- 26.Levy JC, Matthews DR, Hermans MP. Correct homeostasis model assessment (HOMA) evaluation uses the computer program. Diabetes Care 1998;21:2191–2192 [DOI] [PubMed] [Google Scholar]
- 27.McConway MG, Johnson D, Kelly A, Griffin D, Smith J, Wallace AM. Differences in circulating concentrations of total, free and bound leptin relate to gender and body composition in adult humans. Ann Clin Biochem 2000;37:717–723 [DOI] [PubMed] [Google Scholar]
- 28.Whincup PH, Gilg JA, Owen CG, Odoki K, Alberti KG, Cook DG. British South Asians aged 13-16 years have higher fasting glucose and insulin levels than Europeans. Diabet Med 2005;22:1275–1277 [DOI] [PubMed] [Google Scholar]
- 29.Hawkins R. Differences in HbA1c between Caucasians, Chinese, Indians, Malays and Eurasians. Clin Chim Acta 2011;412:1167. [DOI] [PubMed] [Google Scholar]
- 30.Chiu M, Austin PC, Manuel DG, Shah BR, Tu JV. Deriving ethnic-specific BMI cutoff points for assessing diabetes risk. Diabetes Care 2011;34:1741–1748 [DOI] [PMC free article] [PubMed] [Google Scholar]
- 31.Chandalia M, Abate N, Garg A, Stray-Gundersen J, Grundy SM. Relationship between generalized and upper body obesity to insulin resistance in Asian Indian men. J Clin Endocrinol Metab 1999;84:2329–2335 [DOI] [PubMed] [Google Scholar]
- 32.Svec F, Nastasi K, Hilton C, Bao W, Srinivasan SR, Berenson GS. Black-white contrasts in insulin levels during pubertal development. The Bogalusa Heart Study. Diabetes 1992;41:313–317 [DOI] [PubMed] [Google Scholar]
- 33.Ford ES, Li C, Imperatore G, Cook S. Age, sex, and ethnic variations in serum insulin concentrations among U.S. youth: findings from the National Health and Nutrition Examination Survey 1999-2002. Diabetes Care 2006;29:2605–2611 [DOI] [PubMed] [Google Scholar]
- 34.Herman WH, Ma Y, Uwaifo G, et al. Diabetes Prevention Program Research Group Differences in A1C by race and ethnicity among patients with impaired glucose tolerance in the Diabetes Prevention Program. Diabetes Care 2007;30:2453–2457 [DOI] [PMC free article] [PubMed] [Google Scholar]
- 35.Klein DJ, Aronson Friedman L, Harlan WR, et al. Obesity and the development of insulin resistance and impaired fasting glucose in black and white adolescent girls: a longitudinal study. Diabetes Care 2004;27:378–383 [DOI] [PubMed] [Google Scholar]
- 36.Carnethon MR, Palaniappan LP, Burchfiel CM, Brancati FL, Fortmann SP. Serum insulin, obesity, and the incidence of type 2 diabetes in black and white adults: the atherosclerosis risk in communities study: 1987-1998. Diabetes Care 2002;25:1358–1364 [DOI] [PMC free article] [PubMed] [Google Scholar]
- 37.Lipton RB, Liao Y, Cao G, Cooper RS, McGee D. Determinants of incident non-insulin-dependent diabetes mellitus among blacks and whites in a national sample. The NHANES I Epidemiologic Follow-up Study. Am J Epidemiol 1993;138:826–839 [DOI] [PubMed] [Google Scholar]
- 38.Cutfield WS, Jefferies CA, Jackson WE, Robinson EM, Hofman PL. Evaluation of HOMA and QUICKI as measures of insulin sensitivity in prepubertal children. Pediatr Diabetes 2003;4:119–125 [DOI] [PubMed] [Google Scholar]
- 39.Monnier L, Colette C. Contributions of fasting and postprandial glucose to hemoglobin A1c. Endocr Pract 2006;12(Suppl. 1):42–46 [DOI] [PubMed] [Google Scholar]
- 40.Wells JC, Fewtrell MS. Measuring body composition. Arch Dis Child 2006;91:612–617 [DOI] [PMC free article] [PubMed] [Google Scholar]
- 41.Blum WF, Englaro P, Hanitsch S, et al. Plasma leptin levels in healthy children and adolescents: dependence on body mass index, body fat mass, gender, pubertal stage, and testosterone. J Clin Endocrinol Metab 1997;82:2904–2910 [DOI] [PubMed] [Google Scholar]
- 42.Sarwar N, Sattar N, Gudnason V, Danesh J. Circulating concentrations of insulin markers and coronary heart disease: a quantitative review of 19 Western prospective studies. Eur Heart J 2007;28:2491–2497 [DOI] [PubMed] [Google Scholar]
- 43.Haroun D, Taylor SJ, Viner RM, et al. Validation of bioelectrical impedance analysis in adolescents across different ethnic groups. Obesity (Silver Spring) 2010;18:1252–1259 [DOI] [PubMed] [Google Scholar]
- 44.Sørensen K, Aksglaede L, Petersen JH, Juul A. Recent changes in pubertal timing in healthy Danish boys: associations with body mass index. J Clin Endocrinol Metab 2010;95:263–270 [DOI] [PubMed] [Google Scholar]
- 45.Euling SY, Herman-Giddens ME, Lee PA, et al. Examination of US puberty-timing data from 1940 to 1994 for secular trends: panel findings. Pediatrics 2008;121(Suppl. 3):S172–S191 [DOI] [PubMed] [Google Scholar]
- 46.Aksglaede L, Olsen LW, Sørensen TI, Juul A. Forty years trends in timing of pubertal growth spurt in 157,000 Danish school children. PLoS ONE 2008;3:e2728. [DOI] [PMC free article] [PubMed] [Google Scholar]
- 47.Lastra G, Manrique CM, Hayden MR. The role of beta-cell dysfunction in the cardiometabolic syndrome. J Cardiometab Syndr 2006;1:41–46 [DOI] [PubMed] [Google Scholar]
- 48.Donin AS, Nightingale CM, Owen CG, et al. Nutritional composition of the diets of South Asian, black African-Caribbean and white European children in the United Kingdom: the Child Heart and Health Study in England (CHASE). Br J Nutr 2010;104:276–285 [DOI] [PMC free article] [PubMed] [Google Scholar]
- 49.Owen CG, Nightingale CM, Rudnicka AR, Cook DG, Ekelund U, Whincup PH. Ethnic and gender differences in physical activity levels among 9-10-year-old children of white European, South Asian and African-Caribbean origin: the Child Heart Health Study in England (CHASE Study). Int J Epidemiol 2009;38:1082–1093 [DOI] [PMC free article] [PubMed] [Google Scholar]
- 50.Wang Y, Chen HJ, Shaikh S, Mathur P. Is obesity becoming a public health problem in India? Examine the shift from under- to overnutrition problems over time. Obes Rev 2009;10:456–474 [DOI] [PubMed] [Google Scholar]