

Abstract
NAG-1/GDF15 is a TGF-β superfamily member with poorly characterized biological activity proposed to inhibit inflammatory cytokine production. Transgenic mice expressing human NAG-1/GDF15 (NAG-1Tg/Lox) are leaner with lower body weight and are resistant to chemically or genetically induced intestinal tumors. Because of the link between obesity, inflammation, and cancer, we examined whether these mice exhibit a reduced response to inflammatory stimuli. The NAG-1Tg/Lox mice had a reduced inflammatory response to LPS based on the serum levels of cytokines KC, IL-6, MCP-1, and TNFα. In contrast to literature reports and our in vivo results, NAG-1 did not inhibit LPS-induced cytokine expression in vitro in RAW264.7 cells, mouse peritoneal macrophages, or mouse liver Kupffer cells, suggesting that NAG-1/GDF15 does not directly inhibit LPS-induced inflammatory cytokine production. However, NAG-1Tg/Lox mice have less white adipose tissue, the major source of inflammatory adipokines including leptin. Basal and LPS-treated serum leptin and mRNA levels in the adipose tissue of NAG-1Tg/Lox mice were lower than those in WT mice. We propose that the reduced white adipose tissue and reduced leptin expression may be responsible, in part, for the reduced inflammatory response to LPS and the decrease in intestinal tumors observed in NAG-1Tg/Lox mice.
1. Introduction
Nonsteroidal anti-inflammatory drug-activated gene (NAG-1/GDF15) is a divergent member of the TGF-β superfamily and is also known as macrophage inhibitory cytokine (MIC-1) [1, 2]. NAG-1/GDF15 expression is induced by a number of anti-inflammatory drugs and chemicals known to have antitumorigenic activities, including cyclooxygenase inhibitors, dietary agents, PPAR agonist, and anticancer drugs [3]. The overexpression of NAG-1 in cancer cells stimulates apoptosis and inhibits tumor growth in mouse xenograft models [3]. A transgenic mouse was developed in this laboratory which ubiquitously expresses human NAG-1/GDF15 (NAG-1Tg/Lox) under the control of the chicken β-actin promoter (CAG) [4]. In addition to expression in most tissues including skin, kidney, colon, brain, and lung, it is found at high levels in the serum (~50 ng/mL), as NAG-1 is a secreted protein. The mouse has no apparent phenotype except for being leaner with DEXA densitometry (PIXImus) analysis indicating less adipose tissue. Previously we reported that the transgenic mice are resistant to chemically and genetically induced intestinal tumors [4]. Treatment of the transgenic mice with the intestinal carcinogen azoxymethane (AOM) induced fewer intestinal tumors as compared to the wild-type (WT) mice. Crossing the NAG-1 transgenic mouse with the APC min mouse that spontaneously develops polyps produced an APC min mouse expressing NAG-1. This mouse developed fewer polyps than the WT APC min mouse. These data support the notion that NAG-1 acts to suppress intestinal tumor formation during the early stages of tumorigenesis. Because overexpression of NAG-1 induces apoptosis in cultured cancer cells [5], we expected increased apoptosis to be one of the mechanisms for the inhibition of intestinal tumor growth in our mouse model. However, we did not observe spontaneous apoptosis in the NAG-1Tg/Lox mouse, suggesting other mechanisms are responsible for the tumor suppression.
Inflammation can be an important determinant in the development of cancer and is a driving force for the development of colorectal cancer [6, 7]. Many reports in the literature confirm the importance of inflammation in AOM-induced intestinal tumor formation. For example, genetic deletion of critical NFkB components reduces tumor formation [8] in mice treated with AOM. Inflammation also plays a critical role in the APC min mouse model [9, 10]. Bootcov et al. [11] previously reported that NAG-1/GDF15 inhibits LPS-induced cytokine formation in macrophages, the experimental basis for naming the protein MIC-1 (macrophage inhibitory cytokine). Thus, we suspected one potential mechanism for the resistance of the NAG-1Tg/Lox to intestinal tumor formation was a lower inflammatory response.
In humans, the accumulation of white adipose tissue in obesity provides a source of chronic inflammation, which likely explains the fact that obese people are at increased risk for developing colorectal cancer [12]. Various mouse models have highlighted the pivotal role of white adipose-derived leptin as an inflammatory cytokine that plays a critical role in the development of intestinal cancer. Leptin is a secreted adipokine, whose levels are proportional to one's amount of white adipose tissue [13]. Obesity increases serum leptin levels, which acts as a growth and survival factor for colon epithelial cells and increases tumor growth in the AOM model [14]. Mice lacking the leptin gene (ob −/ob −) [14] have very high levels of white adipose tissue but are devoid of leptin expression and have a lower tumor burden after treatment with AOM. Furthermore, obese leptin receptor deficient (db −/db −) mice have decreased intestinal tumor formation after AOM treatment. Obese KK-Ay mice are highly susceptible to AOM-induced colorectal cancer [15], exhibit high serum leptin concentrations, and increased expression of inflammatory cytokines in their serum and visceral fat. These findings support the importance of leptin as an inflammatory link between white adipose tissue and intestinal tumorigenesis.
In this report, we test whether the NAG-1Tg/Lox mouse exhibits a reduced response to inflammatory stimuli, to help explain its protection against tumor formation in the AOM and APC min models of intestinal tumorigenesis. The NAG-1Tg/Lox mice show a reduced systemic inflammatory response to lipopolysaccharide (LPS), exhibited by lower levels of inflammatory cytokines in their serum. Interestingly, this reduction was not due to direct inhibition of cytokine production by NAG-1 in macrophages. NAG-1Tg/Lox mice are leaner [4] and have significantly lower amounts of white adipose tissue (WAT) and thus lower levels of leptin. We propose that the smaller WAT and hence lower leptin expression may be responsible for the lower inflammatory response and lower intestinal polyp formation observed in the NAG-1Tg/Lox mouse. This study illustrates how white adipose tissue can alter inflammation.
2. Methods and Procedures
2.1. Animals
As described previously, we produced two independent transgenic mouse lines (1377 and 1398) that ubiquitously express human NAG-1 protein, NAG-1Tg/Lox, under the control of CAG, using traditional pronuclear microinjection on the C57/BL6 background [4]. Seven-to twelve-week-old male and female mice from lines 1377 and 1398 NAG-1Tg/Lox mice and NAG-1 wild-type (WT) littermates were used in these experiments. The mice were housed at NIEHS or ILS under guidelines for the ethical treatment of animals. All procedures conducted in this study were approved by the appropriate institutional animal care and use committees.
2.2. LPS Treatment and Cytokine Analysis
NA G-1Tg/Lox mice and nontransgenic WT littermates of both 1377 and 1398 lines were treated with LPS (25 mg/kg, Sigma) via intraperitoneal (i.p.) injection and then sacrificed by CO2 inhalation and the blood was collected at the times indicated in the figure legends. The serum was used for cytokine analysis using the Multiplex cytokine detection assay system according to the manufacturer's instructions (Bio-Plex mouse cytokine assay, Bio-Rad).
2.3. Real-Time Polymerase Chain Reaction and Primers
Total RNA was isolated using the RNeasy Mini Kit (Qiagen) according to the manufacturer's instructions. Following DNAse I treatment (Invitrogen), reverse transcription was carried out with 1 μg total RNA using the SuperScript II reverse transcription system (Invitrogen) according to the manufacturer's instructions. Real-time PCR was performed in duplicate with individual time-matched vehicle-treated controls using SYBR Green PCR Master Mix (BioRad), a BioRad iCycler Thermal Cycler and the following primers:
-
hNAG-1, F: 5′-ctccagattccgagagttgc-3′, R: 5′-agagatacgcaggtgcaggt-3′
-
mGDF15, F: 5′-ttctgtggggacggtcag-3′, R: 5′-cgggtgaccaggctaattc-3′
-
mCOX-2, F: 5′-cccccacagtcaaagacact-3′, R: 5′-gagtccatgttccaggagga-3′
-
mMcp-1, F: 5′-aggtccctgtcatgcttctg-3′, R: 5′-tctggacccattccttcttg-3′
-
mKC, F: 5′-gcacccaaaccgaagtcata-3′, R: 5′-tggggacaccttttagcatc-3′
-
mIL-6, F: 5′-ccggagaggagacttcacag-3′, R: 5′-ggaaattggggtaggaagga-3′
-
mTNF-α, F: 5′-cgtcagccgatttgctatct-3′, R: 5′-cggactccgcaaagtctaag-3′
-
mLeptin, F: 5′-tgacaccaaaaccctcatca-3′, R: 5′-tgaagcccaggaatgaagtc-3′
-
mLeptin Receptor, F: 5′-gggaatgagcaaggtcaaaa-3′, R: 5′-tcaagtcccctttcatccag-3′
-
mIL-1β, F: 5′-caggcaggcagtatcactca-3′, R: 5′-tgtcctcatcctggaaggtc-3′
-
mGAPDH, F: 5′-caggagcgagaccccactaacat-3′, R: 5′-gtcagatccacgacggacacatt-3′
-
mβ-actin, F: 5′-tgacaggatgcagaaggaga-3′, R: 5′-cgctcaggaggagcaatg- 3′.
The following cycle parameters were used: 95°C for 10 minutes; 40 cycles of 95°C for 15 seconds, 60°C for 30 seconds; 95°C for 1 minute; 60°C for 1 minute; 81 cycles of 55°C for 10 seconds. BioRad iQ5 Version 2.0 software was used to calculate Ct values for all genes. Corrected Ct values were calculated by subtracting the average control gene (actin or GAPDH) Ct value from the average Ct value for a given gene. Fold differences were calculated using the corrected Ct values.
2.4. RAW Cell Culture and Transfections
RAW 264.7 (ATCC) cells were plated in 60 mm culture dishes and grown overnight in DMEM supplemented with 10% fetal bovine serum. The next day, the cells were transfected with either empty vector or an NAG-1 expression vector [16] using Lipofectamine 2000 according to the manufacturer's protocol (Invitrogen) for 24 hours. Cells were treated with LPS (1 µg/mL) or vehicle for 6 hours. The transfections were performed for three independent times. RNA isolation and RT-PCR were performed as described previously.
2.5. Isolation and Culture of Intraperitoneal Macrophages and Kupffer Cells
To obtain intraperitoneal macrophages, mice were injected i.p. with 3% thioglycollate solution to enhance macrophage recruitment and 3 days later peritoneal cells were isolated. Kupffer cell isolation was performed following Current Protocols in Toxicology [17]. Briefly, mouse livers were perfused by inserting and securing a catheter through the vena cava, severing the portal vein and perfused with prewarmed CMF-HBSS until clear, then pre-warmed 0.03% collagenase type IV in HBSS at a rate of 5 mL/min for 5 minutes. Perfused livers were kept on ice in a small volume of CMF-HBSS in sterile conical polypropylene tubes until all tissue collection was completed. To obtain adequate cell numbers, the livers of two mice per genotype were perfused and pooled prior to Kupffer cell isolation. After Percoll gradient centrifugation, pellets were resuspended in 1 ml HBSS and counted using an automated cell counter (Nexcelom Bioscience). Consistently, from both WT and NAG-1Tg/Lox mice, 1-2 million Kupffer cells were isolated per mouse liver. Equal numbers of either WT or NAG-1Tg/Lox Kupffer cells were plated in triplicate onto 6-well dishes containing RPMI 1640 with 10% FBS, cultured for 24 hours in a humidified incubator at 37°C containing 5% CO2, then treated with 10 ng/mL LPS or vehicle for 6 hours prior to harvest. Cell culture media were collected, spun briefly to remove cell debris, aliquoted, and frozen at –80°C until ELISA analysis was performed. In experiments using the recombinant protein, WT Kupffer cells were treated with either 50 ng/mL recombinant human GDF-15 (SBH Sciences, MA, USA) or vehicle for 2 hours prior to LPS treatment.
2.6. Recombinant NAG-1 Protein
Purified recombinant human NAG-1 was purchased from R&D Systems (Minneapolis, MN, USA) and from SBH Sciences (Natick, MA, USA). The R&D Systems protein contains an N-terminal 6-His tag, whereas the SBH Sciences protein does not. The lyophilized protein was reconstituted with 1% BSA in PBS and stored at 4°C.
2.7. Statistical Analysis
Student's t test and standard deviation (SD) were calculated using Microsoft Excel (Microsoft, Redmond, WA, USA). Standard error was calculated with Stat View (Abacus Concept, Berkeley, CA, USA). Statistical analysis of cytokine levels in sera was done by analysis of variance (ANOVA).
3. Results
3.1. NAG-1 Transgenic Mice Have a Decreased Inflammatory Response to LPS
LPS is a commonly used and well-studied systemic inflammatory agent that signals through the Toll-like Receptor 4 (TLR4) leading to NFκB pathway activation and the subsequent expression of inflammatory cytokines. Treatment of mice with LPS increases the circulating levels of inflammatory cytokines, offering a convenient and suitable assay to determine how alterations in the expression of specific genes modulate the inflammatory response. The concentrations of several inflammatory cytokines were measured in serum from WT and NAG-1Tg/Lox mice 4 hours after treatment with LPS (Figure 1(a)). Serum concentrations of the cytokines IL-6, KC, and MCP-1 were significantly lower in the NAG-1Tg/Lox mice, as compared to WT littermates following LPS treatment. To evaluate the kinetics of cytokine production in the NAG-1Tg/Lox mice, serum was collected at 2, 4, and 6 hours after LPS treatment. At all time points examined, we observed lower levels of IL-6, KC, and MCP-1 in the NAG-1Tg/Lox mice as compared to their WT littermates, with the most dramatic reduction observed for TNF-α at 2 hours (Figure 1(b)). No significant differences were observed between the responses of 1377 and 1398 lines to LPS, and only the results from 1398 are reported. No statistically significant difference between male and female (data not shown) was found. These results suggest that NAG-1Tg/Lox mice have a reduced response to inflammatory stimuli and that NAG-1 may have anti-inflammatory activity.
Figure 1.
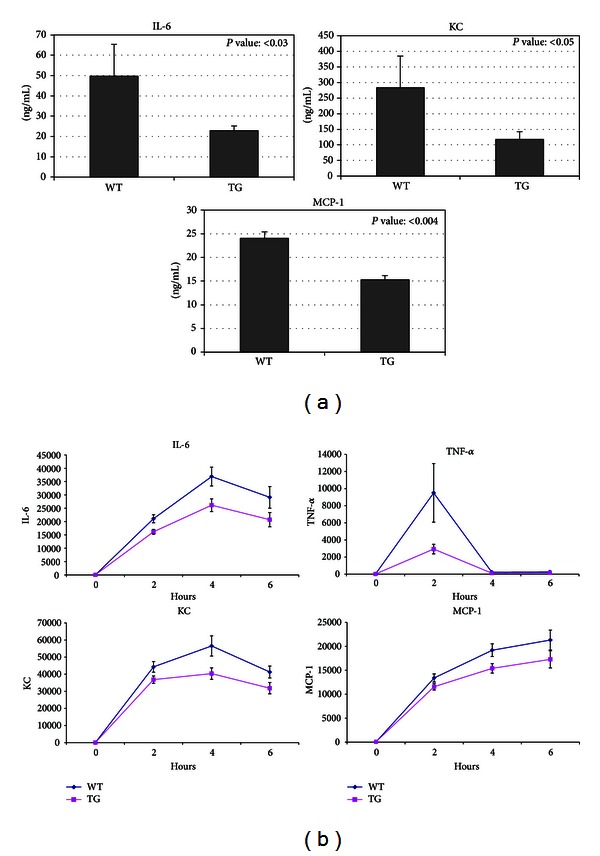
NAG-1 transgenic mice have a decreased inflammatory response to LPS. Seven- to twelve-week-old NAG-1Tg/Lox mice and wild-type littermates were injected with LPS (25 mg/kg i.p.). After 4 hours (a) and each time point (b), mice were sacrificed and serum was collected and analyzed for the level of cytokines and chemokines using a Multiplex system (Bio-Rad). Data were analyzed by nonparametric Mann-Whitney test (a) and ANOVA (b) to compare wild type to NAG-1Tg/Lox mice and are representative of two individual experiments.
3.2. Macrophages, NAG-1, and NFκB Pathway
Activation of the NFκB pathway and the subsequent increase in the production of inflammatory cytokines are important components of the systemic response to LPS. The NFκB pathway also plays an important role in intestinal inflammation and tumor formation [3]. Thus, we examined whether NAG-1 could directly inhibit this pathway. Macrophages were chosen for these experiments, as they are one of the major sources of inflammatory cytokines in response to LPS and are a suitable model system to study the NFκB pathway [8] and previous studies have demonstrated that NAG-1/GDF15 inhibits cytokine production from macrophages [11]. RAW 264.7 cells, a mouse macrophage cell line responsive to LPS, were treated with 10 to 100 ng/mL recombinant mature human NAG-1 protein (rhNAG-1) for 2 hours prior to LPS treatment (5 ng/mL) and incubated for the indicated times. Two different preparations of purified recombinant human NAG-1 protein were used. One preparation, which is reported to have activity in a number of biological systems, contains an N-terminal 6-His tag and the second is tagless [18, 19]. RNA isolated from the cells was used for real-time PCR analysis for several inflammatory mouse cytokines (TNF-α, IL-1β, and IL-6). As shown in Figure 2(a), while LPS stimulated inflammatory cytokine gene expression in RAW 264.7 cells, pretreatment with rhNAG-1 did not reproducibly inhibit TNF-α, IL-1β, and IL-6 mRNA levels. We also measured mouse GDF15 mRNA levels using real-time PCR to rule out the possibility that the endogenous protein was contributing towards our phenotype. While mGDF15 mRNA levels increased in response to rhNAG-1, treatment of RAW cells with LPS alone led to an equivalent fold induction of mGDF15. Next, a human NAG-1 expression vector was transfected into RAW 264.7 cells, and cytokine expression was measured using real-time PCR, after 6 hours of treatment with LPS or vehicle. Using primers specific to the human NAG-1 mRNA, we confirmed that human NAG-1 is highly expressed only in the NAG-1 transfected cells. However, as shown in Figure 2(b), there was no difference in cytokine production between empty vector transfected and NAG-1 transfected cells after LPS treatment, despite lower MCP-1 and IL-6 levels in vehicle-treated NAG-1 transfected cells. We also measured mGDF15 using primers specific to the mouse GDF15 mRNA. LPS treatment led to similar induction of mGDF15 in both empty vector and NAG-1 transfected cells (data not shown). Together, these data suggest that NAG-1 does not directly inhibit the TLR4/NFκB pathway.
Figure 2.

NAG-1 does not inhibit LPS-induced inflammatory cytokine formation in macrophages. (a) RAW 264.7 cells were plated in 60 mm dishes. After 24 hr, cells were treated with NAG-1 protein (R&D) at the concentrations indicated for 5 hrs and then treated with LPS (5 ng/mL) for 20 hrs. RNA was isolated from the collected cells and used for real-time PCR analysis, using primers specific to the genes indicated. The data are expressed as fold increases compared to untreated cells. Error bars represent standard deviation. (b) RAW 264.7 cells were transfected with empty vector (−) or NAG-1 expression vector (+), and then the cells were treated with 1 μg/mL LPS for 6 hours. RNA was extracted and used for real-time PCR analysis, using primers specific to the genes indicated, using mβ-actin as a control gene. The data are expressed as fold increases compared to untreated cells. Error bars represent standard error.
To test the hypothesis that expression of the transgene in the developing NAG-1Tg/Lox mouse could alter inflammatory signaling components and explain the reduced response to LPS, peritoneal macrophages were isolated from WT and NAG-1Tg/Lox mice, cultured and treated with 5 ng/mL LPS. The levels of secreted TNF-α and IL-6 after LPS treatment were measured in the culture supernatants at the times indicated using cytokine-specific ELISAs. As shown in Figure 3, the production of TNF-α and IL-6 in response to LPS was similar in WT and NAG-1Tg/Lox macrophages, indicating that NAG-1Tg/Lox macrophages ex vivo do not have impaired TLR4/ NFκB signaling. Furthermore, preincubation of peritoneal macrophages isolated from WT mice with rhNAG-1 did not alter their response to LPS (data not shown). Thus, NAG-1 does not directly inhibit or alter the LPS-activated TLR4/ NFκB pathway in macrophages. The reduction in the inflammatory response to LPS observed in the NAG-1Tg/Lox mouse does not appear to be a consequence of direct inhibition of macrophage-derived cytokine production.
Figure 3.
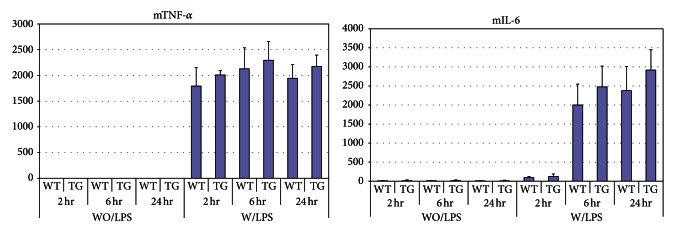
Peritoneal macrophages from WT and NAG-1Tg/Lox mice show no difference in the production of inflammatory cytokines in response to LPS. Peritoneal macrophages were isolated from WT and NAG-1Tg/Lox mice after 3 days of thioglycollate injection and plated on 60 mm dishes. After 24 hrs, cells were treated with LPS (1 ng/mL) and culture media were collected at the indicated time points. The levels of TNF-α and IL-6 from 3 dishes for each treatment were measured, in duplicate, using cytokine-specific ELISAs (R&D). The mean ± standard deviation is reported.
3.3. NAG-1 and Kupffer Cells
Because Kupffer cells, the resident liver macrophages, are an important source of LPS-induced inflammatory cytokines, we chose to examine their response to LPS ex vivo, taking two different approaches. First, we isolated Kupffer cells from WT mice and cultured them in the presence of rhNAG-1 or vehicle prior to LPS treatment. While LPS treatment led to an increase in the media concentrations of IL-6 and TNF-α as measured by ELISA, pretreatment with rhNAG-1 had no effect on cytokine production (Figure 4(a)). Taking a second approach, we isolated and cultured Kupffer cells from NAG-1Tg/Lox and WT mice, treated them with LPS, and measured IL-6 and TNF-α production. Again, the Kupffer cells responded to the inflammatory stimulus, but there was no difference in the responses between the NAG-1Tg/Lox and WT control cells (Figure 4(b)).
Figure 4.
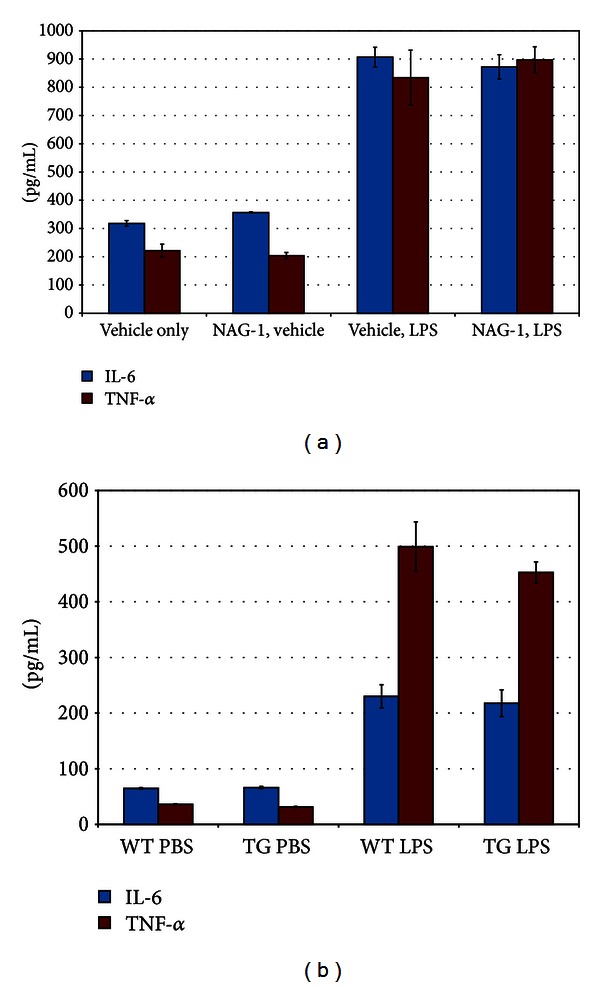
NAG-1 does not affect inflammatory cytokine production from Kupffer cells. (a) Kuppfer cells isolated from the livers of WT mice were plated in triplicate onto 6-well plates and cultured for 24 hrs in RPMI. Media were collected at the beginning of an experiment and cells were then refed and incubated with media containing recombinant human GDF-15 (50 ng/mL) or vehicle for 2 hours and then LPS (10 ng/mL) or vehicle for 6 hours, prior to media collection. TNF-α and IL-6 levels in the media were measured in duplicate using cytokine-specific ELISAs. The mean concentrations for each treatment are plotted. Error bars represent standard error. (b) Kupffer cells isolated from the livers of WT or NAG-1Tg/Lox mice were plated in triplicate onto 6-well plates and cultured for 24 hrs in RPMI. Media were collected at the beginning of an experiment and cells were re-fed and incubated with media containing LPS (10 ng/mL) or vehicle and incubated for 6 hours prior to collection of media. TNF-α and IL-6 levels in the media were measured in duplicate using cytokine-specific ELISAs. The mean concentrations for each treatment are plotted. Error bars represent the standard error of the mean.
3.4. Leptin and LPS-Induced Inflammation
Leptin is a proinflammatory cytokine and appears to be a pivotal mediator of inflammation in mice [20]. Ob −/Ob − mice lacking the leptin gene have a reduced inflammatory response to LPS [21]. Leptin expression is increased by LPS treatment and plays a role in LPS-induced increases in inflammatory cytokine formation [22, 23]. Interestingly, NAG-1Tg/Lox mice have reduced fat content as measured by DEXA densitometry (PIXImus) [4]. Based on these findings, we suspected that NAG-1Tg/Lox mice would have less white adipose tissue and lower basal leptin levels. To test this hypothesis, the body weights, abdominal fat, and serum leptin concentrations of WT and NAG-1Tg/Lox mice were measured. The body weights of the NAG-1Tg/Lox were significantly lower than their WT littermates with significantly less abdominal white fat (Figure 5). Likewise, basal serum leptin levels were significantly lower in the NAG-1Tg/Lox mice than their WT littermates (Figure 6). Treatment with LPS increased serum leptin levels in both WT and NAG-1Tg/Lox mice; however, like basal levels, the final leptin level was significantly higher in WT mice than in the NAG-1Tg/Lox mice. The basal expression of leptin as measured by RT-PCR in the abdominal white fat was approximately 2-fold higher in the WT mice than in the NAG-1Tg/Lox mice (Figure 6). We also measured the expression of leptin and various inflammatory cytokines in the abdominal fat collected 4 hours after LPS treatment (Figure 6). While there were no significant differences in any of the inflammatory cytokines measured, relative WT leptin levels were approximately 3-fold higher than in NAG-1Tg/Lox mice. Thus the NAG-1Tg/Lox mice, having less abdominal fat, express lower levels of leptin and have lower serum concentrations of leptin than WT mice, both before and after LPS treatment.
Figure 5.
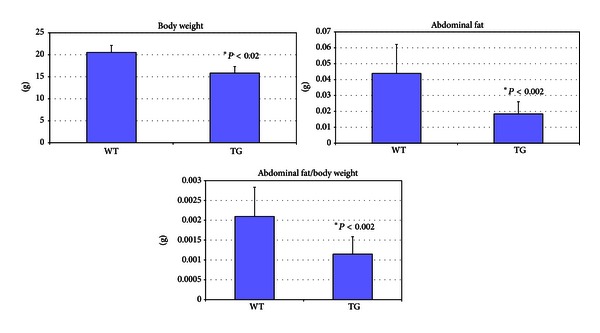
NA G-1Tg/Lox mice show lower body weight and less abdominal fat tissue than wild-type mice. 10 female WT and 10 female NAG-1Tg/Lox mice were injected with LPS intraperitoneally. After 4 hrs of LPS treatment, mice were sacrificed and weighed. Blood was collected for serum isolation and abdominal fat tissue was collected, weighed, and snap frozen.
Figure 6.
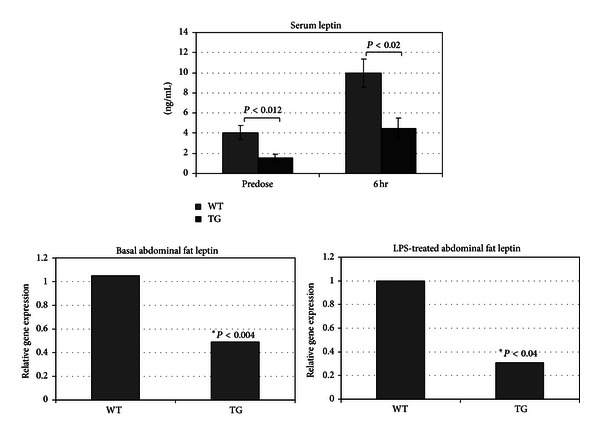
NA G-1Tg/Lox mice have lower basal and LPS-induced serum leptin concentrations and abdominal fat leptin expression than WT littermates. The serum collected from the terminal bleeds (Figure 5) was analyzed for leptin using a cytokine-specific ELISA. RNA was isolated from the isolated abdominal fat tissue, which was analyzed for relative expression of mouse leptin mRNA using RT-PCR.
4. Discussion
In this study, we demonstrate that the transgenic mice expressing hNAG-1 ubiquitously, NAG-1Tg/Lox mice, have less white adipose tissue and a lower serum level of the inflammatory cytokine leptin. These NAG-1Tg/Lox mice have a reduced response to the systemic inflammatory agent LPS. Although NAG-1 is reported to directly inhibit inflammatory cytokine production in macrophages following LPS treatment [20], we could not confirm this inhibition. Kupffer cells and peritoneal macrophages isolated from WT and NAG-1Tg/Lox mice responded similarly to LPS treatment, despite pretreatment with purified recombinant NAG-1 protein from two different commercial sources. In addition, overexpression of NAG-1 in RAW cells did not alter the cytokine production in the presence of LPS. Thus NAG-1 does not directly inhibit the TLR4/NFkB pathway activated by LPS and may not be a direct inhibitor of macrophage cytokine formation, as reported by others [20].
If NAG-1 does not inhibit cytokine formation, why do NAG-1Tg/Lox mice have a lower inflammatory response and why are these mice resistant to inflammatory driven intestinal tumors? When DEXA densitometry indicated the only apparent phenotype of NAG-1Tg/Lox mice to be less white adipose tissue, we realized that this difference could be indirectly responsible for the LPS phenotype. We propose NAG-1 to have an indirect effect on suppressing the LPS response, based on the finding that NAG-1Tg/Lox mice have significantly lower levels of white adipose tissue, lower leptin expression in their white adipose tissue, and lower serum leptin levels. While we have no direct experimental evidence that leptin is altering the LPS response in the NAG-1Tg/Lox mice and cannot exclude other factors contributing towards the phenotype, we point to the significant body of the literature showing the importance of leptin signaling in the LPS response. For example, pretreatment of peritoneal macrophages with recombinant leptin leads to a significant increase in LPS-induced cytokine production [15]. Furthermore, leptin deficient ob −/ob − mice and fa/fa mice which have reduced leptin receptor expression show a significantly decreased response to LPS [21], and ob −/ob − mice are more sensitive to LPS-induced lethality [24]. We were able to detect high levels of leptin receptor in both RAW cells and peritoneal macrophages isolated from WT and NAG-1Tg/Lox mice using RT-PCR (data not shown). Leptin expression is reported to be proportional to total adipose mass, yet the levels per gram of white adipose tissue in our NAG-1Tg/Lox mice are lower than those in WT mice, suggesting an additional level of regulation by NAG-1. NAG-1's ability to lower white adipose and circulating leptin levels is not unique to our transgenic mouse model, as it has also been observed in an xenograft model using DU145 cells expressing NAG-1 [25].
Leptin is the critical regulator of intestinal inflammation [26] and a number of studies demonstrate that increases or decreases in the serum levels of leptin can, respectively, increase or decrease the AOM-induced and APC min models of intestinal tumorigenesis [27, 28]. Based on the literature, we propose that the lower white adipose tissue and lower circulating leptin levels may be responsible, in part, for the resistance to intestinal polyps formation observed in the two mouse models of intestinal cancer we previously tested.
Interestingly, the deletion of NAG-1/GDF15 in APC min mice negates the chemoprevention afforded by sulindac treatment [29], suggesting the human and mouse proteins share some common function. However, untreated GDF15−/− mice on the APC min background do not show an increase in polyp number. GDF15 knockout mice and their WT littermates have similar body, adipose tissue weights, and serum leptin levels (data not shown). Likewise, we found that the GDF15 knockout and WT mice have similar responses to LPS as measured by cytokine levels in the serum (data not shown). Two key points can help explain why the GDF15 knockout mouse does not show the opposite phenotype of the NAG-1Tg/Lox mouse. First, mouse NAG-1/GDF15 is expressed mainly in the liver whereas the NAG-1Tg/Lox mice express human GDF15 constitutively and ubiquitously. Second, the mouse and human proteins share only 57% amino acid identity, making it possible that the proteins have unique functions. Future discovery of the structures and receptors of both mouse and human GDF15 will allow for better understanding of their differences. The findings with the GDF15 knockout mice are consistent with the hypothesis that the difference in the amount of adipose tissue and circulating leptin between the NAG-1Tg/Lox and WT mice is an important determinant of the inflammatory response to LPS.
5. Conclusions
In conclusion, we propose that the lower adipose and hence the lower leptin expression may attenuate the response to LPS treatment and may also be responsible for reduced intestinal tumor formation in NAG-1Tg/Lox mice. This hypothesis is in agreement with the critical role of the leptin in mediating intestinal inflammation and tumor growth. The lower expression of leptin as a result of a reduction in white adipose tissue and the reduced leptin expression within the adipose tissue in the NAG-1Tg/Lox mouse provide one mechanism by which NAG-1 may act to alter inflammation and tumor growth. These results also highlight the link between white adipose tissue mass and inflammation.
Conflict of Interests
There is no conflict of interests with any author on this paper.
Authors' Contribution
J. M. Kim and J. P. Kosak contributed equally to this paper.
Acknowledgments
The authors thank Colleen Anna, NIEHS, and Kyung-Won Min for their excellent technical assistance, the staff of ILS for their support, and Nichelle Whitlock (University of Tennessee) for mouse genotyping. They also thank James Clark, NIEHS for his expertise performing the mouse liver perfusions. This research was supported, in part, by NIH, NIEHS Intramural Research Program: Projects (Zeldin) Z01 ES025043 and (Eling) Z01- ES010016-14. The current address of J. M. Kim is the Division of Structural and Functional Genomics at Korea National Institute of Health, Osong, Republic of Korea.
Abbreviations
- GDF15:
Growth differentiation factor-15
- NAG-1:
NSAID-activated gene
- NAG-1Tg/Lox mice:
C57Bl6 mice expressing human NAG-1
- LPS:
Llipopolysaccharide
- KC:
Keratinocyte-derived cytokine
- IL-6:
Interleukin-6
- MCP-1:
Monocyte chemotactic protein-1
- TNF-α:
Tumor necrosis factor-alpha
- ELISA:
Enzyme-linked immunosorbent assay
- ob−/ob−:
Mice, leptin deleted obese mice
- WT:
Wild-type, db/db, leptin receptor deleted mice.
References
- 1.Baek SJ, Eling TE. Changes in gene expression contribute to cancer prevention by COX inhibitors. Progress in Lipid Research. 2006;45(1):1–16. doi: 10.1016/j.plipres.2005.10.001. [DOI] [PubMed] [Google Scholar]
- 2.Seung JB, Kim JS, Moore SM, Lee SH, Martinez J, Eling TE. Cyclooxygenase inhibitors induce the expression of the tumor suppressor gene EGR-1, which results in the up-regulation of NAG-1, an antitumorigenic protein. Molecular Pharmacology. 2005;67(2):356–364. doi: 10.1124/mol.104.005108. [DOI] [PubMed] [Google Scholar]
- 3.Wang X, Baek SJ, Eling T. COX inhibitors directly alter gene expression: role in cancer prevention? Cancer and Metastasis Reviews. 2011;30(3-4):641–657. doi: 10.1007/s10555-011-9301-4. [DOI] [PMC free article] [PubMed] [Google Scholar]
- 4.Baek SJ, Okazaki R, Lee SH, et al. Nonsteroidal anti-inflammatory drug-activated gene-1 over expression in transgenic mice suppresses intestinal neoplasia. Gastroenterology. 2006;131(5):1553–1560. doi: 10.1053/j.gastro.2006.09.015. [DOI] [PubMed] [Google Scholar]
- 5.Yamaguchi K, Lee SH, Eling TE, Baek SJ. A novel peroxisome proliferator-activated receptor γ ligand, MCC-555, induces apoptosis via post-transcriptional regulation of NAG-1 in colorectal cancer cells. Molecular Cancer Therapeutics. 2006;5(5):1352–1361. doi: 10.1158/1535-7163.MCT-05-0528. [DOI] [PubMed] [Google Scholar]
- 6.Terzić J, Grivennikov S, Karin E, Karin M. Inflammation and colon cancer. Gastroenterology. 2010;138(6):2101.e5–2114.e5. doi: 10.1053/j.gastro.2010.01.058. [DOI] [PubMed] [Google Scholar]
- 7.Coussens LM, Werb Z. Inflammation and cancer. Nature. 2002;420(6917):860–867. doi: 10.1038/nature01322. [DOI] [PMC free article] [PubMed] [Google Scholar]
- 8.Greten FR, Eckmann L, Greten TF, et al. IKKβ links inflammation and tumorigenesis in a mouse model of colitis-associated cancer. Cell. 2004;118(3):285–296. doi: 10.1016/j.cell.2004.07.013. [DOI] [PubMed] [Google Scholar]
- 9.Fenton JI, Hursting SD, Perkins SN, Hord NG. Leptin induces an Apc genotype-associated colon epithelial cell chemokine production pattern associated with macrophage chemotaxis and activation. Carcinogenesis. 2007;28(2):455–464. doi: 10.1093/carcin/bgl137. [DOI] [PubMed] [Google Scholar]
- 10.Chae WJ, Gibson TF, Zelterman D, Hao L, Henegariu O, Bothwell ALM. Ablation of IL-17A abrogates progression of spontaneous intestinal tumorigenesis. Proceedings of the National Academy of Sciences of the United States of America. 2010;107(12):5540–5544. doi: 10.1073/pnas.0912675107. [DOI] [PMC free article] [PubMed] [Google Scholar]
- 11.Bootcov MR, Bauskin AR, Valenzuela SM, et al. MIC-1, a novel macrophage inhibitory cytokine, is a divergent member of the TGF-β superfamily. Proceedings of the National Academy of Sciences of the United States of America. 1997;94(21):11514–11519. doi: 10.1073/pnas.94.21.11514. [DOI] [PMC free article] [PubMed] [Google Scholar]
- 12.Stattin P, Lukanova A, Biessy C, et al. Obesity and colon cancer: does leptin provide a link? International Journal of Cancer. 2004;109(1):149–152. doi: 10.1002/ijc.11668. [DOI] [PubMed] [Google Scholar]
- 13.Mapfei M, Halaas J, Ravussin E, et al. Leptin levels in human and rodent: measurement of plasma leptin and ob RNA in obese and weight-reduced subjects. Nature Medicine. 1995;1(11):1155–1161. doi: 10.1038/nm1195-1155. [DOI] [PubMed] [Google Scholar]
- 14.Endo H, Hosono K, Uchiyama T, et al. Leptin acts as a growth factor for colorectal tumours at stages subsequent to tumour initiation in murine colon carcinogenesis. Gut. 2011;60(10):1363–1371. doi: 10.1136/gut.2010.235754. [DOI] [PubMed] [Google Scholar]
- 15.Teraoka N, Mutoh M, Takasu S, et al. High susceptibility to azoxymethane-induced colorectal carcinogenesis in obese KK-Ay mice. International Journal of Cancer. 2011;129(3):528–535. doi: 10.1002/ijc.25711. [DOI] [PubMed] [Google Scholar]
- 16.Baek SJ, Kim KS, Nixon JB, Wilson LC, Eling TE. Cyclooxygenase inhibitors regulate the expression of a TGF-β superfamily member that has proapoptotic and antitumorigenic activities. Molecular Pharmacology. 2001;59(4):901–908. [PubMed] [Google Scholar]
- 17.Froh M, et al. Differential activation of H-, K-, N-, and R-ras isoforms following chronic ethanol in TNF-R1 deficient mice. Hepatology. 2002;36(4):p. 723a. [Google Scholar]
- 18.Jin YJ, Lee JH, Kim YM, Oh GT, Lee H. Macrophage inhibitory cytokine-1 stimulates proliferation of human umbilical vein endothelial cells by up-regulating cyclins D1 and E through the PI3K/Akt-, ERK-, and JNK-dependent AP-1 and E2F activation signaling pathways. Cell Signaling. 2012;24(8):1485–1495. doi: 10.1016/j.cellsig.2012.03.014. [DOI] [PubMed] [Google Scholar]
- 19.Murielle M, Batra SK. Divergent molecular mechanisms underlying the pleiotropic functions of macrophage inhibitory cytokine-1 in cancer. Journal of Cellular Physiology. 2010;224(3):626–635. doi: 10.1002/jcp.22196. [DOI] [PMC free article] [PubMed] [Google Scholar]
- 20.Siegmund B, Lehr HA, Fantuzzi G. Leptin: a pivotal mediator of intestinal inflammation in mice. Gastroenterology. 2002;122(7):2011–2025. doi: 10.1053/gast.2002.33631. [DOI] [PubMed] [Google Scholar]
- 21.Loffreda S, Yang SQ, Lin HZ, et al. Leptin regulates proinflammatory immune responses. The FASEB Journal. 1998;12(1):57–65. [PubMed] [Google Scholar]
- 22.Gove ME, Rhodes DH, Pini M, et al. Role of leptin receptor-induced STAT3 signaling in modulation of intestinal and hepatic inflammation in mice. Journal of Leukocyte Biology. 2009;85(3):491–496. doi: 10.1189/jlb.0808508. [DOI] [PMC free article] [PubMed] [Google Scholar]
- 23.Sachot C, Poole S, Luheshi GN. Circulating leptin mediates lipopolysaccharide-induced anorexia and fever in rats. Journal of Physiology. 2004;561, part 1:263–272. doi: 10.1113/jphysiol.2004.074351. [DOI] [PMC free article] [PubMed] [Google Scholar]
- 24.Faggioni R, Fantuzzi G, Gabay C, et al. Leptin deficiency enhances sensitivity to endotoxin-induced lethality. American Journal of Physiology. 1999;276(1, part 2):R136–R142. doi: 10.1152/ajpregu.1999.276.1.R136. [DOI] [PubMed] [Google Scholar]
- 25.Wang X, Chrysovergis K, Bienstock RJ, Shim M, Eling TE. The H6D variant of NAG-1/GDF15 inhibits prostate xenograft growth in vivo. Prostate. 2012;72(6):677–689. doi: 10.1002/pros.21471. [DOI] [PMC free article] [PubMed] [Google Scholar]
- 26.Yarandi SS, Hebbar G, Sauer CG, Cole CR, Ziegler TR. Diverse roles of leptin in the gastrointestinal tract: modulation of motility, absorption, growth, and inflammation. Nutrition. 2011;27(3):269–275. doi: 10.1016/j.nut.2010.07.004. [DOI] [PMC free article] [PubMed] [Google Scholar]
- 27.Park SY, Kim JS, Seo YR, Sung MK. Effects of diet-induced obesity on colitis-associated colon tumor formation in A/J mice. International Journal of Obesity. 2012;36(2):273–280. doi: 10.1038/ijo.2011.83. [DOI] [PubMed] [Google Scholar]
- 28.Fenton JI, Birmingham JM, Hursting SD, Hord NG. Adiponectin blocks multiple signaling cascades associated with leptin-induced cell proliferation in ApcMin/+ colon epithelial cells. International Journal of Cancer. 2008;122(11):2437–2445. doi: 10.1002/ijc.23436. [DOI] [PubMed] [Google Scholar]
- 29.Zimmers TA, Gutierrez JC, Koniaris LG. Loss of GDF-15 abolishes Sulindac chemoprevention in the ApcMin/+ mouse model of intestinal cancer. Journal of Cancer Research and Clinical Oncology. 2010;136(4):571–576. doi: 10.1007/s00432-009-0691-4. [DOI] [PubMed] [Google Scholar]