

Abstract
Purpose
Circulating tumor cells (CTC) represent a new outcome-associated biomarker independently from known prognostic factors in metastatic breast cancer (MBC). The objective here was to develop and validate nomograms that combined baseline CTC counts and the other prognostic factors to assess the outcome of individual patients starting first-line treatment for MBC.
Experimental Design
We used a training set of 236 MBC patients starting a first-line treatment from the MD Anderson Cancer Center to establish nomograms that calculated the predicted probability of survival at different time points: 1, 2, and 5 years for overall survival (OS) and 6 months and 1 and 2 years for progression-free survival (PFS). The covariates computed in the model were: age, disease subtype, visceral metastases, performance status, and CTC counts by CellSearch. Nomograms were independently validated with 210 MBC patients from the Institut Curie who underwent first-line chemotherapy. The discriminatory ability and accuracy of the models were assessed using Harrell’s c-statistic and calibration plots at different time points in both training and validation datasets.
Results
Median follow-up was of 23 and 29 months in the MD Anderson and Institut Curie cohorts, respectively. Nomograms demonstrated good C-statistics: 0.74 for OS and 0.65 for PFS and discriminated OS prediction at 1, 2, and 5 years, and PFS prediction at 6 months and 1 and 2 years.
Conclusions
Nomograms, which relied on CTC counts as a continuous covariate, easily facilitated the use of a web-based tool for estimating survival, supporting treatment-decisions and clinical trial stratification in first-line MBC.
Keywords: circulating tumor cells, first-line, metastatic breast cancer, nomogram, survival
INTRODUCTION
The 5-year relative overall survival (OS) rate for women diagnosed with metastatic breast cancer (MBC) is low, around 23% (1). Several prognostic clinical and pathological characteristics have been reported to be independently associated with OS in MBC (2–4).
In 2004, the enumeration of circulating tumor cells (CTCs) by CellSearch in the peripheral blood of MBC patients was found to be a strong independent prognostic factor for survival and disease progression (5). These seminal findings were independently confirmed in other cohorts (6–15). In 2011, the IC2006-04 study conducted by the Institut Curie (Paris, France) confirmed the clinical value of CTCs in a prospective, specifically designed, statistically powered cohort of patients treated with first-line chemotherapy (10). These results demonstrate that CTCs are a level-of-evidence-1 prognostic marker in MBC. However, CTC enumeration is not the sole prognostic factor in MBC; prognostic evaluations of MBC patients should also consider the above-mentioned clinical-pathological characteristics.
The aim of this retrospective study was to combine CTC and other outcome predictors in a nomogram that would enable clinicians to assess the prognosis of patients starting a first-line chemotherapy for MBC. For this purpose, we used a training dataset from The University of Texas MD Anderson Cancer Center (Houston, TX, USA) to establish nomograms to calculate the predicted probability of OS and progression-free survival (PFS). The nomograms were validated using an independent dataset from the Institut Curie.
PATIENTS AND METHODS
The institutional review board at MD Anderson approved the study (DR10-0227) and granted a waiver of informed consent, considering the retrospective nature of the analysis.
Training Set
We searched the prospectively maintained laboratory database at MD Anderson to identify all MBC women who had undergone standard baseline CTC evaluations at the start of first-line treatment (with or without targeted therapy) between September 2002 and November 2009. Moreover, to be included in our study, patients were required to have measurable or evaluable disease. Specific details of the MD Anderson patient population have been reported in previous papers (13–15).
Validation Set
The validation set was obtained from the prospective IC 2006-04 study (NCT00898014) conducted from June 2007 to September 2009 in France. Two hundred sixty-seven MBC patients with measurable or evaluable disease, all undergoing chemotherapy-based first-line treatment (with or without targeted therapy), were included; all underwent baseline CTC evaluations using CellSearch. The patient, tumor, and treatment characteristics, together with the main results, were published after a median follow-up of 15 months (10, 16). For the current report, we used an actualized database, with a median follow-up of 29 months.
CTC Count
CTCs were isolated and counted from 7.5 mL of peripheral blood, using the United States Food and Drug Administration–cleared CellSearch system (Veridex, LLC, Raritan, New Jersey), as previously reported (17, 18). All CTC assessments were performed centrally, in the Clinical Laboratory Improvement Amendments-certified MD Anderson laboratory and Institut Curie laboratory, by experienced investigators.
Statistical Analysis
OS duration was defined as the time of basal blood draw for CTCs to the date of death. PFS duration was defined as the time of baseline blood draw to documentation of disease progression (according to RECIST criteria v1.1). For PFS and OS, patients were censored at the last follow-up date if they were still progression-free and alive, respectively.
We used Cox proportional hazards regressions analyses and Breslow’s estimator of the baseline survivor function to predict OS probabilities at 1, 2, and 5 years and PFS at 6 months and 1 and 2 years, respectively. We used estimated model coefficients to assign points to each characteristic and predictions from the model to map cumulative point totals for each outcome to estimated probabilities. For continuous variables, we used restricted cubic splines with 3 knots at the 10%, 50%, and 90% empirical quantiles, respectively to model continuous variables (19, 20). On the basis of findings from previous analyses of these two databases (10, 13), we included the following covariates in the model, according to a previously reported multivariable analysis performed for OS in the training set (13): age, disease subtype, visceral metastasis, Eastern Cooperative Oncology Group performance status, and CTCs as a continuous number (15). These covariates were mandatory in this analysis.
The discriminatory abilities of the models were assessed using Harrell’s c-statistic (19), evaluating the training sample (MD Anderson data) and validation sample (Institut Curie data). The accuracy of the nomogram was assessed using both samples via calibration plots. For the calibration plots, we averaged Cox predictions at 2 years within the quintiles of the ordered predictions. Within each quintile, we also estimated the unadjusted probability of death using Kaplan-Meier survival estimators. We then plotted unadjusted versus model average predictions. We used the model coefficients, as estimated in the training set, for the discrimination and calibration analyses in the test set. All statistical analyses were performed at Fox Chase Cancer Center (Philadelphia, Pennsylvania).
RESULTS
Patients
We identified 236 patients in the MD Anderson database who met the study’s inclusion criteria and for whom the mandatory covariates were known. Among the 267 patients included in the IC 2006-04 study, mandatory covariates were available in the database for 210 patients. Table 1 shows MD Anderson and Institut Curie patients’ pathologic and clinical prognostic factors. Patients in the MD Anderson dataset were younger (median, 49.6 vs. 54.5 years old, p=0.0004), and also had a better performance status (95.3% vs. 85.7% with performance status = 0 or 1, p<0.0001), which was consistent with a lower incidence of visceral metastases (61% vs. 80.5%, p<0.0001). Other covariates were well balanced, including the CTC count distribution. Table 2 shows the first-line therapies; the IC 2006-04 dataset did not include patients treated with endocrine therapy and was conducted later than the MD Anderson study, with a more frequent use of bevacizumab.
Table 1.
Patient and tumor characteristics
| Characteristics | MD Anderson | Institut Curie | P value | ||
|---|---|---|---|---|---|
| N | % | N | % | ||
| Total patients | 236 | 100 | 210 | 100 | - |
|
| |||||
| Age (years) | |||||
|
| |||||
| Median | 50 | 54 | 0.0004 | ||
| Mean | 50 | 58 | |||
| Range | 23–82 | 28–83 | |||
|
| |||||
| Receptor status | |||||
|
| |||||
| HR+, HER2-normal | 130 | 55 | 125 | 60 | 0.629 |
| HER2-amplified | 43 | 18 | 36 | 17 | |
| HR− and HER2-normal | 63 | 27 | 49 | 23 | |
|
| |||||
| Visceral metastasis | |||||
|
| |||||
| No | 92 | 39 | 41 | 20 | <0.0001 |
| Yes | 144 | 61 | 169 | 80 | |
|
| |||||
| Bone metastasis | |||||
|
| |||||
| No | 97 | 41 | 95 | 45 | 0.390 |
| Yes | 139 | 59 | 115 | 55 | |
|
| |||||
| No. of metastatic site | |||||
|
| |||||
| < 3 | 156 | 66 | 151 | 58 | 0.096 |
| ≥ 3 | 81 | 34 | 108 | 42 | |
|
| |||||
| ECOG performance status at CTC test | |||||
|
| |||||
| 0 or 1 | 225 | 95 | 180 | 86 | <0.0001 |
| > 1 | 11 | 5 | 30 | 14 | |
|
| |||||
| CTCs per 7.5 mL | |||||
|
| |||||
| 0–4 | 141 | 60 | 136 | 65 | 0.739 |
| 5–20 | 39 | 16 | 31 | 15 | |
| 21–40 | 21 | 9 | 15 | 7 | |
| > 40 | 35 | 15 | 28 | 13 | |
HR, hormone receptor; HER2, human epidermal growth factor 2; ECOG, Eastern Cooperative Oncology Group.
Table 2.
Treatments received
| Treatment | MD Anderson | Institut Curie | ||
|---|---|---|---|---|
| N | % | N | % | |
| Endocrine therapy | 47 | 20 | 0 | 0 |
| Chemotherapy | 110 | 47 | 79 | 38 |
| Chemotherapy + bevacizumab | 38 | 16 | 95 | 45 |
| Chemotherapy + trastuzumab | 32 | 13 | 36 | 17 |
| Chemotherapy + lapatinib | 9 | 4 | 0 | 0 |
Clinical Outcome
After median follow-ups periods of 23 and 29 months, 110 (46.6%) and 93 (44.3%) patients had died, respectively in the MD Anderson and Institut Curie datasets. As shown in Figure 1a, OS was not different (p=0.54) in the MD Anderson group (n=236) and in the Institut Curie group (n=210). The survival analysis and independent prognostic factors had been previously reported for the training cohort (13) and, with a shorter follow-up for the validation cohort (9). In the whole study population, we observed that the CTC count, if considered a continuous variable, was correlated with the hazard ratio of death (Figure 2). We found no significant difference between CTC-related hazard ratio of death between the MD Anderson and Institut Curie cohorts (p=0.85). The CTC count as a continuous variable provided a better estimate of the OS than did the CTC count as a dichotomized variable, using a threshold of 5 CTCs/7.5 mL of blood, with Harell’s C-statistic of 0.663 and 0.629, respectively (p value for difference, p=0.001).
Figure 1. Survival in US and French cohorts.
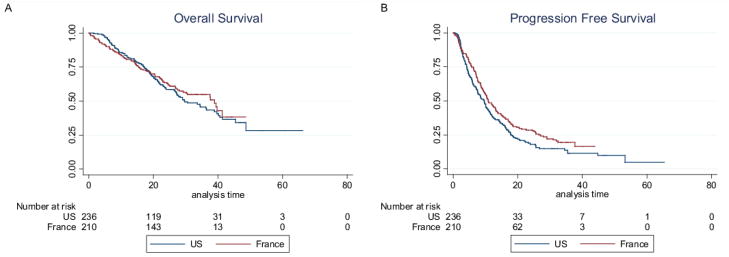
(A)OS and (B) PFS Kaplan-Meier curves for patients included in the nomogram training set (The University of Texas MD Anderson Cancer Center, Houston, TX, USA) and validation set (Institut Curie, Paris, France).
Figure 2. Hazard Ratios for OS according to continuous CTC count.

This figure was obtained in the whole population (N=446 patients)
In addition, 191 (80.9%) and 163 (77.6%) patients had experienced progression, respectively, in the MD Anderson and Institut Curie datasets; PFS turned out to be longer in the French cohort, in line with the differences in treatment modalities between the two groups (Figure 1b, p=0.03).
Outcome Prediction Nomogram
Nomograms were obtained for OS at 1, 2, and 5 years and PFS at 6 months and 1 and 2 years. Figure 3 shows the full nomograms for OS and PFS predictions at different time points. For example, a 45-year-old woman with hormone receptor-positive and HER2-negative breast cancer, presenting with no visceral metastasis, a performance status of 1, and a CTC count of 12 CTCs/7.5 mL, would have total scores of 107 and 90 points, according to the OS and PFS nomograms, respectively. Her probability of survival (i.e., OS) was 90% at 1 year, 71% at 2 years, and 38% at 5 years. Her probabilities of experiencing no disease progression after first-line treatment (i.e., PFS) were 73% at 6 months, 50% at 1 year, and 24% at 2 years. OS and PFS predictions can be calculated online for any patient via the Fox Chase Web site (CTConline) (21).
Figure 3. Nomograms for survival prediction.


The nomograms allow calculating OS (A) and PFS (B) probabilities at different time points.
The discriminatory ability of the model was evaluated in the training (MD Anderson) and validation (Institut Curie) samples. The Harrell’s C indexes for OS were 0.737 in the training set and 0.726 in the validation set; for PFS, they were 0.651 in both sets. Not taking into account the CTCs in our models would have led to significantly worse prediction performances for both OS (C index without CTCs in MD Anderson sample=0.653, in Institut Curie sample=0.699; p-value for CTC effect in model, p<0.0001) and PFS (C index without CTCs in MD Anderson sample=0.615, in Institut Curie sample=0.65; p-value for CTC effect in model, p<0.0001).
To assess the nomograms’ accuracy, we plotted actual OS and PFS probabilities against the calculated predicted probabilities of recurrence for each patient in the training and validation sets at different time points. Figure 4 shows good OS calibrations at 2 years and PFS at 1 year. Calibrations at all other time points are shown in Supplemental Figure 1 (online).
Figure 4. Calibration plots.

Calibration plots of (A) OS at 2 years and (B) PFS at 1 year in both cohorts. Cox predictions were averaged at 2 years within the quintiles of the ordered predictions. Within each quintile, the unadjusted probability of death using Kaplan-Meier survival estimators was estimated. We then plotted unadjusted versus model average predictions. The red line corresponds to the perfect prediction.
DISCUSSION
In this study, we established nomograms to predict clinical outcomes in a large cohort of patients undergoing first-line treatment for MBC at two different institutions. To our knowledge, our model is the first to consider the CTC count as a continuous variable, in combination with other well-established clinical-pathological characteristics; these variables were derived from a previously reported multivariable analysis of the training cohort (13). Our use of CTC count as a continuous prognostic factor was justified by our findings that a continuous count leads to a significantly more powerful prediction of OS than a dichotomized count. Moreover, among the other well-established covariates included in the nomograms, it is interesting that the prognostic value of HER2-positive MBC was even better than that of hormone receptor-positive cancers; this may be possibly explained by the fact that, at time of MD Anderson and Curie studies, metastatic HER2+ breast cancer patients received trastuzumab or lapatinib as part of their first line treatment, but were likely to have no prior exposure to these targeted therapies in the adjuvant setting, in contrast to hormone receptor positive cancer patients, who have relapsed despite adjuvant hormone therapy.
The validation step revealed that our model had good predictive value for OS, with a Harell’s C index of 0.74 in the MD Anderson cohort and of 0.73 in the Institut Curie cohort. Furthermore, nomograms for OS predictions at 1, 2, and 5 years revealed good calibration plots in both cohorts and can be considered validated. In contrast, the model for PFS prediction was less predictive, with a Harell’s C index of 0.65 in both cohorts. However, good calibration plots were also obtained at all time points tested for PFS (6 months and 1 and 2 years). The difference between OS and PFS prediction performances can be explained considering that OS globally relies on tumor biology and tumor burden, both of which were taken into account in our model, whereas PFS also depends on numerous predictive factors of response to treatment, which are treatment-specific and were not considered in our model. We further hypothesize that taking into account early CTC changes under treatment would be necessary to get a better estimate of the PFS. Including treatment type (e.g., hormone therapy or bevacizumab) in our model did not further improve its performance (data not shown); therefore, it was not included in the reported nomograms. Of note, the validation cohort received exclusively chemotherapy regimens. Therefore, the nomograms presented here cannot be reasonably applied to patients for whom first-line endocrine therapy appears to be the best treatment choice. However, for those treated with chemotherapy, these nomograms showed high performances.
The dedicated web interface (CTConline) (21) is an easy-to-use web platform that clinicians, researchers and patients can use to predict OS and PFS for first-line MBC patients, using the validated nomograms obtained in this study. CTCs as a decision tool to choose between hormone therapy or chemotherapy as first line treatment is currently investigated by the STIC CTC randomized phase III trial (22). Similar trial should be set up to estimate whether these nomograms help clinician to choose the right treatment intensity, using or not polychemotherapy and/or combined targeted therapy.
Supplementary Material
TRANSLATIONAL RELEVANCE.
In the past 50 years, several prognostic clinical and pathological characteristics have been reported to be independently associated with overall survival and different prognostic indexes that combine these parameters have been proposed to predict outcomes of metastatic breast cancer patients. Over the past 8 years, we have demonstrated the independent prognostic value of CTCs in patients with advanced breast cancer. The data have been confirmed by independent groups and strengthened the evidence for the clinical value of measuring CTCs as standard of care for these patients. In this study we combined CTCs and other outcome predictors in a nomogram that would empower clinicians to assess the prognosis of patients starting first-line chemotherapy for metastatic breast cancer. The dedicated web interface (CTConline) is an easy-to-use open web-platform that clinicians, researchers and patients can use to predict overall survival and progression-free survival for metastatic breast cancer patients receiving first-line therapies.
Acknowledgments
Funding:
The IC 2006-04 study was funded by a grant from the French government (PHRC AOM06156). François-Clement Bidard received a fellowship from the Nuovo-Soldati foundation for cancer research. Brian L. Egleston’s contribution was subsidized by the Fox Chase Cancer Center core grant (number NCI P30CA006927).
We wish to thank Ann M. Sutton from the Department of Scientific Publications at The University of Texas M D Anderson Cancer Center for editing the manuscript. This study has been presented in part at the 2012 San Antonio Breast Cancer Symposium.
Footnotes
Potential Conflicts of Interest:
François-Clement Bidard received speaker honoraria from Veridex. Jean-Yves Pierga received speaker honoraria and research grants from Veridex. The other co-authors have no conflicts to declare.
References
- 1.American Cancer Society. Breast Cancer Facts & Figures 2011–2012. www cancer gov. 2012 [cited 2012 Jan 20];Available from: URL: www.cancer.gov.
- 2.Burstein HJ, Harris JR, Morrow M. Malignant Tumors of the Breast. In: DeVita VT, Lawrence TS, Rosenberg SA, editors. Cancer Principles & Practice of Oncology. 9. Philadelphia, PA: Lippincott Williams & Wilkins; 2011. [Google Scholar]
- 3.Yamamoto N, Watanabe T, Katsumata N, Omuro Y, Ando M, Fukuda H, et al. Construction and validation of a practical prognostic index for patients with metastatic breast cancer. J Clin Oncol. 1998;16:2401–8. doi: 10.1200/JCO.1998.16.7.2401. [DOI] [PubMed] [Google Scholar]
- 4.Puente J, Lopez-Tarruella S, Ruiz A, Lluch A, Pastor M, Alba E, et al. Practical prognostic index for patients with metastatic recurrent breast cancer: retrospective analysis of 2,322 patients from the GEICAM Spanish El Alamo Register. Breast Cancer Res Treat. 2010;122:591–600. doi: 10.1007/s10549-009-0687-4. [DOI] [PubMed] [Google Scholar]
- 5.Cristofanilli M, Budd GT, Ellis MJ, Stopeck A, Matera J, Miller MC, et al. Circulating tumor cells, disease progression, and survival in metastatic breast cancer. N Engl J Med. 2004;351:781–91. doi: 10.1056/NEJMoa040766. [DOI] [PubMed] [Google Scholar]
- 6.Cristofanilli M, Hayes DF, Budd GT, Ellis MJ, Stopeck A, Reuben JM, et al. Circulating tumor cells: a novel prognostic factor for newly diagnosed metastatic breast cancer. J Clin Oncol. 2005;23:1420–30. doi: 10.1200/JCO.2005.08.140. [DOI] [PubMed] [Google Scholar]
- 7.Nole F, Munzone E, Zorzino L, Minchella I, Salvatici M, Botteri E, et al. Variation of circulating tumor cell levels during treatment of metastatic breast cancer: prognostic and therapeutic implications. Ann Oncol. 2008;19:891–7. doi: 10.1093/annonc/mdm558. [DOI] [PubMed] [Google Scholar]
- 8.Maestro LM, Sastre J, Rafael SB, Veganzones SB, Vidaurreta M, Martin M, et al. Circulating tumor cells in solid tumor in metastatic and localized stages. Anticancer Res. 2009;29:4839–43. [PubMed] [Google Scholar]
- 9.Bidard FC, Mathiot C, Degeorges A, Etienne-Grimaldi MC, Delva R, Pivot X, et al. Clinical value of circulating endothelial cells and circulating tumor cells in metastatic breast cancer patients treated first line with bevacizumab and chemotherapy. Ann Oncol. 2010 doi: 10.1093/annonc/mdq052. [DOI] [PubMed] [Google Scholar]
- 10.Pierga JY, Hajage D, Bachelot T, Delaloge S, Brain E, Campone M, et al. High independent prognostic and predictive value of circulating tumor cells compared with serum tumor markers in a large prospective trial in first-line chemotherapy for metastatic breast cancer patients. Ann Oncol. 2011 doi: 10.1093/annonc/mdr263. [DOI] [PubMed] [Google Scholar]
- 11.Liu MC, Shields PG, Warren RD, Cohen P, Wilkinson M, Ottaviano YL, et al. Circulating tumor cells: a useful predictor of treatment efficacy in metastatic breast cancer. J Clin Oncol. 2009;27:5153–9. doi: 10.1200/JCO.2008.20.6664. [DOI] [PMC free article] [PubMed] [Google Scholar]
- 12.Nakamura S, Yagata H, Ohno S, Yamaguchi H, Iwata H, Tsunoda N, et al. Multi-center study evaluating circulating tumor cells as a surrogate for response to treatment and overall survival in metastatic breast cancer. Breast Cancer. 2009 doi: 10.1007/s12282-009-0139-3. [DOI] [PubMed] [Google Scholar]
- 13.Giordano A, Giuliano M, De LM, Arpino G, Jackson S, Handy BC, et al. Circulating tumor cells in immunohistochemical subtypes of metastatic breast cancer: lack of prediction in HER2-positive disease treated with targeted therapy. Ann Oncol. 2011 doi: 10.1093/annonc/mdr434. [DOI] [PubMed] [Google Scholar]
- 14.Giuliano M, Giordano A, Jackson S, Hess KR, De GU, Mego M, et al. Circulating tumor cells as prognostic and predictive markers in metastatic breast cancer patients receiving first-line systemic treatment. Breast Cancer Res. 2011;13:R67. doi: 10.1186/bcr2907. [DOI] [PMC free article] [PubMed] [Google Scholar]
- 15.Giordano A, Giuliano M, De LM, Eleuteri A, Iorio F, Tagliaferri R, et al. Artificial neural network analysis of circulating tumor cells in metastatic breast cancer patients. Breast Cancer Res Treat. 2011;129:451–8. doi: 10.1007/s10549-011-1645-5. [DOI] [PubMed] [Google Scholar]
- 16.Bidard FC, Hajage D, Bachelot T, Delaloge S, Brain E, Campone M, et al. Assessment of circulating tumor cells and serum markers for progression-free survival prediction in metastatic breast cancer: a prospective observational study. Breast Cancer Res. 2012;14:R29. doi: 10.1186/bcr3114. [DOI] [PMC free article] [PubMed] [Google Scholar]
- 17.Allard WJ, Matera J, Miller MC, Repollet M, Connelly MC, Rao C, et al. Tumor cells circulate in the peripheral blood of all major carcinomas but not in healthy subjects or patients with nonmalignant diseases. Clin Cancer Res. 2004;10:6897–904. doi: 10.1158/1078-0432.CCR-04-0378. [DOI] [PubMed] [Google Scholar]
- 18.Riethdorf S, Fritsche H, Muller V, Rau T, Schindlbeck C, Rack B, et al. Detection of circulating tumor cells in peripheral blood of patients with metastatic breast cancer: a validation study of the CellSearch system. Clin Cancer Res. 2007;13:920–8. doi: 10.1158/1078-0432.CCR-06-1695. [DOI] [PubMed] [Google Scholar]
- 19.Harrell FE., Jr . Regression Modeling Strategies. Springer; 2001. General Aspects of Fitting Regression Models; pp. 17–60. [Google Scholar]
- 20.Kattan MW, Heller G, Brennan MF. A competing-risks nomogram for sarcoma-specific death following local recurrence. Stat Med. 2003;22:3515–25. doi: 10.1002/sim.1574. [DOI] [PubMed] [Google Scholar]
- 21.http://cancernomograms.com/CTCOnline.html
- 22.Bidard FC, Fehm T, Ignatiadis M, Smerage JB, Alix-Panabieres C, Janni W, et al. Clinical application of circulating tumor cells in breast cancer: overview of the current interventional trials. Cancer Metastasis Rev. 2012 doi: 10.1007/s10555-012-9398-0. [DOI] [PMC free article] [PubMed] [Google Scholar]
Associated Data
This section collects any data citations, data availability statements, or supplementary materials included in this article.