

Abstract
Objective:
To determine whether a high prevalence (55%) of Aβ deposition in a cohort of individuals remaining dementia-free into their 9th and 10th decades is associated with cognitive decline prior to imaging.
Methods:
A total of 194 participants (mean age 85.5 years, range 82–95) who completed the Ginkgo Evaluation of Memory Study (GEMS) and remained dementia-free subsequently completed Pittsburgh compound B–PET imaging. We examined cross-sectional associations between Aβ status and performance on a broad neuropsychological test battery completed at GEMS entry 7–9 years prior to neuroimaging. We also longitudinally examined cognition over annual evaluations using linear mixed models.
Results:
At GEMS screening (2000–2002), participants who were Aβ-positive in 2009 had lower performance on the Stroop test (p < 0.01) and Raven's Progressive Matrices (p = 0.05), with trend level difference for Block Design (p = 0.07). Longitudinal analyses showed significant slope differences for immediate and delayed recall of the Rey-Osterrieth figure, semantic fluency, and Trail-Making Test parts A and B, indicating greater performance decline prior to neuroimaging for Aβ-positive relative to Aβ-negative participants (ps < 0.05).
Conclusions:
Highly prevalent Aβ deposition in oldest-older adults is associated with cognitive decline in visual memory, semantic fluency, and psychomotor speed beginning 7–9 years prior to neuroimaging. Mean differences in nonmemory domains, primarily executive functions, between Aβ-status groups may be detectable 7–9 years before neuroimaging.
It has long been observed that a significant number of older adults without dementia show Aβ plaques and neurofibrillary tangles at autopsy.1 This proportion increases with age,2 with up to 40% of 80+-year-olds showing neuropathologic Alzheimer disease (AD).3 Such high proportions provoke questions about the clinical significance of the pathology in this advanced age group.
In vivo Aβ imaging studies indicate a 20%–30% prevalence of Aβ deposition in asymptomatic older adults.4–6 Supporting the premise that Aβ in asymptomatic older adults signifies preclinical AD, several studies reported cognitive decline in healthy Aβ-positive individuals followed longitudinally (typically preimaging, as prospective follow-up studies are still ongoing).7–9 Others reported AD-like features include reduced cortical thickness,10 reduced hippocampal volume,7 and increased risk for eventual progression to AD.11
The reports above primarily studied participants aged 65–80 years. Recently, we reported 55% of a sample without dementia with mean age 85.5 years showing Aβ deposition on imaging with Pittsburgh compound B (PiB) PET,12 including 51% of those assessed as cognitively normal. This is the highest proportion of PiB-positive scans reported to date in a normal sample. Unknown is whether Aβ pathology among people 80 and older is normative of the aging process and more likely to be cognitively benign. The present study reports on cognitive trajectories from detailed evaluations of these participants beginning 9 years preceding neuroimaging. The question framing these analyses was whether this high prevalence of Aβ is associated with detectable cognitive sequelae among individuals remaining dementia-free well into their 80s and entering their 90s.
METHODS
Participants.
The Ginkgo Evaluation of Memory Study (GEMS; 2000–2008) was a multisite, placebo-controlled, double-blind, randomized clinical trial of 240 mg daily dose of Ginkgo biloba in 3,069 community-dwelling participants 72–96 years old. Exclusion criteria were reported in detail elsewhere13 but included prevalent dementia, use of cholinesterase inhibitors or other psychotropic medication, recent hospitalization for depression, Parkinson disease, abnormal blood/serum tests at screening, or disease-limited life expectancy of <5 years. Median follow-up time from randomization was 6.1 years. Study visits occurred at 6-month intervals; cognitive, genetic (including APOE genotyping), functional, and informant-reported variables were collected.14 Incident dementia was a study endpoint. Overall, mortality was 12.3%; lost to follow-up 6.3%; progression to dementia was 17.0%. The primary study outcome of dementia incidence was negative for a treatment effect,13 as were secondary outcomes of cognitive decline across multiple cognitive domains15 and cardiovascular events.16
In 2009, 197 participants from the Pittsburgh site were recruited into the GEMS Imaging Sub-Study. Inclusion criterion was completion of the GEMS protocol. Exclusion criteria were 1) dementia at GEMS closeout; and 2) contraindications for neuroimaging. Compared to all 671 Pittsburgh site participants who completed the GEMS protocol and did not reach a dementia endpoint, the Imaging Sub-Study participants were younger (84.0 [SD 2.8] vs 84.4 [SD 3.0] years at 2008 closeout, p = 0.03) but comparable in sex, race, education, APOE ε4 status, estimated premorbid IQ, and estimated income by zip code (p > 0.05). Compared to all 966 Pittsburgh site participants at GEMS baseline, they were younger, had higher estimated premorbid IQ (p < 0.05), but did not differ by sex, race, education, APOE ε4 status, or estimated income (p > 0.05). Three participants were subsequently excluded for technical difficulties with PET scanning; thus 194 were entered into the present study.
Cognitive assessments.
Neuropsychological testing.
All participants completed a comprehensive neuropsychological test battery at GEMS screening and repeated it annually starting in 2004 (approximately 3–4 years after screening). Memory tests included the California Verbal Learning Test (CVLT) and recall conditions of a modified Rey-Osterrieth (R-O) Figure Test.17 Tests of visual-spatial construction included the copy condition of the R-O Figure Test and a modified Wechsler Adult Intelligence Scale–Revised (WAIS-R) Block Design.18 Language tests included a 30-item Boston Naming Test (BNT),19 semantic (animals) and letter (FAS) verbal fluency. Tests of attention and psychomotor speed included the WAIS-R Digit Span and the Trail-Making Test Part A. Tests of executive functions included the Trail-Making Test Part B and the Trenarry Stroop Color/Word Test. Depressive symptoms were measured by the Center for Epidemiologic Studies Depression (CES-D) scale.20 Two tests were administered during GEMS screening only: the National Adult Reading Test–American version, estimating premorbid verbal IQ, and Raven's Progressive Matrices, a measure of nonverbal inductive reasoning. (All standard neuropsychological tests described and cited in reference 21.)
In the GEMS Imaging Sub-Study, all tests from the GEMS core neuropsychologic battery were repeated except Block Design, Digit Span, BNT, and the Stroop Test.
Adjudication of cognitive status and course.
The GEMS Cognitive Diagnostic Center14 completed adjudication in the Imaging Sub-Study, blind to PiB-PET results, taking into account historical serial cognitive assessments from the parent GEM study. Criteria for mild cognitive impairment (MCI) included 1–3 tests impaired at cutoffs of 1.5 SD below age- and education-adjusted means. Cognitive course for participants with normal cognition was adjudicated as “normal-stable” (consistently normal throughout the parent GEM Study), “normal-reverted” (MCI to normal), or “normal-unstable” (normal to MCI to normal). For MCI, cognitive course was adjudicated as “MCI-stable” (consistently MCI), “MCI-progressed” (normal to MCI), or “MCI-unstable” (MCI to normal to MCI). Of note, “normal” vs “MCI” status refers to final classification at the time of imaging (2009).
Clinical Dementia Rating scale.
The Clinical Dementia Rating (CDR),22 a structured interview of cognitively driven decline based on proxy report, was administered every 6 months during each GEMS visit but not at the 2009 Imaging Sub-Study.
Neuroimaging.
A structural 1.5 T MRI (GE Signa) was acquired prior to PET imaging. PET data were acquired for 20 minutes (4 × 5 minute frames) beginning 50 minutes after injection of 15 ± 1.5 mCi of PiB on a Siemens/CTI ECAT HR+ scanner in 3D imaging mode (63 planes with slice width 2.4 mm). PET data were reconstructed using filtered back-projection (Fourier rebinning and 2D backprojection with Hann filter kernel full width at half maximum = 3 mm). Postinjection transmission scans were acquired using 68Ge/68Ga rods. PiB-PET data were corrected for photon attenuation, scatter, and radioactive decay. The final reconstructed PET image resolution was about 6 mm (transverse and axial).
Image coregistration and automated regional sampling of the PiB-PET data were performed, as recently described.23 Regions of interest (ROI) were hand-drawn on a template that was a high-resolution MRI of a single elderly subject with MCI. The ROI included 5 primary cortical areas (anterior cingulate, frontal, lateral temporal, parietal, and precuneus), which comprised a global composite region, and the cerebellum. The PiB tissue uptake was measured over the 50–70 minute scan interval and scaled to injected dose and body mass to generate standardized uptake value (SUV) images. The SUV images were then normalized to the SUV of the cerebellum reference region to generate images of the SUV ratio (SUVR) measure of PiB retention. The ROI were automatically applied to sample each individual's PiB SUVR image that had been spatially normalized to the MCI template. A correction for atrophy-related CSF dilution was applied.
Using an iterative mild outlier cutoff method based on an independent sample of 62 controls,5 we defined Aβ-negative and Aβ-positive status by a global cortical cutoff of SUVR = 1.57.
Standard protocol approvals, registrations, and patient consents.
The University of Pittsburgh institutional review board approved the use of human subjects for this study. All participants provided informed, written consent.
Data analysis.
Cognitive decline in neuropsychological test scores throughout the parent GEM study until the Imaging Sub-Study was analyzed with linear mixed models. All 194 participants were included. Predictors were Aβ status and time in years from GEMS screening. Number of study visits was limited to a maximum of 6 for each participant (n = 190; n = 4 completed 5 visits). The Aβ status × time interaction term was of interest, estimating the average annual difference in slopes between Aβ-positive and Aβ-negative groups. In addition to linear models, we used mixed models with time as a class variable to derive individual estimates of test performance for each group at each timepoint. Change in CDR sum-of-box score over time was analyzed with linear mixed models.
Clinically adjudicated cognitive course was analyzed with logistic and multinomial regression models, with Aβ status as a predictor. Due to small ns, the normal cognitive course categories “normal-reverted” (n = 7) and “normal-unstable” (n = 28) were collapsed to “ever-MCI.”
All models were run with and without adjustment for age, sex, education, and race, and with further adjustment for CES-D depression score. Models were not adjusted for APOE ε4 status because, conceptually, APOE and Aβ are expected to share downstream effects on behavior along the same biologic pathway; statistically, we considered the strongly shared variance between APOE ε4 and Aβ status as meaningful rather than confounding. We examined the effect of APOE ε4 status separately on cognitive outcomes. Statistical analyses were performed in SAS (version 9.2) and SPSS (version 18).
RESULTS
Of the total 194 participants, 107 (55.2%) were classified as Aβ-positive. The Aβ-status groups did not differ on demographic factors, but the Aβ-positive group had a higher proportion of APOE ε4 carriers (table 1). At the time of PiB-PET imaging, 152 participants were clinically adjudicated as cognitive scores consistent with normal cognition, 38 had scores consistent with MCI, 3 had scores consistent with dementia, and 1 participant could not be adjudicated due to sensory impairment. Aβ-positive participants had worse mean scores (p ≤ 0.05) on semantic fluency and Trails A, while 3 other mean score differences approached significance: Trails B (p = 0.06), CVLT learning trials (p = 0.07), and Rey figure recall (p = 0.08). Detailed PiB-PET imaging results and associations with concurrent cognitive variables and APOE ε4 status have been previously reported.12
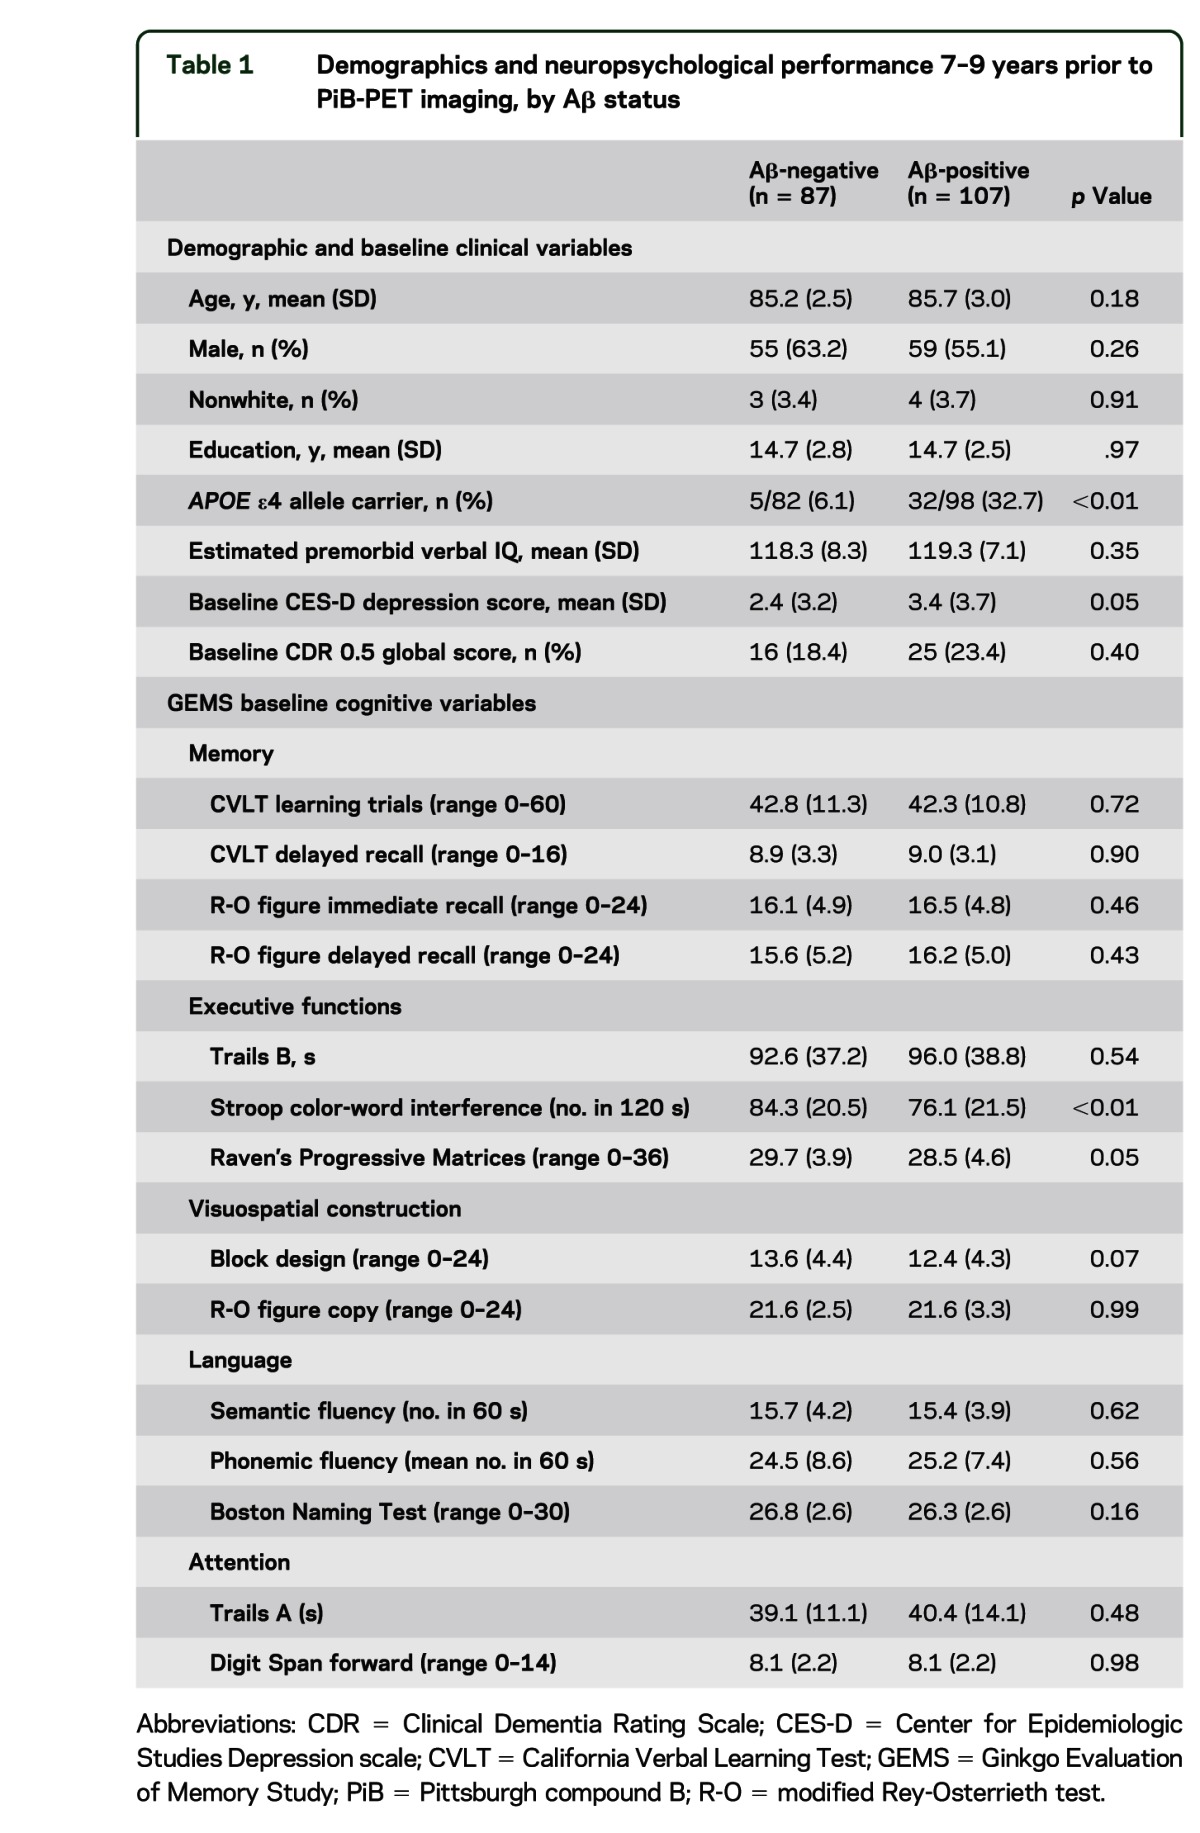
Table 1.
Demographics and neuropsychological performance 7–9 years prior to PiB-PET imaging, by Aβ status
Cognitive and clinical status at GEM study baseline.
Table 1 summarizes GEM baseline clinical and cognitive variables from 7 to 9 years prior to PiB-PET imaging (mean 7.6, SD 0.6 years). Of note, estimated premorbid verbal IQ did not differ between Aβ-status groups; however, Aβ-positive participants reported a higher number of depressive symptoms 7–9 years prior to neuroimaging. With regard to cognitive test performance at baseline, Aβ-positive participants had lower performance on the Stroop test, Raven's Progressive Matrices, and trend level for Block Design. Adjusting for demographics did not change results. In models with further adjustment for depression score, only Stroop remained significant, with a trend (p < 0.10) difference for the Matrices.
Change over time in neuropsychological test scores.
Table 2 presents linear mixed model results of annual change in neuropsychological test performance. Mean annual change in raw test score units is presented for each Aβ-status group, with 95% confidence intervals (CIs). Of note, if the CI includes 0, there is no significant linear slope (i.e., annual change over time) for that test. Of interest was the Aβ status × time interaction term to address the hypothesis of greater decline in Aβ-positive relative to Aβ-negative participants. A significant difference in slopes was observed for immediate and delayed recall of the R-O figure, semantic fluency, and Trail-Making Test parts A and B, in the direction of greater performance decline in Aβ-positive relative to Aβ-negative participants. A main effect for Aβ status was significant for the following models: Stroop (p < 0.01) and Block Design (p = 0.03) (not shown in table). Main results did not differ when models were adjusted for demographics with and without depression score. Results also did not differ with the removal of 3 participants with cognitive scores consistent with dementia at the time of neuroimaging and one with sensory impairment precluding cognitive adjudication.
Table 2.
Annual rates (±95% CI) of change in Aβ groups on neuropsychological tests over 7–9 years prior to PiB-PET imaginga

Figure 1 and figure e-1 on the Neurology® Web site at www.neurology.org show change over time in neuropsychological test performance by estimates of mean scores for each group at each timepoint. These graphical results are descriptive and unadjusted for covariates; they convey varying trajectories of different cognitive test scores by Aβ status in the years preceding neuroimaging (time 0). Of note, some tests show overall decline over time (e.g., figure e-1, Trails A and B), whereas others show improvement reflecting practice effects (e.g., figure 1, letter fluency). With regard to the time course of Aβ-status differences, memory tests (figure 1, CVLT, and figure e-1, R-O recalls) and semantic fluency (figure 1) began to differ between groups approximately 2.5 years prior to neuroimaging, whereas differences in executive/psychomotor scores (Trails A and B) were apparent around 4.5 years prior. Stroop performance (figure 1), reflecting executive inhibitory control, differed between groups an average of 8 years prior to neuroimaging and remained so, with both groups declining at similar rates.
Figure 1. Different patterns of cognitive change over time by Aβ-status group and by test.

Mean cognitive performance by Aβ-status groups (±SE) estimated from mixed models at discrete timepoints, showing patterns of change over time varying by neuropsychological test: (A) steeper decline in semantic verbal fluency in the Aβ-positive compared to Aβ-negative group; (B) practice effects over time on phonemic verbal fluency in both groups; (C) practice effects on verbal learning in both groups until approximately 2.5 years before neuroimaging, then decline in the Aβ-positive group but continued practice effect in the Aβ-negative group; (D) similar rates of decline in inhibitory control in both groups, with consistently lower performance in the Aβ-positive group. CVLT = California Verbal Learning Test.
Results of linear mixed models using APOE ε4 carrier status as the group predictor yielded results similar to Aβ status (group × time interaction term, table 2), with the following exceptions: significant slope differences (p < 0.05) additionally included CVLT delayed recall and Stroop, while these terms were not significant for Trails B and semantic fluency.
Adjudication of clinical course.
Tables 3 and 4 show the distribution of Aβ status by adjudicated course of cognition. Table 3 refers to 152 participants adjudicated as normal cognition at the time of neuroimaging, by course subtypes “never MCI” (consistently normal cognition throughout the parent GEM study) vs “ever-MCI” (at least one past evaluation with scores consistent with MCI), and no difference in the proportions of Aβ-positive status between them. Table 4 shows course subtypes for 38 MCI participants, with the largest proportion of Aβ-positive cases in the MCI-unstable group, the lowest proportion in the small MCI-stable group, and the MCI-progressed group falling in the middle. These differences were not significant in unadjusted models and adjusted models (ps > 0.10). Results were the same for APOE ε4 status as the grouping variable.
Table 3.
Distribution of Aβ status in participants with normal cognition at the time of imaging, by clinical course subtypes
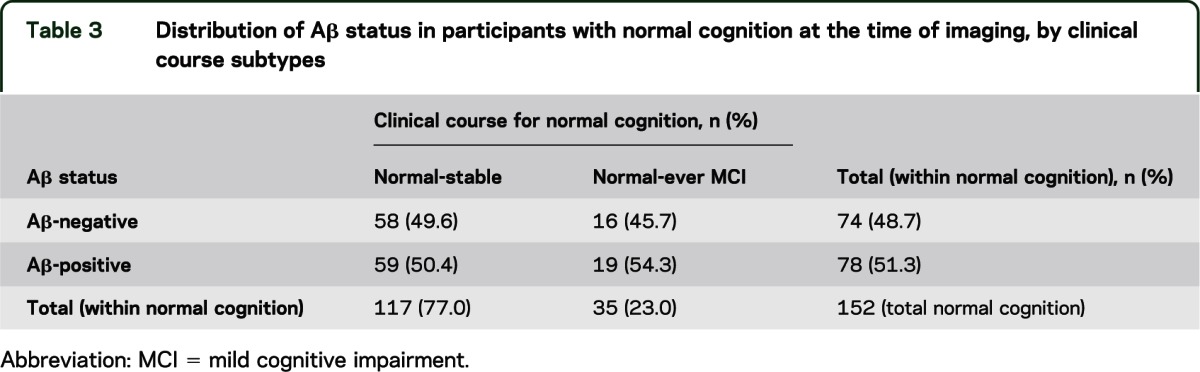
Table 4.
Distribution of Aβ status in participants with MCI at the time of imaging, by clinical course subtypes

Change in CDR sum-of-box score.
Linear mixed models yielded no significant change over time in CDR sum-of-box scores for Aβ-negative (p > 0.30) or for Aβ-positive groups (p > 0.50), and no Aβ status × time interaction (p > 0.20). Results did not differ when models were adjusted for demographics with and without additional adjustment for depression. Results were the same for APOE ε4 status as the grouping variable.
DISCUSSION
We have shown in older adults who remain dementia-free into their 80s and 90s that presence of Aβ is associated with cognitive decline throughout a range of 7–9 years prior to imaging. We have also shown subtle differences in nonmemory domains, primarily executive functions, between Aβ-status groups detectable 7–9 years before neuroimaging.
Different cognitive trajectories over time were observed depending on the cognitive task. Some tests showed greater annual decline in Aβ-positive than Aβ-negative participants, for instance, tests of psychomotor speed and working memory, visual memory, and semantic fluency. A task tapping inhibitory control showed parallel rates of decline but poorer performance in Aβ-positive participants throughout the observed time period. In descriptive analyses, verbal declarative memory showed practice effects until approximately 2.5 years before imaging, with a subsequent decline in the Aβ-positive group, a later decline than those observed in nonmemory measures. In our study, the observation that nonmemory domains appeared as earlier cognitive correlates of Aβ deposition than did memory is likely strongly influenced by the selection of participants who were regularly screened over time for dementia.13
The natural history of pathologic Aβ accumulation, individual variability in rates of fibrillar Aβ deposition, as well as differences in cognitive tolerance of Aβ24 are factors not yet understood. While the single PiB-PET imaging design in 2009 of the present study precludes conclusion about causality of cognitive effects in 2000–2002, it is consistent with accumulating evidence that even early prefibrillar forms of Aβ can affect synaptic loss,25 cortical neuronal dysfunction,26 and cognitive changes.27 Of note, similar effects on cognitive decline were observed according to APOE ε4 carriage, independent of Aβ status, although APOE and Aβ are confounded in this sample as very few ε4 carriers were Aβ-negative (5/37).
Our findings are consistent with previous reports in cognitively screened younger-old participants.7–9 One study7 similarly found greater longitudinal decline on tests of visuospatial ability and working memory in Aβ-positive compared to Aβ-negative individuals with CDR = 0 and mean age of 75; decline in episodic memory did not differ between groups. Another report8 observed greater decline in mental status, executive functions (Trails B), and verbal memory (CVLT) associated with higher PiB retention in individuals without dementia with mean age of 78 years from the Baltimore Longitudinal Study of Aging. The CVLT finding may be related to the longer assessment period (range of 8–12.5 years), or to the younger age distribution of the sample (range 62–92). Consistent among reports of older individuals screened for dementia, however, is that the rates of longitudinal cognitive decline are small, as expected, and that the effect sizes of Aβ on differences in annual rates of decline are correspondingly very small, representing fractions of performance points. Such small effects require sufficient power in study design to detect, and they pose clinical challenges for detection of subtle individual cognitive decline over time as an identifiable risk factor.
The concept of within-person variability as a potential risk factor for dementia or subsequent cognitive decline has some support.28,29 In the current study, within-person across-occasion variability was considered on a clinical-adjudication basis. Adjudicated cognitive trajectories (course) may be useful to take into account for MCI. MCI with history of change (“unstable” or “progressive” MCI) may be more likely associated with Aβ pathology than stable MCI; however, confirmation of this distinction with larger samples is needed. Adjudicated cognitive course in participants with normal cognition (never-MCI vs ever-MCI) was not associated with Aβ pathology, suggestive that current cognitive status is a stronger predictive of the presence of Aβ than is retrospective course, at least with regard to clinical diagnosis.
Depressive symptoms were also a correlate of Aβ deposition. While clinical depression was not assessed this study, the finding of Aβ-status differences on the level of mean depressive symptom count is notable in light of growing evidence for an association between history of depression and risk for AD,30 and between late-life depression and presence of AD-like Aβ deposition.31
We have shown that Aβ deposition among oldest-old dementia-free survivors is associated with greater longitudinal cognitive decline. AD-like Aβ deposition, measurable in about half of the population without dementia in the 9th and 10th decades of life, has demonstrable, if subtle, cognitive and behavioral correlates. Further work is needed to develop more sensitive cognitive measures predictive of early presence of AD pathology in anticipation of targeted Aβ interventions.
Supplementary Material
GLOSSARY
- AD
Alzheimer disease
- BNT
Boston Naming Test
- CDR
Clinical Dementia Rating
- CES-D
Center for Epidemiologic Studies Depression scale
- CI
confidence interval
- CVLT
California Verbal Learning Test
- GEMS
Ginkgo Evaluation of Memory Study
- MCI
mild cognitive impairment
- PiB
Pittsburgh compound B
- R-O
Rey-Osterrieth
- ROI
regions of interest
- SUV
standardized uptake value
- SUVR
SUV ratio
- WAIS-R
Wechsler Adult Intelligence Scale–Revised
Footnotes
Supplemental data at www.neurology.org
AUTHOR CONTRIBUTIONS
Dr. Snitz: study concept and design, data review and interpretation, drafting of manuscript, drafting figures, manuscript revisions, clinical adjudication of cognitive outcomes. Dr. Weissfeld: data analysis and interpretation. Dr. Lopez: study concept and design, clinical adjudication of cognitive outcomes, data interpretation, critical review of manuscript. Dr. Kuller: study supervision, data collection, data interpretation, critical review of manuscript. Dr. Saxton: data interpretation, clinical adjudication of cognitive outcomes, critical review of manuscript. Ms. Singhabahu: data analysis and interpretation. Dr. Klunk: data collection, data interpretation, critical review of manuscript. Dr. Mathis: data collection, data interpretation, critical review of manuscript. Dr. Price: data collection, review of imaging data and study supervision, critical review of manuscript. Ms. Ives: study supervision, data collection, administrative support, clinical adjudication of cognitive outcomes, critical review of manuscript. Dr. Cohen: review of imaging data, critical review of manuscript. Dr. McDade: data interpretation, critical review of manuscript. Dr. DeKosky: study concept and design, funding, data interpretation, critical review of manuscript.
STUDY FUNDING
Supported by NIH grants K23 AG038479, U01 AT000162, P01 AG025204, R37 AG025516.
DISCLOSURE
B.E. Snitz and L.A. Weissfeld report no disclosures. O.L. Lopez has served as a consultant for Lilly, Lundbeck, Merz, and Novartis. L.H. Kuller reports no disclosures. J. Saxton served as a consultant for Forest Pharmaceuticals, Inc. D. Singhabahu reports no disclosures. W.E. Klunk is a coinventor of PiB, a technology described in this manuscript. As such, he has a financial interest in the license agreement, which GE Healthcare holds with the University of Pittsburgh. He has served as consultant to GE Healthcare, Janssen, Pfizer, Lilly, AstraZeneca, Wyeth, Roche, and Elan. C.A. Mathis is a coinventor of PiB, a technology described in this manuscript. As such, he has a financial interest in the license agreement, which GE Healthcare holds with the University of Pittsburgh. He has served as a consultant for GE Healthcare, Elan/Wyeth, Novartis, Janssen, Genzyme, Pfizer, Bristol Myers Squibb, IBA, and Baxter Bioscience. J.C. Price, D.G. Ives, A.D. Cohen, and E. McDade report no disclosures. S.T. DeKosky has served as consultant for Merck, Elan/Wyeth, Lilly, Novartis, Janssen, Helicon Therapeutics, and Genzyme. Go to Neurology.org for full disclosures.
REFERENCES
- 1.Bennett DA, Schneider JA, Arvanitakis Z, et al. Neuropathology of older persons without cognitive impairment from two community-based studies. Neurology 2006;66:1837–1844 [DOI] [PubMed] [Google Scholar]
- 2.Braak H, Braak E. Frequency of stages of Alzheimer-related lesions in different age categories. Neurobiol Aging 1997;18:351–357 [DOI] [PubMed] [Google Scholar]
- 3.Price JL, McKeel DW, Jr, Buckles VD, et al. Neuropathology of nondemented aging: presumptive evidence for preclinical Alzheimer disease. Neurobiol Aging 2009;30:1026–1036 [DOI] [PMC free article] [PubMed] [Google Scholar]
- 4.Mintun MA, Larossa GN, Sheline YI, et al. [11C]PIB in a nondemented population: potential antecedent marker of Alzheimer disease. Neurology 2006;67:446–452 [DOI] [PubMed] [Google Scholar]
- 5.Aizenstein HJ, Nebes RD, Saxton JA, et al. Frequent amyloid deposition without significant cognitive impairment among the elderly. Arch Neurol 2008;65:1509–1517 [DOI] [PMC free article] [PubMed] [Google Scholar]
- 6.Rowe CC, Ng S, Ackermann U, et al. Imaging beta-amyloid burden in aging and dementia. Neurology 2007;68:1718–1725 [DOI] [PubMed] [Google Scholar]
- 7.Storandt M, Mintun MA, Head D, Morris JC. Cognitive decline and brain volume loss as signatures of cerebral amyloid-beta peptide deposition identified with Pittsburgh compound B: cognitive decline associated with Abeta deposition. Arch Neurol 2009;66:1476–1481 [DOI] [PMC free article] [PubMed] [Google Scholar]
- 8.Resnick SM, Sojkova J, Zhou Y, et al. Longitudinal cognitive decline is associated with fibrillar amyloid-beta measured by [11C]PiB. Neurology 2010;74:807–815 [DOI] [PMC free article] [PubMed] [Google Scholar]
- 9.Villemagne VL, Pike KE, Darby D, et al. Abeta deposits in older non-demented individuals with cognitive decline are indicative of preclinical Alzheimer's disease. Neuropsychologia 2008;46:1688–1697 [DOI] [PubMed] [Google Scholar]
- 10.Becker JA, Hedden T, Carmasin J, et al. Amyloid-β associated cortical thinning in clinically normal elderly. Ann Neurol 2010;69:1032–1042 [DOI] [PMC free article] [PubMed] [Google Scholar]
- 11.Morris JC, Roe CM, Grant EA, et al. Pittsburgh compound B imaging and prediction of progression from cognitive normality to symptomatic Alzheimer disease. Arch Neurol 2009;66:1469–1475 [DOI] [PMC free article] [PubMed] [Google Scholar]
- 12.Mathis CA, Kuller LH, Klunk WE, et al. In vivo assessment of amyloid-beta deposition in non-demented very elderly subjects. Ann Neurol (in press 2013) [DOI] [PMC free article] [PubMed]
- 13.DeKosky ST, Williamson JD, Fitzpatrick AL, et al. Ginkgo biloba for prevention of dementia: a randomized controlled trial [see comment]. JAMA 2008;300:2253–2262 [DOI] [PMC free article] [PubMed] [Google Scholar]
- 14.DeKosky ST, Fitzpatrick A, Ives DG, et al. The Ginkgo Evaluation of Memory (GEM) study: design and baseline data of a randomized trial of Ginkgo biloba extract in prevention of dementia. Contemp Clin Trials 2006;27:238–253 [DOI] [PubMed] [Google Scholar]
- 15.Snitz BE, O'Meara ES, Carlson MC, et al. Ginkgo biloba for preventing cognitive decline in older adults: a randomized trial. JAMA 2009;302:2663–2670 [DOI] [PMC free article] [PubMed] [Google Scholar]
- 16.Kuller LH, Ives DG, Fitzpatrick AL, et al. Does Ginkgo biloba reduce the risk of cardiovascular events? Circ Cardiovasc Qual Outcomes 2010;3:41–47 [DOI] [PMC free article] [PubMed] [Google Scholar]
- 17.Becker JT, Boller F, Saxton J, McGonigle-Gibson KL. Normal rates of forgetting of verbal and non-verbal material in Alzheimer's disease. Cortex 1987;23:59–72 [DOI] [PubMed] [Google Scholar]
- 18.Lopez OL, Becker JT, Jagust WJ, et al. Neuropsychological characteristics of mild cognitive impairment subgroups. J Neurol Neurosurg Psychiatry 2006;77:159–165 [DOI] [PMC free article] [PubMed] [Google Scholar]
- 19.Saxton J, Ratcliff G, Munro CA, et al. Normative data on the Boston Naming Test and two equivalent 30-item short forms. Clin Neuropsychol 2000;14:526–534 [DOI] [PubMed] [Google Scholar]
- 20.Radloff LS. The CES-D Scale: a self-report depression scale for research in the general population. Appl Psychol Meas 1977;1:385–401 [Google Scholar]
- 21.Lezak MD, Howieson DB, Loring DW. Neuropsychological Assessment, 4th ed New York: Oxford University Press; 2004 [Google Scholar]
- 22.Hughes CP, Berg L, Danziger WL, Coben LA, Martin RL. A new clinical scale for the staging of dementia. Br J Psychiatry 1982;140:566–572 [DOI] [PubMed] [Google Scholar]
- 23.Rosario BL, Weissfeld LA, Laymon CM, et al. Inter-rater reliability of manual and automated region-of-interest delineation for PiB PET. Neuroimage 2011;55:933–941 [DOI] [PMC free article] [PubMed] [Google Scholar]
- 24.Stern Y. Cognitive reserve and Alzheimer disease. Alzheimer Dis Assoc Disord 2006;20:112–117 [DOI] [PubMed] [Google Scholar]
- 25.Shankar GM, Bloodgood BL, Townsend M, Walsh DM, Selkoe DJ, Sabatini BL. Natural oligomers of the Alzheimer amyloid-beta protein induce reversible synapse loss by modulating an NMDA-type glutamate receptor-dependent signaling pathway. J Neurosci 2007;27:2866–2875 [DOI] [PMC free article] [PubMed] [Google Scholar]
- 26.Hartley DM, Walsh DM, Ye CP, et al. Protofibrillar intermediates of amyloid Î-beta protein induce acute electrophysiological changes and progressive neurotoxicity in cortical neurons. J Neurosci 1999;19:8876–8884 [DOI] [PMC free article] [PubMed] [Google Scholar]
- 27.Cleary JP, Walsh DM, Hofmeister JJ, et al. Natural oligomers of the amyloid-[beta] protein specifically disrupt cognitive function. Nat Neurosci 2005;8:79–84 [DOI] [PubMed] [Google Scholar]
- 28.Hultsch DF, MacDonald SWS, Hunter MA, Levy-Bencheton J, Strauss E. Intraindividual variability in cognitive performance in older adults: comparison of adults with mild dementia, adults with arthritis, and healthy adults. Neuropsychology 2000;14:588–598 [DOI] [PubMed] [Google Scholar]
- 29.Holtzer R, Verghese J, Wang C, Hall CB, Lipton RB. Within-person across-neuropsychological test variability and incident dementia. JAMA 2008;300:823–830 [DOI] [PMC free article] [PubMed] [Google Scholar]
- 30.Ownby RL, Crocco E, Acevedo A, John V, Loewenstein DA. Depression and risk for Alzheimer disease: systematic review, meta-analysis, and metaregression analysis. Arch Gen Psychiatry 2006;63:530–538 [DOI] [PMC free article] [PubMed] [Google Scholar]
- 31.Butters MA, Klunk WE, Mathis CA, et al. Imaging Alzheimer pathology in late-life depression with PET and Pittsburgh Compound-B. Alzheimer Dis Assoc Disord 2008;22:261–268 [DOI] [PMC free article] [PubMed] [Google Scholar]
Associated Data
This section collects any data citations, data availability statements, or supplementary materials included in this article.