

Abstract
Objective:
To investigate whether the topography of dilated perivascular spaces (DPVS) corresponds with markers of particular small-vessel diseases such as cerebral amyloid angiopathy and hypertensive vasculopathy.
Methods:
Patients were recruited from an ongoing single-center prospective longitudinal cohort study of patients evaluated in a memory clinic. All patients underwent structural, high-resolution MRI, and had a clinical assessment performed within 1 year of scan. DPVS were rated in basal ganglia (BG-DPVS) and white matter (WM-DPVS) on T1 sequences, using an established 4-point semiquantitative score. DPVS degree was classified as high (score > 2) or low (score ≤ 2). Independent risk factors for high degree of BG-DPVS and WM-DPVS were investigated.
Results:
Eighty-nine patients were included (mean age 72.7 ± 9.9 years, 57% female). High degree of WM-DPVS was more frequent than low degree in patients with presence of strictly lobar microbleeds (45.5% vs 28.4% of subjects). High BG-DPVS degree was associated with older age, hypertension, and higher white matter hyperintensity volumes. In multivariate analysis, increased lobar microbleed count was an independent predictor of high degree of WM-DPVS (odds ratio [OR] 1.53 [95% confidence interval (CI) 1.06–2.21], p = 0.02). By contrast, hypertension was an independent predictor of high degree of BG-DPVS (OR 9.4 [95% CI 1–85.2], p = 0.04).
Conclusions:
The associations of WM-DPVS with lobar microbleeds and BG-DPVS with hypertension raise the possibility that the distribution of DPVS may indicate the presence of underlying small-vessel diseases such as cerebral amyloid angiopathy and hypertensive vasculopathy in patients with cognitive impairment.
Accumulating evidence strongly suggests that dilated perivascular spaces (DPVS) are markers of small-vessel disease (SVD).1–5 Previous studies have generally distinguished between DPVS in the basal ganglia (BG-DPVS) and in the white matter (WM-DPVS). Compared to WM-DPVS, BG-DVPS are more strongly linked to markers of SVD in patients with stroke.3,4 By contrast, WM-DPVS (and not BG-DPVS) have been independently associated with incident dementia in healthy subjects.6 The mechanisms behind these particular topographic associations are unknown.
Cerebral amyloid angiopathy (CAA) is a common form of SVD in the elderly that results from β-amyloid deposition within small arteries.7 CAA independently contributes to cognitive impairment in a portion of stroke-free elderly8 and may be common in patients evaluated in memory clinics.9,10 In contrast to hypertensive vasculopathy (HV), which predominantly affects deep perforating arteries, CAA predominantly affects cortical and leptomeningeal arteries.11 The presence of strictly lobar cerebral microbleeds (MB) may be indicative of CAA even in healthy elderly individuals.12
We hypothesized that in patients with CAA, β-amyloid accumulation within perivascular spaces13 might favor the dilation of these spaces in selective regions of the brain. We thus sought to determine 1) whether patients with strictly lobar MB would harbor a high burden of WM-DPVS compared to BG-DPVS and 2) whether patients with MRI markers of HV would have a higher burden of BG-DPVS compared to WM-DPVS. We aimed to examine these questions in a cohort of patients from an ongoing prospective study in a memory clinic setting.
METHODS
Patient recruitment.
Subjects were evaluated as part of an ongoing longitudinal study at the Massachusetts Alzheimer's Disease Research Center (ADRC) between 2007 and 2010. This is one of the 28 federally funded ADRCs across the United States that contributes to the National Alzheimer's Coordinating Center–based uniform dataset, which has been previously described in detail.14 Briefly, it is a prospective longitudinal cohort that has enrolled cognitively intact subjects, subjects with mild cognitive impairment (MCI), and subjects with dementia since 2005. All enrolled subjects signed a written informed consent. For this study, we included those cognitively impaired (Clinical Dementia Rating [CDR] ≥0.5) individuals having a complete structural, high-resolution 3 T MRI study of the brain, and a clinical evaluation performed within 1 year of scan. We excluded patients with nonlacunar ischemic stroke or intracerebral hemorrhage (ICH) because of the potential impact of these lesions on both the cognitive status and DPVS assessment. The following clinical variables were recorded for each subject: age, sex, presence of hypertension, diabetes, and hypercholesterolemia, and global CDR score. Hypertension was defined as previous diagnosis of hypertension (>140/90 mm Hg) or use of antihypertensive treatment for control of blood pressure. Diabetes was defined as previous diagnosis of diabetes or current use of antidiabetic drugs. Hypercholesterolemia was defined as previous diagnosis of hypercholesterolemia or current use of antihyperlipidemic medications.
Standard protocol approvals, registrations, and patient consents.
This study was performed with approval and in accordance with the guidelines of the institutional review boards of Massachusetts General Hospital.
Neuroimaging acquisition and analysis.
All scans were obtained from 3 T MRI equipment (Siemens Trio, Munich, Germany). The neuroimaging protocol included the following sequences: magnetization-prepared rapid gradient echo (MPRAGE) T1 (slice thickness 1 mm, interslice gap 0 mm, in-plane resolution 1 × 1 × 1, repetition time [TR] 2,530 ms, echo time [TE] 1.61/3.39/5.17/6.95 ms, 4 echoes, flip angle 7°, acquisition matrix 256 × 256, field of view [FOV] 256 × 256); T2-weighted (slice thickness 5 mm, interslice gap 1 mm, in-plane resolution 1 × 1 × 1, TR 4,940 ms, TE 103 ms, flip angle 90°, acquisition matrix 256 × 256, FOV 220 × 220) 3D fluid-attenuated inversion recovery (FLAIR) (slice thickness 1 mm, interslice gap 0 mm, in-plane resolution 1 × 1 × 1, TR 6,000 ms, TE 303 ms, flip angle 120°, acquisition matrix 256 × 226, FOV 256 × 256); and susceptibility-weighted imaging (SWI) (slice thickness 1.2 mm, interslice gap 0 mm, in-plane resolution 0.5 × 0.5 × 0.5, TR 27 ms, TE 21 ms, flip angle 15°, acquisition matrix 448 × 299, FOV 224 × 150 mm).
Neuroimaging analyses were performed to determine presence, number, and topography of cerebral MB, degree of DPVS in BG and WM, white matter hyperintensity (WMH) volumes, presence and number of lacunar infarcts, and brain parenchymal fraction (BPF).
Cerebral MB were rated on SWI axial sequences as previously described.15, 16 Briefly, MB were defined as focal round or ovoid areas of marked signal loss, different from vascular flow voids, calcifications, cavernous malformations, and basal ganglia mineralization. Presence/absence, number, and topography of MB (lobar vs nonlobar) were documented. Lobar topography referred to cortico-subcortical regions of brain and cerebellum lobes, whereas nonlobar topography included deep cerebral white matter, thalamus, basal ganglia, and brainstem. Individuals with MB were subclassified according to the topographic pattern: strictly lobar, strictly nonlobar, and mixed (presence of both lobar and nonlobar MB).
DPVS were identified on MPRAGE T1 sequences, and defined as round, ovoid, or linear structures with CSF-like signal, no larger than 2 mm in diameter, and located in territories supplied by perforating arteries.17 Lacunes were defined using largely the same imaging criteria, with the exception that they be round and >2 mm in diameter on T1 sequences. Size, however, was not an absolute criterion to distinguish between DPVS and lacunes, as no consensus (2 vs 3 mm) exists across previous studies.3,18 For those lesions measuring between 2 and 3 mm, we further assessed their spatial disposition by reviewing projections on each axis simultaneously; whenever shape resembled the trajectory of a vessel, lesions were considered as DPVS. We also reviewed T2-weighted images to ensure that those structures identified as either DPVS or lacunes on T1 had CSF-like signal. DPVS in both WM and BG regions were rated according to a previously published 4-point semiquantitative score.5 This score is relatively simple and it has proven to be useful in terms of identifying previously known associations between high burden of DPVS and clinical-radiologic variables.3,4 Also, it requires the evaluation of DPVS in the whole WM, which is more adequate for our study than the evaluation of centrum semiovale alone, as proposed in other semiquantitative scales.3 For BG, the degrees of DPVS were defined as follows: degree 1 when there were <5 DPVS; degree 2 when there were between 5 and 10 DPVS; degree 3 when there were 10 DPVS but still numerable; and degree 4 when an innumerable number of DPVS resulted in a cribiform change in BG. In WM, DPVS were scored degree 1 when there were <10 DPVS in the total WM; degree 2 when there were >10 DPVS in the total WM and less than 10 in the slice containing the greatest number of DPVS; degree 3 when there were between 10 and 20 DPVS in the slice containing the greatest number of DPVS; and degree 4 when there were >20 DPVS in the slice containing the greatest number of DPVS. Finally, we dichotomized degrees of DPVS into high (score >2) and low (score ≤2). This cutoff, though arbitrary, was chosen to evenly distribute DPVS severity into 2 subgroups. The figure shows examples of high degree of BG-DPVS and WM-DPVS, as well as the visual appearance of a lacune (to illustrate the distinction from DPVS).
Figure. Axial T1 MRI scans.
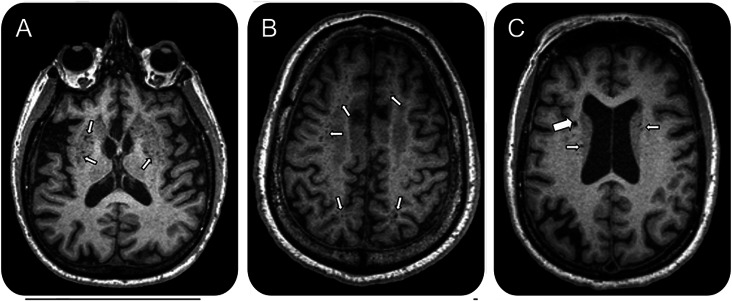
(A) High degree of dilated perivascular spaces in the basal ganglia. (B) High degree of dilated perivascular spaces in the white matter. (C) Radiologic appearance of a lacune (large arrow) as opposed to dilated perivascular spaces (small arrows).
WMH volumes were calculated on FLAIR axial sequences using a previously described semi-automated segmentation method.19 The total volume of WMH was normalized to the intracranial compartment (ICC) in each patient (normalized volume of WMH or nWMH = [volume of WMH/volume ICC] × 100)20 and logarithmically transformed due to its non-normal distribution.
DPVS, lacunar infarcts, MB, and WMH were rated by a single trained neurologist (S.M.-R.) blinded to clinical data. DPVS assessment was performed several months after the assessment of the other SVD markers, ensuring a blind evaluation. MRIcron and Analyze software were used for image display (including 3D reconstruction) and labeling of vascular lesions. We have previously reported a high inter-rater concordance within our group for MB,21 WMH,19 and lacunar infarcts.20 Regarding DPVS, 15 scans randomly chosen were handed to a second rater (E.A.) for evaluation, and intraclass correlation coefficients were calculated. Intraclass correlation coefficient for distinction between high and low degree of DPVS was moderate for BG (0.65) and strong for WM (0.73).
To quantify BPF, T1-weighted images were first registered to an atlas brain (Montreal Neurological Institute 152) using FSL's FLIRT. The coregistered images were then resampled to 1 mm isotropic resolution and then run through SIENAX (http://www.fmrib.ox.ac.uk/fsl/siena/index.html) processing stream. Images were skull-stripped and then segmented into different tissue types (gray matter [GM], WM, CSF, and other) and the segmentation was then used to calculate BPF as (GM + WM)/(GM + WM + CSF).
Statistics.
We performed appropriate univariate tests to compare clinical and radiologic data between patients with high and low degrees of DPVS, both for WM and BG regions. The χ2 test and Fisher exact test were applied to nominal variables, Student t test for normally distributed continuous variables, and Wilcoxon rank sum test for non-normally distributed continuous variables. nWMH volumes were analyzed after logarithmic transformation to achieve a more normal distribution. We subsequently entered variables reaching a p value <0.05 as well as other variables considered to be pathophysiologically relevant into logistic regression models to identify independent predictors of high BG-DPVS and WM-DPVS degree. Logistic regression models were run using a stepwise, backwards method. Significance level was set at 0.05 for all analyses. We used the JMP Pro 9 statistical package (SAS Institute, Cary, NC).
RESULTS
Of 256 cognitively impaired patients having both a neuroimaging study and clinical evaluation within 1 year, 93 patients had a 3 T MRI study. Four patients were subsequently excluded due to the presence of either a large ischemic infarct or an ICH, leaving a total of 89 patients suitable for inclusion.
Mean age of the entire cohort was 72.7 ± 9.7 years, and 57% of subjects were female. Degree 2 was the most frequent DPVS degree in the cohort, accounting for 55% of cases in both WM and BG. Twenty-two (24.7%) individuals had high degree of WM-DPVS, and 9 (10.1%) had high degree of BG-DPVS. Eight (8.9%) patients had low degree of DPVS both in WM and BG. No patients had concomitant high degree of DPVS in both regions.
Fifty-two (58.4%) patients had cognitive impairment without dementia (CDR = 0.5) and 37 (41.6%) had dementia (CDR ≥ 1), with Alzheimer disease (AD) accounting for 70% of the diagnoses in these cases. MB were present in 34 (38.2%) patients, being strictly lobar in all but 5 cases. Mean nWMH volume was 1.15 ± 0.12 mL. nWMH volumes were not associated with lobar MB count or BPF (data not shown).
Forty-nine percent of subjects had a diagnosis of hypertension. Hypertensive patients tended to be older than nonhypertensive patients (74.6 vs 70.9 years, p = 0.07) and had significantly higher nWMH volumes (p = 0.01). Hypertensive patients were more likely to have lacunes (p = 0.03) and high degree of BG-DPVS (p = 0.01). Hypertension was not associated with high degree of WM-DPVS or the presence or number of strictly lobar MB (data not shown).
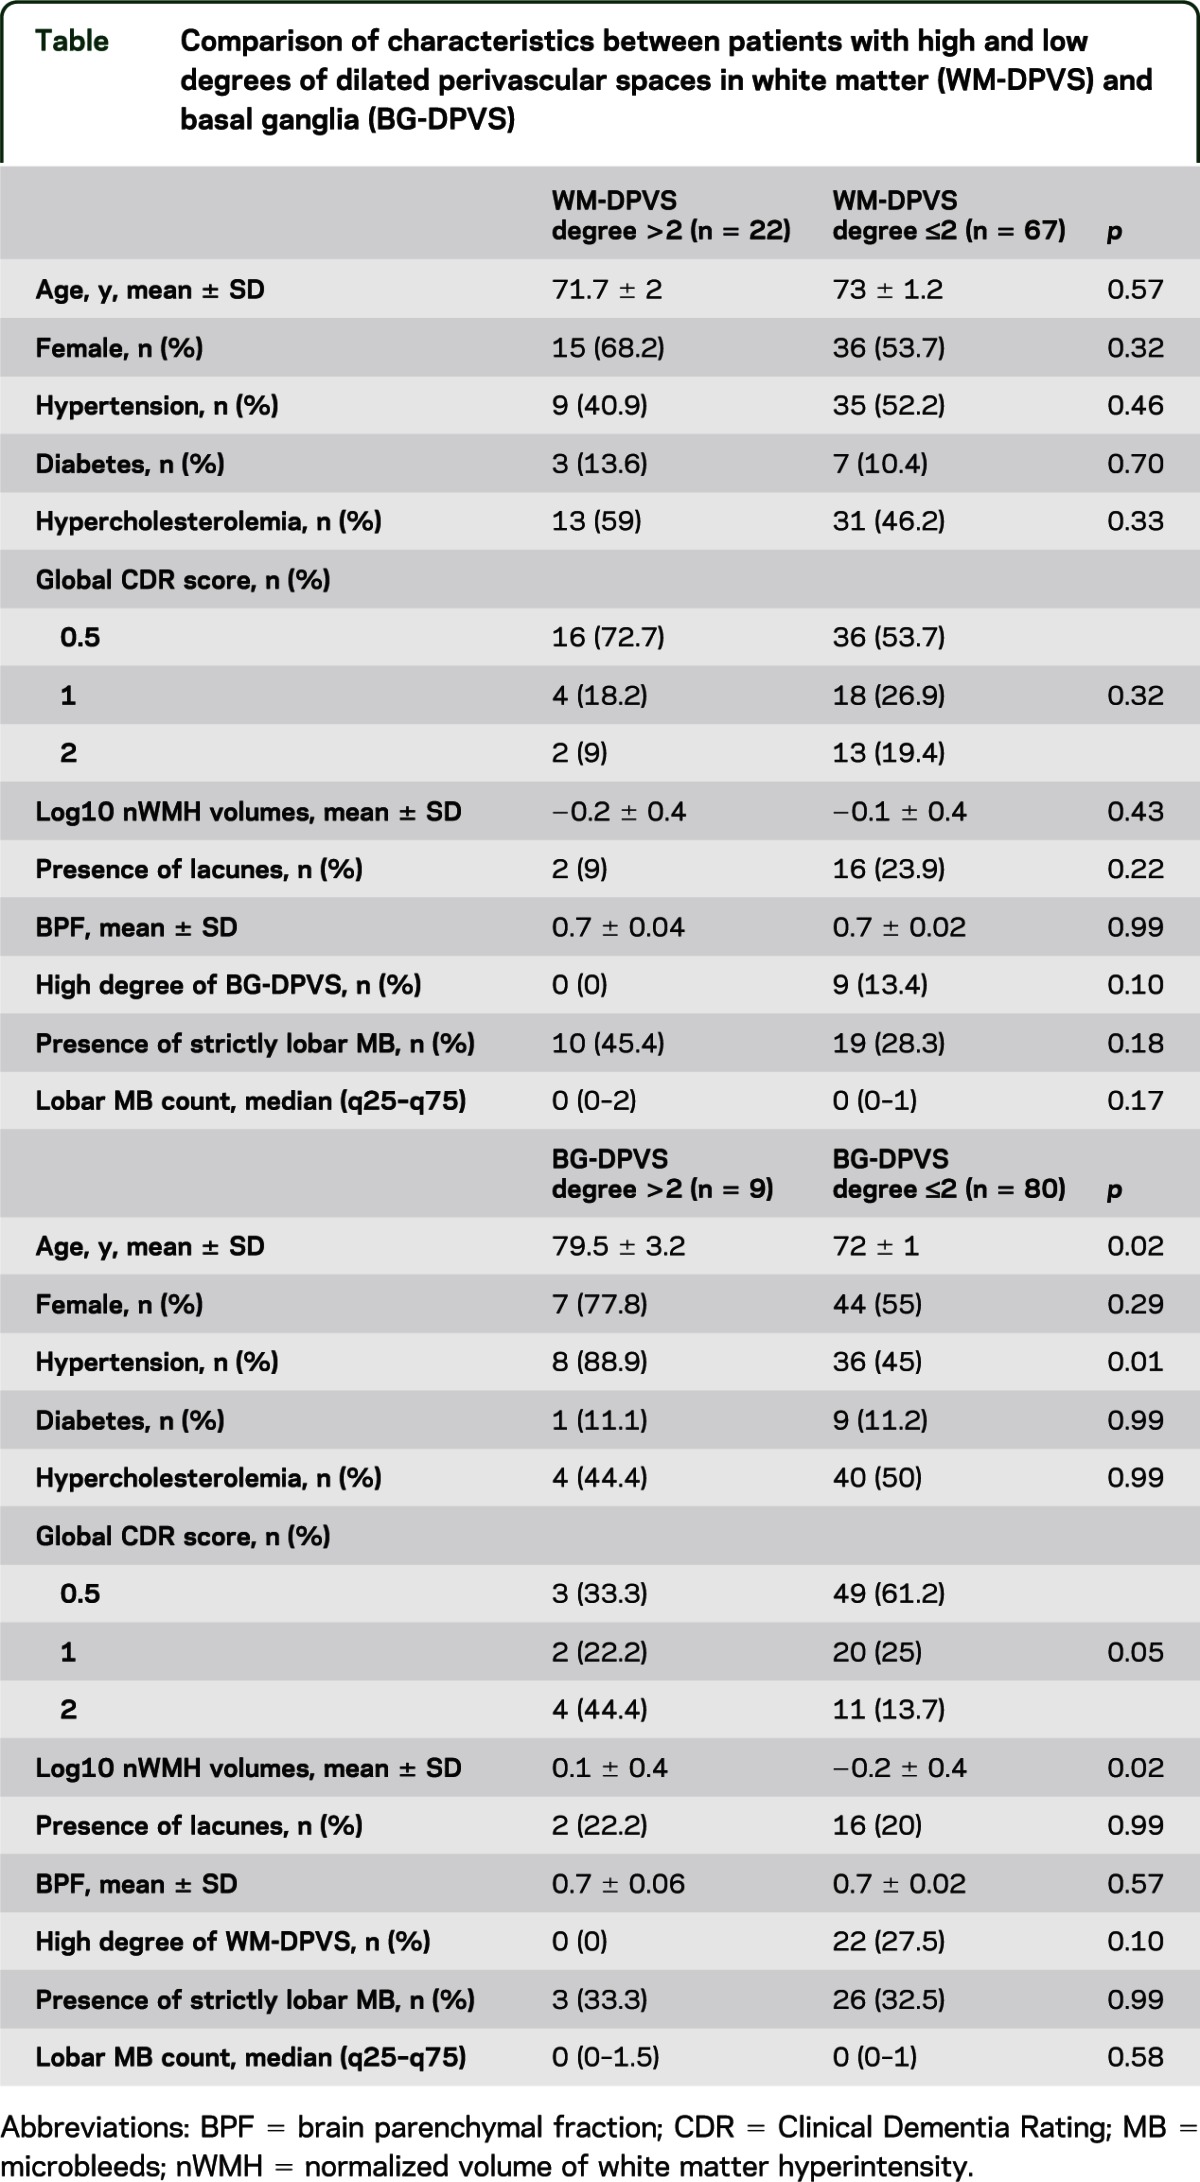
Comparison of characteristics between patients with high and low DPVS degree is shown in the table. High degree of WM-DPVS was considerably more frequent in patients with strictly lobar MB (45.5% vs 28.4%, p = 0.18). High degree of BG-DPVS was significantly associated with older age, presence of hypertension, and higher nWMH volumes. There was a borderline association between high degree of BG-DPVS and higher global CDR score.
Table.
Comparison of characteristics between patients with high and low degrees of dilated perivascular spaces in white matter (WM-DPVS) and basal ganglia (BG-DPVS)
In multivariate models to determine predictors of high degree of DPVS in WM and BG, higher lobar MB count was found to be independently associated with high degree of WM-DPVS (odds ratio [OR] 1.53 [95% confidence interval (CI) 1.06–2.21], p = 0.02) after adjusting for age and sex. In the subgroup of patients with strictly lobar MB, increased MB count showed a trend toward association with high degree of WM-DPVS (OR 1.78 [95% CI 0.97–3.27], p = 0.06) after adjusting for the same variables. In multivariate analyses adjusting for age, sex, and nWMH, hypertension was independently associated with high degree of BG-DPVS (OR 9.38 [95% CI 1.03–85.17], p = 0.04).
DISCUSSION
The main findings from this cohort study on patients from a memory clinic are that high degree of WM-DPVS is associated with number of lobar MB, while high degree of BG-DPVS is associated with the presence of hypertension. Based on evidence that strictly lobar MB may be indicative of CAA even in elderly individuals without ICH,7 our results suggest that high degree of WM-DPVS may be an additional marker associated with cerebrovascular amyloid deposition. However, further pathologic correlation studies are required to more definitely confirm this hypothesis. By contrast, high degree of BG-DPVS may be associated with vascular risk factors and markers of HV.
Previous studies have shown that high burden of DPVS has differential associations depending on its topography. In stroke patients, hypertension and typical neuroimaging features of HV (WMH, lacunes) have been more consistently linked to BG-DPVS compared to WM-DPVS.3,4 Also, one study found that high degree of BG-DPVS may be more specific for the diagnosis of vascular dementia compared to AD and other neurodegenerative diseases.22 Our results concerning the relationship between BG-DPVS and vascular risk factors and MRI markers of HV are in line with these previous studies. Interestingly, a large population-based study identified these associations for both WM and BG regions, though associations were generally stronger for BG-DPVS.5 Although HV preferentially affects the deep arteries of the brain, pathology may occur in both superficial and deep areas.23 Thus, the finding of an association between hypertension and high burden of WM-DPVS in a large population-based cohort is not unexpected. The lack of this association in our study may be related to limited sample size. Unfortunately, the potential relative contribution of hypertension and CAA on PVS dilation in white matter in this population-based cohort is unclear as MB data were not available.
Although the diagnostic value of lobar MB in the absence of hemorrhagic stroke remains to be established in detailed clinicopathologic studies, lobar MB in the absence of ICH may be predictive of CAA. In healthy subjects, lobar MB correlate with the presence of the APOE ε4 allele and predominantly tend to affect the posterior lobes,12,24 strongly resembling the profile seen in patients with probable CAA.7 In patients with AD, lobar MB may be even more suggestive of the presence of CAA, as more than 80% of patients with AD have some degree of CAA at pathologic examination.25 As our cohort was largely comprised of patients with MCI and established AD-related dementia, the pattern of lobar MB seen in these patients may be suggestive of underlying CAA.
The potential link between CAA and WM-DPVS (and not BG-DPVS) is supported by several prior observations. First, it is known that CAA has a superficial distribution, topographically distant from perforating arteries irrigating BG.26 Secondly, pathologic studies have reported a relative increase in interstitial fluid (ISF) in the WM of AD brains,2 and that the severity of PVS dilation in WM correlates with the severity of cortical CAA and the presence of the APOE ε4 allele.13 These findings suggested the hypothesis that in patients with CAA, parenchymal β-amyloid could reach the vessel walls through perivascular spaces, eventually aggregating within them and causing retrograde PVS dilation due to ISF blockage. There is evidence from animal models that passage through arterial PVS is a clearance mechanism for several soluble tracers injected into the brain.27 β-amyloid is likely to use this pathway, as vascular amyloid distribution in CAA highly resembles arterial perivascular routes.28 This hypothesis has not been previously investigated using MRI markers of DPVS and CAA.
Our results may be consistent with this hypothesis as we found that there was a trend in individuals with strictly lobar MB to have a high burden of WM-DPVS. This higher burden of WM-DPVS in individuals with strictly lobar MB did not reach statistical significance but may be limited by sample size and the specificity of strictly lobar MB for CAA in the absence of ICH. Furthermore, the observation that lobar MB count is positively associated with a high burden of WM-DPVS may imply that dilation of PVS in CAA is influenced by the burden of vascular amyloid pathology. It should be emphasized that the associations observed for WM-DPVS were not seen for BG-DPVS, and vice versa. Also, and in contrast to previous studies in different populations,3,5 high burden of WM-DPVS and BG-DPVS were not mutually associated in our study. This reinforces the concept that different pathophysiologic processes may be at play in WM-DPVS compared to BG-DPVS, at least in patients with cognitive decline. To better address these questions, it will be important to investigate the relationship between DPVS and other neuroimaging markers of CAA7,29 in future studies.
The main strengths of this study are the testing of a prespecified hypothesis and the use of multimodal high-resolution structural MRI, which allowed precise assessment of DPVS and other associated markers of SVD. The main limitations are its retrospective design and limited cohort size, which may have introduced a potential risk of bias in our results. This bias may be minimal regarding the findings of a strong association between BG-DPVS and SVD as they are consistent with previous, larger studies.3,4 Furthermore, issues of small sample size would likely lead to bias toward the null hypothesis. However, we also acknowledge that the characteristics of our study cohort (particularly the advanced age and potentially high prevalence of CAA in this population) may represent a potential bias toward the observed associations on WM-DPVS. Additionally, although the semiquantitative scale used to assess DPVS has considerable reliability, it lacks detailed topographic precision, as CAA may not affect the brain homogeneously.30 However, the distinction between DPVS in the WM vs the BG regions may have been sensitive enough to capture the topographic differences in DPVS between different SVD pathologies. Finally, the cross-sectional nature of the current study did not allow us to draw any conclusions regarding potential causality of the reported associations.
This study shows that the topography of DPVS may be associated with specific SVD pathologies. Patients with MRI markers suggestive of CAA appear to have increased burden of WM-DPVS compared to patients with markers of HV. Whether WM-DPVS is an early marker of CAA that develops prior to hemorrhagic complications or cognitive impairment should be further investigated in larger, prospective studies.
GLOSSARY
- ADRC
Alzheimer's Disease Research Center
- BG-DPVS
dilated perivascular spaces in the basal ganglia
- BPF
brain parenchymal fraction
- CAA
cerebral amyloid angiopathy
- CDR
Clinical Dementia Rating
- CI
confidence interval
- DPVS
dilated perivascular spaces
- FLAIR
fluid-attenuated inversion recovery
- FOV
field of view
- GM
gray matter
- HV
hypertensive vasculopathy
- ICC
intracranial compartment
- ICH
intracerebral hemorrhage
- ISF
interstitial fluid
- MB
microbleeds
- MCI
mild cognitive impairment
- MPRAGE
magnetization-prepared rapid gradient echo
- nWMH
normalized volume of white matter hyperintensity
- OR
odds ratio
- SVD
small-vessel diseases
- SWI
susceptibility-weighted imaging
- TE
echo time
- TR
repetition time
- WM
white matter
- WM-DPVS
dilated perivascular spaces in the white matter
- WMH
white matter hyperintensity
AUTHOR CONTRIBUTIONS
Study design: S.M.-R., A.V. Data acquisition: S.M.-R., A.P.D., A.H., M.Q., M.E.G. Data analysis: S.M.-R., O.M.P.-N., E.A., M.E.G., A.V. Study management: S.M.-R., S.M.G., A.V. Manuscript preparation: S.M.-R., O.M.P.-N., A.V. Manuscript review: S.M.-R., O.M.P.-N., E.A., M.E.G., S.M.G., A.V.
STUDY FUNDING
Supported by grant 5P50AG005134-28 from the National Institute on Aging. Dr. Martinez-Ramirez is a recipient of the research grant “Becas de Investigacion en Universidades y Centros del Extranjero” from Fundacion Alfonso Martin Escudero, Madrid (Spain). Funding entities had no involvement in study design, data collection, analysis and interpretation, writing of the manuscript, or the decision to submit for publication.
DISCLOSURE
The authors report no disclosures relevant to the manuscript. Go to Neurology.org for full disclosures.
REFERENCES
- 1.Heier LA, Bauer CJ, Schwartz L, Zimmerman RD, Morgello S, Deck MD. Large Virchow-Robin spaces: MR-clinical correlation. AJNR Am J Neuroradiol 1989;10:929–936 [PMC free article] [PubMed] [Google Scholar]
- 2.van Swieten JC, van den Hout JH, van Ketel BA, Hijdra A, Wokke JH, van Gijn J. Periventricular lesions in the white matter on magnetic resonance imaging in the elderly: a morphometric correlation with arteriolosclerosis and dilated perivascular spaces. Brain 1991;114:761–774 [DOI] [PubMed] [Google Scholar]
- 3.Doubal FN, MacLullich AM, Ferguson KJ, Dennis MS, Wardlaw JM. Enlarged perivascular spaces on MRI are a feature of cerebral small vessel disease. Stroke 2010;41:450–454 [DOI] [PubMed] [Google Scholar]
- 4.Rouhl RP, van Oostenbrugge RJ, Knottnerus IL, Staals JE, Lodder J. Virchow-Robin spaces relate to cerebral small vessel disease severity. J Neurol 2008;255:692–696 [DOI] [PubMed] [Google Scholar]
- 5.Zhu YC, Tzourio C, Soumare A, Mazoyer B, Dufouil C, Chabriat H. Severity of dilated Virchow-Robin spaces is associated with age, blood pressure, and MRI markers of small vessel disease: a population-based study. Stroke 2010;41:2483–2490 [DOI] [PubMed] [Google Scholar]
- 6.Zhu YC, Dufouil C, Soumare A, Mazoyer B, Chabriat H, Tzourio C. High degree of dilated Virchow-Robin spaces on MRI is associated with increased risk of dementia. J Alzheimers Dis 2010;22:663–672 [DOI] [PubMed] [Google Scholar]
- 7.Viswanathan A, Greenberg SM. Cerebral amyloid angiopathy in the elderly. Ann Neurol 2011;70:871–880 [DOI] [PMC free article] [PubMed] [Google Scholar]
- 8.Arvanitakis Z, Leurgans SE, Wang Z, Wilson RS, Bennett DA, Schneider JA. Cerebral amyloid angiopathy pathology and cognitive domains in older persons. Ann Neurol 2011;69:320–327 [DOI] [PMC free article] [PubMed] [Google Scholar]
- 9.Pettersen JA, Sathiyamoorthy G, Gao FQ, et al. Microbleed topography, leukoaraiosis, and cognition in probable Alzheimer disease from the Sunnybrook dementia study. Arch Neurol 2008;65:790–795 [DOI] [PubMed] [Google Scholar]
- 10.Cordonnier C, van der Flier WM. Brain microbleeds and Alzheimer's disease: innocent observation or key player? Brain 2011;134:335–344 [DOI] [PubMed] [Google Scholar]
- 11.Biffi A, Greenberg SM. Cerebral amyloid angiopathy: a systematic review. J Clin Neurol 2011;7:1–9 [DOI] [PMC free article] [PubMed] [Google Scholar]
- 12.Vernooij MW, van der Lugt A, Ikram MA, et al. Prevalence and risk factors of cerebral microbleeds: the Rotterdam Scan Study. Neurology 2008;70:1208–1214 [DOI] [PubMed] [Google Scholar]
- 13.Roher AE, Kuo YM, Esh C, et al. Cortical and leptomeningeal cerebrovascular amyloid and white matter pathology in Alzheimer's disease. Mol Med 2003;9:112–122 [PMC free article] [PubMed] [Google Scholar]
- 14.Morris JC, Weintraub S, Chui HC, et al. The Uniform Data Set (UDS): clinical and cognitive variables and descriptive data from Alzheimer Disease Centers. Alzheimer Dis Assoc Disord 2006;20:210–216 [DOI] [PubMed] [Google Scholar]
- 15.Nandigam RN, Viswanathan A, Delgado P, et al. MR imaging detection of cerebral microbleeds: effect of susceptibility-weighted imaging, section thickness, and field strength. AJNR Am J Neuroradiol 2009;30:338–343 [DOI] [PMC free article] [PubMed] [Google Scholar]
- 16.Greenberg SM, Vernooij MW, Cordonnier C, et al. Cerebral microbleeds: a guide to detection and interpretation. Lancet Neurol 2009;8:165–174 [DOI] [PMC free article] [PubMed] [Google Scholar]
- 17.Bokura H, Kobayashi S, Yamaguchi S. Distinguishing silent lacunar infarction from enlarged Virchow-Robin spaces: a magnetic resonance imaging and pathological study. J Neurol 1998;245:116–122 [DOI] [PubMed] [Google Scholar]
- 18.Herve D, Godin O, Dufouil C, et al. Three-dimensional MRI analysis of individual volume of Lacunes in CADASIL. Stroke 2009;40:124–128 [DOI] [PMC free article] [PubMed] [Google Scholar]
- 19.Gurol ME, Irizarry MC, Smith EE, et al. Plasma beta-amyloid and white matter lesions in AD, MCI, and cerebral amyloid angiopathy. Neurology 2006;66:23–29 [DOI] [PubMed] [Google Scholar]
- 20.Viswanathan A, Guichard JP, Gschwendtner A, et al. Blood pressure and haemoglobin A1c are associated with microhaemorrhage in CADASIL: a two-centre cohort study. Brain 2006;129:2375–2383 [DOI] [PubMed] [Google Scholar]
- 21.Greenberg SM, O'Donnell HC, Schaefer PW, Kraft E. MRI detection of new hemorrhages: potential marker of progression in cerebral amyloid angiopathy. Neurology 1999;53:1135–1138 [DOI] [PubMed] [Google Scholar]
- 22.Patankar TF, Mitra D, Varma A, Snowden J, Neary D, Jackson A. Dilatation of the Virchow-Robin space is a sensitive indicator of cerebral microvascular disease: study in elderly patients with dementia. AJNR Am J Neuroradiol 2005;26:1512–1520 [PMC free article] [PubMed] [Google Scholar]
- 23.Fisher CM. Pathological observations in hypertensive cerebral hemorrhage. J Neuropathol Exp Neurol 1971;30:536–550 [DOI] [PubMed] [Google Scholar]
- 24.Mesker DJ, Poels MM, Ikram MA, et al. Lobar distribution of cerebral microbleeds: the Rotterdam Scan Study. Arch Neurol 2011;68:656–659 [DOI] [PubMed] [Google Scholar]
- 25.Jellinger KA. Alzheimer disease and cerebrovascular pathology: an update. J Neural Transm 2002;109:813–836 [DOI] [PubMed] [Google Scholar]
- 26.Ellis RJ, Olichney JM, Thal LJ, et al. Cerebral amyloid angiopathy in the brains of patients with Alzheimer's disease: the CERAD experience, Part XV. Neurology 1996;46:1592–1596 [DOI] [PubMed] [Google Scholar]
- 27.Carare RO, Bernardes-Silva M, Newman TA, et al. Solutes, but not cells, drain from the brain parenchyma along basement membranes of capillaries and arteries: significance for cerebral amyloid angiopathy and neuroimmunology. Neuropathol Appl Neurobiol 2008;34:131–144 [DOI] [PubMed] [Google Scholar]
- 28.Weller RO, Massey A, Newman TA, Hutchings M, Kuo YM, Roher AE. Cerebral amyloid angiopathy: amyloid beta accumulates in putative interstitial fluid drainage pathways in Alzheimer's disease. Am J Pathol 1998;153:725–733 [DOI] [PMC free article] [PubMed] [Google Scholar]
- 29.Johnson KA, Gregas M, Becker JA, et al. Imaging of amyloid burden and distribution in cerebral amyloid angiopathy. Ann Neurol 2007;62:229–234 [DOI] [PubMed] [Google Scholar]
- 30.Zhu YC, Chabriat H, Godin O, et al. Distribution of white matter hyperintensity in cerebral hemorrhage and healthy aging. J Neurol 2012;259:530–536 [DOI] [PMC free article] [PubMed] [Google Scholar]