

Abstract
Neighborhood-level analyses of influenza vaccination can identify the characteristics of vulnerable neighborhoods, which can inform public health strategy for future pandemics. In this study, the authors analyzed rates of 2009 pandemic A/H1N1 influenza vaccination in Montreal, Quebec, Canada, using individual-level vaccination records from a vaccination registry with census, survey, and administrative data to estimate the population at risk. The neighborhood socioeconomic and demographic determinants of vaccination were identified using Bayesian ecologic logistic regression, with random effects to account for spatial autocorrelation. A total of 918,773 (49.9%) Montreal residents were vaccinated against pandemic A/H1N1 influenza from October 22, 2009, through April 8, 2010. Coverage was greatest among females, children under age 5 years, and health-care workers. Neighborhood vaccine coverage ranged from 33.6% to 71.0%. Neighborhoods with high percentages of immigrants (per 5% increase, odds ratio = 0.90, 95% credible interval: 0.86, 0.95) and material deprivation (per 1-unit increase in deprivation score, odds ratio = 0.93, 95% credible interval: 0.88, 0.98) had lower vaccine coverage. Half of the Montreal population was vaccinated; however, considerable heterogeneity in coverage was observed between neighborhoods and subgroups. In future vaccination campaigns, neighborhoods that are materially deprived or have high percentages of immigrants may benefit from focused interventions.
Keywords: immunization; influenza, human; pandemics
On April 23, 2009, Mexican public health officials reported the first case of 2009 A/H1N1 influenza virus (1). The same day, 7 cases were reported in the United States, and 3 days later, the first case in Canada was announced (1). During the following months, the virus spread throughout the world. On June 11, 2009, with a total of 30,000 confirmed cases reported in 74 countries, the World Health Organization declared the beginning of the first influenza pandemic of the 21st century (2).
The first case of 2009 A/H1N1 influenza virus in Quebec, Canada, was confirmed on April 30, 2009, in Montreal (3). From August 30, 2009, to October 7, 2010, the number of laboratory-confirmed cases in Quebec totaled 10,889, with 2,492 hospitalized cases and 83 deaths (4). Among these, 14% of hospitalized cases and 14% of deaths occurred in Montreal (4). To prevent infection and protect susceptible populations from severe disease, Quebec health authorities launched a mass pandemic influenza vaccination campaign on October 26, 2009.
A number of studies have examined the determinants of pandemic influenza vaccination in the general population (5–13), but only 2 used a vaccination registry (5, 10). The remainder used surveys (6–9, 11–13), which can be susceptible to selection bias and various biases associated with self-reporting, such as social desirability bias. As a result, surveys tend to overestimate coverage in comparison with registries or other methods that collect vaccination data at the point of care (5, 12, 14, 15).
Using registries to assess vaccine coverage requires a method for estimating the at-risk population. Published methods have varied in terms of complexity and accuracy (5, 10, 15–19). Estimating precise denominators is important in order to avoid potential bias in coverage estimates (5). Standard denominator estimation methods that are reliable, are valid, and can be rapidly applied are needed.
Few studies examining the determinants of pandemic influenza vaccination have reported regional coverage estimates (5, 6). Geographic variation was noted in these studies but was not investigated further. Understanding the reasons for this heterogeneity may help to elucidate the barriers and determinants of pandemic influenza vaccination. Furthermore, understanding local determinants of vaccination is beneficial from a public health perspective, because health services are delivered locally.
The objectives of this study were: 1) to estimate by Montreal neighborhood the population of priority groups for which pandemic A/H1N1 influenza vaccination was recommended; 2) to describe pandemic influenza vaccine coverage in Montreal by sex, age group, priority group, date of vaccination, and neighborhood using a vaccination registry; and 3) to identify the neighborhood socioeconomic and demographic determinants of pandemic influenza vaccination in Montreal in the total population and among priority groups.
MATERIALS AND METHODS
Setting
Montreal is the most populated city in the Canadian province of Quebec and is its economic capital, with a population of 1,854,442, representing 25% of the provincial population in 2006 (20). The Public Health Department of the Health and Social Services Agency of Montreal divided the Island of Montreal into 111 neighborhoods by aggregating the 522 census tracts, which are small statistical areas with 2,500–8,000 persons (21), in a way that attempted to maintain within-neighborhood homogeneity with respect to sociodemographic factors (22).
The pandemic influenza vaccination campaign in Montreal began on October 26, 2009, during the peak of the second wave. The vaccines were administered free of charge in priority sequence (see Web Table 1 (http://aje.oxfordjournals.org/)) at 19 mass vaccination clinics located throughout the island. Following the closure of these clinics on December 18, 2009, people could obtain the vaccine at local community health centers. Throughout the campaign, federal and provincial authorities conducted extensive media campaigns informing the public of the benefits of vaccination.
Study design
We conducted an ecologic study to identify the neighborhood determinants of pandemic influenza vaccination. The study population included all residents of the Island of Montreal aged 6 months or older. This study was approved by the McGill University institutional review board. Use of the vaccination registry data was approved by the Quebec Information Access Commission.
Data sources
Vaccination data
Vaccination data were recorded at the point of care throughout the campaign and subsequently entered into a central registry, which was established in 2009 for the sole purpose of collecting pandemic influenza vaccination data in Quebec. We obtained records of vaccination from the National Public Health Institute of Quebec for all persons vaccinated on the Island of Montreal. For our study, we obtained age group, sex, date of vaccination, census tract of residence, and self-reported priority group status (health-care workers, the chronically ill, pregnant women) for each vaccinated person. We restricted our analysis to residents of the Island of Montreal.
Health-care utilization data
We obtained data on health-care utilization from 2 administrative databases, Régie de l'assurance maladie du Québec (RAMQ) and Maintenance et exploitation des données pour l’étude de la clientele hospitalière (MED-ECHO), to estimate the number of pregnant women. These databases contain information on physician services and hospitalizations, respectively, for all Quebec residents. Previous studies have used these databases to identify pregnant women (23–25). Data on mother's age, census tract of residence, and International Classification of Diseases, Ninth Revision (ICD-9), diagnostic codes were provided for each record.
Census data
We obtained 2006 Census data from Statistics Canada to estimate the distribution of the population by age and sex, the number of health-care workers, and covariates (percentage of immigrants, material and social deprivation).
Survey data
We obtained survey data from the 2007/2008 Canadian Community Health Survey (CCHS) and the 1998/1999 National Population Health Survey (NPHS) to estimate numbers of persons with chronic illnesses. These national, population-based surveys collect data related to the health and sociodemographic characteristics of the Canadian population. We used the Public Use Microdata Files, which contain anonymized individual-level data on sex, age group, the presence of chronic conditions, and geographic region.
Estimation of denominators
Unlike surveys, which capture numerator and denominator data from survey respondents, registries collect only numerator data. We sought to estimate the denominator (in other words, the population of Montreal) by age, sex, and priority group status for the entire city and by neighborhood. Data on priority groups by Montreal neighborhood are not readily available. Consequently, we employed several previously developed data sources and methods to estimate the required denominators.
Population count
We used 2006 Census data as an approximation of the population in 2009. We obtained counts for each age-sex stratum for each census tract on the Island of Montreal.
Pregnant women
We identified pregnant women using health-care utilization data and the ICD-9 codes listed in Web Table 2 (26). These codes were developed for the Canadian Chronic Disease Surveillance System to exclude women with gestational diabetes and pregnancy-induced hypertension when estimating the prevalence and incidence of diabetes in the Canadian population (26, 27). These codes describe pregnancy-related procedures and outcomes.
To determine the number of pregnant women in each neighborhood during the study period, we identified women with at least one ICD-9 code from the set during the 2006 calendar year. Women with multiple codes were considered only once. Previous studies used yearly estimates to determine the number of pregnant women during pandemic or seasonal influenza seasons (10, 28, 29).
Chronic illness
The CCHS and NPHS defined the presence of a chronic condition as a long-term condition that had lasted or was expected to last 6 months or more and that had been diagnosed by a health professional (30, 31). People who reported having asthma, diabetes, heart disease, cancer, effects of stroke, or chronic bronchitis/emphysema were considered to have a chronic illness for which influenza vaccination is recommended. These variables have been described previously (32, 33).
We calculated the proportion of persons with one or more chronic conditions by age group, region, and year (Web Table 3). Estimates were calculated and reported according to Statistics Canada guidelines (34). Proportions for children under 19 years of age were calculated using the NPHS for Quebec, since the CCHS is restricted to persons aged 12 years or older and NPHS estimates for Montreal were too unstable. This method slightly underestimated the proportion of children with a chronic illness in Montreal, but the difference was not statistically significant (Web Table 4).
To estimate the population of persons under age 65 years with a chronic illness, we applied the age-specific proportions to the corresponding age distribution of each neighborhood. We then totaled the stratum-specific numbers. This method of denominator estimation has been described previously (35, 36).
Health-care workers
To estimate the number of health-care workers, we used the 2006 Census variable that described the type of work performed at the person's place of employment (21). A health-care worker was defined as someone who identified his or her industry as “health care and social assistance.” This definition includes health-care workers like physicians and nurses as well as non-health-care workers, such as administrative personnel, and has been used previously (14–17, 37–41).
Covariates
The independent variables included in this study were determined from a literature review on the determinants of pandemic influenza vaccination (42). The socioeconomic and demographic determinants identified previously as significant predictors of pandemic influenza vaccination are: age, sex, priority group status, ethnicity/immigration status, education, occupation, income, and number of children/people living in the household. Rather than include all variables in the analysis, we used indices of material and social deprivation and percentage of immigrants, as these variables encompass the categories mentioned above and avoid potential problems of interpretation due to multicollinearity.
Deprivation indices
Indices of material and social deprivation were constructed by Pampalon and Raymond (43) in Quebec to estimate an individual's socioeconomic status by using the person's neighborhood-level socioeconomic status as a proxy (44). Each index is composed of 3 census variables that are intended to reflect the deprivation of individuals in the area relative to the overall population being studied. “Material deprivation” measures the lack of access to goods and services and includes 3 variables: the proportion of persons lacking a high school diploma, the employment-to-population ratio, and the average income. “Social deprivation” measures the lack of social support and involvement and includes 3 variables: the proportion of persons living alone, the proportion of persons separated, divorced, or widowed, and the proportion of single-parent families. These indices have been used extensively to examine socioeconomic determinants of health in Quebec (45–50).
We obtained the deprivation quintile for each dissemination area, the smallest geographic area for which census data are available, in Montreal (21). Because each neighborhood comprises several dissemination areas, we calculated the neighborhood deprivation score, a continuous variable, by averaging the deprivation quintile values of the dissemination areas contained within the respective neighborhoods, where a value of 1 represents the lowest deprivation level and a value of 5 represents the highest deprivation level.
Immigrants
Using 2006 Census data, we estimated the number of immigrants in each neighborhood by including those who immigrated between 2001 and 2006. We divided the number of immigrants in each neighborhood by the total population of the neighborhood and multiplied by 100 to obtain the percentage of immigrants.
Statistical analysis
Vaccine coverage and 95% confidence intervals were calculated overall and by sex, age group, priority group, and neighborhood. Cumulative coverage was calculated by date of vaccination among priority and age groups. Choropleth maps were constructed for the dependent variables (vaccine coverage overall and by priority group) and independent variables (percentage of immigrants, material and social deprivation). We excluded vaccination records from census tracts where population data were suppressed (due to fewer than 40 persons in the census tract) (51, 52) and records with missing age or sex data.
To identify the neighborhood determinants of pandemic influenza vaccination, we used a Bayesian ecologic logistic regression model accounting for spatially unstructured and structured variation in vaccine coverage (53–55) (Web Appendix 1 and Web Appendix 2). Given the size of our geographic partitions, neighboring areas were defined as areas sharing a border.
We fitted our models using 3 chains, each with different initial values. To improve convergence, we centered all covariates. Convergence was assessed by means of visual inspection of Gelman-Rubin diagnostic plots. Once convergence was achieved, we conducted an additional 20,000 iterations to obtain the posterior distributions. We investigated the influence of the different choices of hyperpriors on our results through sensitivity analyses.
We undertook separate analyses for the total population, pregnant women, chronically ill persons under age 65 years, and health-care workers (Web Appendix 3). The independent variables were percentage of immigrants and material and social deprivation, and the potential confounders were age group, sex, and priority group status as a percentage of the neighborhood population. The determinants of pandemic influenza vaccination were investigated using univariable and multivariable analyses. We retained all covariates in the multivariable model regardless of significance, as all of the variables are relevant from a public health perspective. We calculated univariable and multivariable odds ratios and 95% credible intervals. For 6 (1.4%) neighborhoods with proportions greater than 1, we adjusted the numerator value to equal the denominator value. To investigate the influence of changing the numerator value on our results, we conducted sensitivity analyses in which we changed the denominator to equal the numerator value and excluded the numerator value (i.e., assumed that the neighborhood's value was missing).
Data were analyzed using Stata/SE 9.2 (StataCorp LP, College Station, Texas) and WinBUGS 1.4 (Medical Research Council Biostatistics Unit, Cambridge, United Kingdom). Maps were constructed using ArcMap 9.3 (ESRI Inc., Redlands, California).
RESULTS
A total of 1,015,068 persons aged 6 months or older were vaccinated on the Island of Montreal during the study interval (Figure 1). We excluded 94,923 (9.4%) vaccinations of nonresidents. An additional 1,372 (0.15%) records were excluded because they were for residents of census tracts with suppressed population data (n = 1,339 among 7 census tracts) or were missing age or sex data (n = 33).
Figure 1.
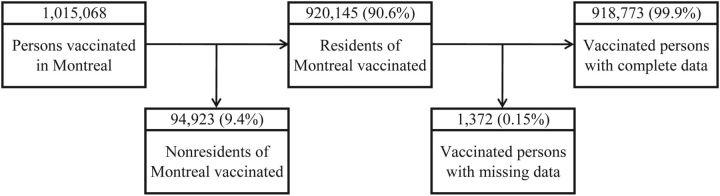
Distribution of vaccinations in Montreal, Quebec, Canada, during the 2009 pandemic A/H1N1 influenza outbreak, and vaccinations among Montreal residents included in the current study, October 2009–April 2010.
In our study population, a total of 918,773 (49.9%) Montreal residents were vaccinated against pandemic influenza during the study period (Table 1). Statistically significant differences in coverage were observed by sex, age group, and priority group. Coverage was highest among females (52.4%), children aged 6 months–4 years (70.0%), and health-care workers (66.8%).
Table 1.
Characteristics of the Population, Overall and by Neighborhood (n = 111), and Pandemic A/H1N1 Influenza Vaccine Coverage, Montreal, Quebec, Canada, October 2009–April 2010
| Overall |
Neighborhood, % of Total Population |
||||||||||
|---|---|---|---|---|---|---|---|---|---|---|---|
| Characteristic | Study Population |
Vaccinated Persons |
Minimum | Quartile 1 | Median | Mean | Quartile 3 | Maximum | |||
| No. | % | No. | %a | 95% CI | |||||||
| Total population | 1,842,897 | 918,773 | 49.9 | 49.8, 50.0 | 1,958 | 10,099 | 15,734 | 16,603 | 20,543 | 62,963 | |
| Sex | |||||||||||
| Female | 956,342 | 51.9 | 501,300 | 52.4 | 52.3, 52.5 | 39.0 | 51.1 | 52.2 | 51.7 | 53.3 | 56.6 |
| Male | 886,555 | 48.1 | 417,473 | 47.1 | 47.0, 47.2 | 43.4 | 46.7 | 47.8 | 48.3 | 48.9 | 61.0 |
| Age group, years | |||||||||||
| 0.5–4 | 84,452 | 4.6 | 59,077 | 70.0 | 69.6, 70.3 | 2.1 | 4.0 | 4.5 | 4.5 | 5.1 | 8.0 |
| 5–19 | 292,950 | 15.9 | 164,333 | 56.1 | 55.9, 56.3 | 6.9 | 13.1 | 16.2 | 16.1 | 18.7 | 24.9 |
| 20–64 | 1,179,125 | 64.0 | 510,447 | 43.3 | 43.2, 43.4 | 48.2 | 59.9 | 62.6 | 63.9 | 66.6 | 81.7 |
| ≥65 | 286,370 | 15.5 | 184,916 | 64.6 | 64.4, 64.7 | 7.1 | 12.0 | 15.1 | 15.4 | 18.3 | 32.3 |
| Priority group | |||||||||||
| Health-care workersb (by sex) | 103,490 | 5.6 | 69,086 | 66.8 | 66.5, 67.0 | 2.3 | 4.9 | 5.7 | 5.6 | 6.5 | 8.4 |
| Female | 77,935 | 75.3 | 48,388 | 62.1 | 61.7, 62.4 | 54.3 | 72.8 | 76.8 | 76.0 | 80.7 | 100.0 |
| Male | 25,555 | 24.7 | 20,698 | 81.0 | 80.5, 81.5 | 0.0 | 19.3 | 23.2 | 24.0 | 27.2 | 45.7 |
| Pregnant womenc (by age, years) | 19,490 | 1.1 | 9,622 | 49.4 | 48.7, 50.1 | 0.5 | 0.9 | 1.0 | 1.1 | 1.2 | 2.5 |
| <20 | 399 | 2.0 | 160 | 40.1 | 35.4, 45.0 | 0.0 | 0.8 | 1.6 | 2.1 | 3.2 | 13.3 |
| 20–44 | 17,095 | 87.7 | 8,985 | 52.6 | 51.8, 53.3 | 68.3 | 84.0 | 87.7 | 86.8 | 90.2 | 95.7 |
| ≥45 | 1,996 | 10.2 | 477 | 23.9 | 22.1, 25.8 | 1.8 | 7.7 | 10.1 | 11.1 | 14.1 | 31.7 |
| Chronically ill aged <65 yearsd (by age, years) | 240,830 | 13.1 | 93,724 | 38.9 | 38.7, 39.1 | 11.3 | 12.7 | 13.1 | 13.1 | 13.6 | 15.1 |
| <20 | 41,475 | 17.2 | 13,697 | 33.0 | 32.6, 33.5 | 7.3 | 14.6 | 17.5 | 17.3 | 20.4 | 25.6 |
| 20–39 | 58,856 | 24.4 | 16,628 | 28.3 | 27.9, 28.6 | 12.7 | 20.1 | 22.7 | 23.8 | 26.4 | 43.3 |
| 40–64 | 140,499 | 58.3 | 63,399 | 45.1 | 44.9, 45.4 | 47.6 | 55.8 | 59.4 | 58.9 | 62.6 | 68.4 |
| Neighborhood characteristic | |||||||||||
| Immigrants | 137,762 | 7.5 | 1.1 | 4.1 | 6.2 | 7.0 | 8.4 | 21.9 | |||
| Material deprivation scoree | 1.0 | 2.1 | 3.2 | 3.0 | 3.9 | 5.0 | |||||
| Social deprivation scoree | 1.1 | 2.9 | 3.6 | 3.5 | 4.1 | 4.9 | |||||
Abbreviation: CI, confidence interval.
a Percent vaccinated in stratum i = number vaccinated in stratum i /number in study population in stratum i × 100.
b Percentages represent percentage among health-care workers.
c Percentages represent percentage among pregnant women.
d Percentages represent percentage among the chronically ill aged less than 65 years.
e The deprivation score, a continuous variable, was calculated by averaging the deprivation quintile values of the dissemination areas contained within the respective neighborhoods. A value of 1 represents the lowest deprivation level and a value of 5 represents the highest deprivation level.
Vaccinations took place from October 22, 2009, through April 8, 2010. Most (95%) vaccinations occurred before December 16, 2009. Vaccine coverage rose rapidly among health-care workers, pregnant women, and young children once these groups became eligible to receive the vaccine (Figure 2). Vaccine coverage changed little after December 18, corresponding to the closure of the mass vaccination clinics.
Figure 2.

Cumulative pandemic A/H1N1 influenza vaccine coverage in Montreal, Quebec, Canada, from October 22, 2009, to December 31, 2009, among A) designated priority groups and B) different age groups, by date of vaccination. Vertical bars indicate vaccination eligibility dates (see Web Table 1). Part A (priority groups): long-dashed line, health-care workers; solid line, pregnant women; medium-dashed line, chronically ill persons aged <65 years. Part B (age groups): long-dashed line, age 6 months–4 years; short-dashed line, age 5–19 years; solid line, age 20–64 years; medium-dashed line, age ≥65 years.
Neighborhood vaccine coverage varied overall and by sex, age, and priority group (Figure 3). Variation in coverage by neighborhood was lowest among persons aged 20–64 years and greatest among pregnant women. The geographic distribution of vaccine coverage varied overall and by priority group (Figure 4) and age group (Web Figure 1). In the overall population, areas of low coverage were clustered in the northern and eastern neighborhoods of Montreal, coinciding with higher deprivation scores and greater percentages of immigrants (Figure 5).
Figure 3.

Box plots of neighborhood (n = 111) pandemic A/H1N1 influenza vaccine coverage in Montreal, Quebec, Canada, by characteristic, October 2009–April 2010. Neighborhoods with greater than 100% coverage (1 neighborhood for 5- to 19-year-olds, 1 neighborhood for pregnant women, and 5 neighborhoods for health-care workers) were coded as having 100% coverage. The lines of the box represent the first quartile (Q1), the median value (Q2), and the third quartile (Q3). The box spans the interquartile range (IQR; Q3 − Q1). The whiskers (the 2 outermost horizontal lines) represent the lower bound (1.5(IQR) − Q1) and the upper bound (1.5(IQR) + Q3). The dots are outliers (data points outside the upper/lower bounds).
Figure 4.

Choropleth maps of neighborhood pandemic A/H1N1 influenza vaccine coverage in Montreal, Quebec, Canada, among A) the total population, B) pregnant women, C) chronically ill persons under age 65 years, and D) health-care workers, October 2009–April 2010. Neighborhoods with greater than 100% coverage (1 neighborhood for pregnant women and 5 neighborhoods for health-care workers) were coded as having 100% coverage.
Figure 5.

Choropleth maps of neighborhood variables included in an analysis of pandemic A/H1N1 influenza vaccination in Montreal, Quebec, Canada, 2006. A) Material deprivation; B) social deprivation; C) percentage of immigrants. For indices of deprivation, see Pampalon and Raymond (43).
Univariable analyses showed that the percentage of immigrants and material and social deprivation were negatively associated with neighborhood pandemic influenza vaccine coverage in the total population (Table 2). For priority groups, material deprivation was negatively associated with vaccine coverage, particularly among pregnant women (per 1-unit increase in deprivation score, odds ratio (OR) = 0.90, 95% credible interval (CI): 0.82, 0.98) and health-care workers (per unit increase, OR = 0.87, 95% CI: 0.73, 0.99), and percentage of immigrants was negatively associated with vaccine coverage among chronically ill persons under age 65 years (per 5% increase, OR = 0.85, 95% CI: 0.79, 0.91).
Table 2.
Neighborhood Determinants of Pandemic A/H1N1 Vaccination (Univariable Odds Ratios), Montreal, Quebec, Canada, October 2009–April 2010
| Determinant | Total Population |
Pregnant Womena |
Chronically Ill Aged <65 Years |
Health-care Workersb |
||||
|---|---|---|---|---|---|---|---|---|
| OR | 95% CI | OR | 95% CI | OR | 95% CI | OR | 95% CI | |
| Material deprivationc | 0.92 | 0.88, 0.96 | 0.90 | 0.82, 0.98 | 1.01 | 0.96, 1.08 | 0.87 | 0.73, 0.99 |
| Percentage of immigrantsd | 0.85 | 0.81, 0.90 | 0.98 | 0.87, 1.09 | 0.85 | 0.79, 0.91 | 0.92 | 0.76, 1.11 |
| Social deprivationc | 0.89 | 0.83, 0.95 | 1.02 | 0.92, 1.14 | 0.97 | 0.89, 1.05 | 1.00 | 0.84, 1.18 |
Abbreviations: CI, credible interval; OR, odds ratio.
a For neighborhoods with coverage greater than 100% (n = 1), the numerator value was changed to the denominator value.
b For neighborhoods with coverage greater than 100% (n = 5), the numerator value was changed to the denominator value.
c OR for a 1-unit increase in deprivation score.
d OR for a 5% increase in percentage of immigrants.
After adjusting for age, sex, and priority group status, neighborhood material deprivation and the percentage of immigrants remained negatively associated with neighborhood vaccine coverage (Table 3). After adjustment for the effects of other variables, a 1-unit increase in neighborhood material deprivation score resulted in approximately 7%, 15%, and 17% decreases in the odds of neighborhood vaccination among the total population, health-care workers, and pregnant women, respectively (Table 3). We observed 10% and 17% decreases in the odds of neighborhood vaccination for every 5% increase in neighborhood percentage of immigrants in the total population and among the chronically ill under age 65 years, respectively, after adjusting for the effects of other variables (Table 3). There did not appear to be a statistically significant association between social deprivation and vaccine coverage in the multivariable analysis for any of the populations analyzed.
Table 3.
Neighborhood Determinants of Pandemic A/H1N1 Vaccination (Multivariable Odds Ratios), Montreal, Quebec, Canada, October 2009–April 2010
| Determinant | Total Populationa |
Pregnant Womenb,c |
Chronically Ill Aged <65 Yearsd |
Health-Care Workerse,f |
||||
|---|---|---|---|---|---|---|---|---|
| OR | 95% CI | OR | 95% CI | OR | 95% CI | OR | 95% CI | |
| Material deprivationg | 0.93 | 0.88, 0.98 | 0.83 | 0.74, 0.93 | 1.09 | 1.02, 1.17 | 0.85 | 0.70, 0.99 |
| Percentage of immigrantsh | 0.90 | 0.86, 0.95 | 1.08 | 0.95, 1.21 | 0.83 | 0.76, 0.91 | 0.99 | 0.81, 1.22 |
| Social deprivationg | 1.00 | 0.94, 1.07 | 0.98 | 0.87, 1.10 | 0.99 | 0.91, 1.09 | 0.99 | 0.85, 1.17 |
Abbreviations: CI, credible interval; OR, odds ratio.
a Adjusted for percent female, percent aged 20–64 years, percent aged 65 years or more, percentage of pregnant women, percentage of chronically ill persons under age 65 years, and percentage of health-care workers.
b Adjusted for percentage of pregnant women aged 20–44 years and percentage of pregnant women aged 45 years or more.
c For neighborhoods with coverage greater than 100% (n = 1), the numerator value was changed to the denominator value.
d Adjusted for percentage of chronically ill persons aged 20–39 years and percentage of chronically ill persons aged 40–64 years.
e Adjusted for percentage of female health-care workers.
f For neighborhoods with coverage greater than 100% (n = 5), the numerator value was changed to the denominator value.
g OR for a 1-unit increase in deprivation score.
h OR for a 5% increase in percentage of immigrants.
Our results were not sensitive to either the choice of hyperpriors (Web Tables 5–8) or the method used to correct data for neighborhoods with vaccine coverage greater than 100% (Web Tables 9 and 10).
DISCUSSION
Using a population-based immunization registry to estimate events and using census, survey, and administrative records to estimate the population at risk, we calculated pandemic influenza vaccine coverage for an urban area at a high geographic resolution. Overall pandemic influenza vaccine coverage in Montreal was 50%; however, we observed considerable variation by subgroup and geographic region. Females, younger persons, and health-care workers were more likely to receive the vaccine. We found that neighborhoods with higher percentages of immigrants and more material deprivation had lower vaccine coverage.
Neighborhoods with low vaccine coverage, particularly those with vulnerable populations, can contribute to the spread of outbreaks (56, 57). Although the vaccination campaign in Montreal was successful in vaccinating 50% of the total population, there were vulnerable subgroups with particularly low rates of vaccination. The results from this study suggest that neighborhoods with higher percentages of immigrants and material deprivation should be the focus of targeted interventions to increase vaccination during future influenza pandemics.
In this study, we employed methods of estimating vaccine coverage among neighborhoods using publicly available data. The methods described in this study can be used as a framework and can be adapted to estimate vaccine coverage in other areas. We have proposed methods for estimating the sizes of populations of pregnant women using administrative data and the chronically ill using survey data. Depending on the data available, these methods could be adapted—for example, by applying the birth rate by age group to estimate numbers of pregnant women or by using ICD-9 codes defining chronic conditions to estimate numbers of the chronically ill. These methods could also be used together with registry data to monitor neighborhood seasonal influenza vaccine coverage in real time.
Our overall coverage estimate for Montreal is similar to a previously published estimate (50.4%) (4) and greater than estimates reported from other countries (range, 4.8%–20.3%) (7, 9, 10, 12, 13). Our results are similar to those of other studies in which females (10, 17), children (5, 7, 12), and health-care workers (10, 12) were more likely to receive the vaccine.
The geographic variability we observed among population groups was partially explained by neighborhood material deprivation and the percentage of immigrants. Our results are comparable to those of other epidemiologic studies on the determinants of pandemic influenza vaccination in which ethnic origin (7, 10, 13, 18), income (18), occupation (12, 58), and education (12, 37, 59–61) predicted vaccination. A review of determinants of seasonal influenza vaccination also observed lower vaccine coverage among racial and ethnic minorities and persons living in poverty (62). Lower coverage in areas with greater percentages of immigrants may be due to barriers in access to health care, transportation, knowledge, and language (63–67). One possible reason for lower coverage in areas with more material deprivation may be poor understanding of and lower sensitivity to public health messages, leading to decreased health awareness and the adoption of fewer public health interventions (68). We observed differences in determinants by priority group, indicating that the neighborhood factors that influence the decision to receive the vaccine probably differ by priority group.
Because of the large neighborhood variability observed, our results suggest that coverage should ideally be measured at the neighborhood level. Neighborhood estimates of coverage are essential for public health officials to make informed decisions during vaccination campaigns. Using registry data, we were able to calculate estimates of vaccine coverage at a higher geographic resolution than any estimates previously published or obtained using traditional survey methodology. However, estimating denominators for priority groups for small areas is a challenge, as data describing persons within priority groups are not readily available. Although our methods of estimation have not been validated for small areas, our results are similar to those from other studies. We observed a small percentage of observations (1.4%) with coverage over 100%. Although we cannot verify whether this finding reflects an issue with numerator data (overreported priority group status which was not consistently verified at the point of care) or denominator data (estimation errors leading to underestimation), our sensitivity analyses indicated that these observations did not affect our results.
There were other limitations of our study that were unrelated to our method of estimation. Our data were restricted to vaccinations that took place on the Island of Montreal among residents. We were missing 1% of vaccinations among residents that took place off the island, comprised mostly of health-care workers who were vaccinated at their off-island workplaces (information provided by the National Public Health Institute of Quebec). Because we studied the determinants of vaccination at the neighborhood level, we cannot extrapolate our findings to individuals, although our neighborhood perspective compliments the results of individual-level studies.
This study highlights the importance of measuring vaccine coverage at the neighborhood level. We have described methods for estimating at-risk populations for small areas and have identified population-level characteristics that can be used by public health officials to strategically plan for future influenza pandemics.
ACKNOWLEDGMENTS
Author affiliations: Surveillance Lab, Clinical and Health Informatics Research Group, McGill University, Montreal, Quebec, Canada (Stephanie Brien, Katia M. Charland, Aman D. Verma, David L. Buckeridge); Department of Epidemiology, Biostatistics and Occupational Health, Faculty of Medicine, McGill University, Montreal, Quebec, Canada (Stephanie Brien, Katia M. Charland, Aman D. Verma, John S. Brownstein, David L. Buckeridge); Institute for Clinical Evaluative Sciences, Toronto, Ontario, Canada (Jeffrey C. Kwong); Department of Family and Community Medicine, Faculty of Medicine, University of Toronto, Toronto, Ontario, Canada (Jeffrey C. Kwong); Division of Epidemiology, Dalla Lana School of Public Health, Toronto, Ontario, Canada (Jeffrey C. Kwong); Department of Surveillance and Epidemiology, Public Health Ontario, Toronto, Ontario, Canada (Jeffrey C. Kwong); Children's Hospital Informatics Program, Children's Hospital Boston, Boston, Massachusetts (Katia M. Charland, John S. Brownstein); Department of Pediatrics, Harvard Medical School, Boston, Massachusetts (Katia M. Charland, John S. Brownstein); and Public Health Department of the Health and Social Services Agency of Montreal, Montreal, Quebec, Canada (David L. Buckeridge).
This work was supported by the Public Health Agency of Canada/Canadian Institutes of Health Research Influenza Research Network (graduate student scholarship to S. B.) and the Canadian Institutes of Health Research (grants HIN-218590 and PAN-83152 to D. B.).
The authors thank Dr. Luc de Montigny for his assistance with geographic information system software.
Part of this work was presented at the annual general meeting of the Public Health Agency of Canada/Canadian Institutes of Health Research Influenza Research Network in Ottawa, Ontario, on April 20, 2011; at the Epidemiology, Biostatistics and Occupational Health Student Society's seventh annual Student Research Day in Montreal, Quebec, on April 27, 2011; and at the 2011 student conference of the Canadian Society for Epidemiology and Biostatistics in Montreal, Quebec, on June 20, 2011.
Conflict of interest: none declared.
REFERENCES
- 1.Communicable Diseases Department. Chronology of Influenza A (H1N1) New Delhi, India: World Health Organization Regional Office for South-East Asia; 2009. World Health Organization Regional Office for South-East Asia. (www.searo.who.int/.../Influenza_A(H1N1)_Chronology_of_Influenza_A(H1N1).pdf. ). (Accessed November 26, 2011) [Google Scholar]
- 2.World Health Organization. World Now at the Start of 2009 Influenza Pandemic. Geneva, Switzerland: World Health Organization; 2009. (http://www.who.int/mediacentre/news/statements/2009/h1n1_pandemic_phase6_20090611/en/index.html. ). (Accessed July 4, 2011) [Google Scholar]
- 3.Canadian Broadcasting Corporation. 1 Confirmed Case of Swine Flu in Quebec. Montreal. Quebec, Canada: Canadian Broadcasting Corporation; 2009. (http://www.cbc.ca/canada/montreal/story/2009/04/30/montreal-swine-quebec-0430.html. ). (Accessed July 4, 2011) [Google Scholar]
- 4.Pandémie Québec, Gouvernement du Québec. Statistiques descriptives de la grippe pandémique A(H1N1). Québec, Québec. Canada: Pandémie Québec; 2009. (http://www.msss.gouv.qc.ca/extranet/pandemie/etat_situation/ ). (Accessed July 4, 2011) [Google Scholar]
- 5.Bone A, Guthmann JP, Nicolau J, et al. Population and risk group uptake of H1N1 influenza vaccine in mainland France 2009–2010: results of a national vaccination campaign. Vaccine. 2010;28(51):8157–8161. doi: 10.1016/j.vaccine.2010.09.096. [DOI] [PubMed] [Google Scholar]
- 6.Interim results: state-specific influenza A (H1N1) 2009. monovalent vaccination coverage—United States, October 2009–January 2010. MMWR Morb Mortal Wkly Rep. 2010;59(12):363–368. [PubMed] [Google Scholar]
- 7.Interim results: influenzaA (H1N1) 2009 monovalent vaccination coverage—United States, October–December 2009. MMWR Morb Mortal Wkly Rep. 2010;59(2):44–48. [PubMed] [Google Scholar]
- 8.Gargano LM, Painter JE, Sales JM, et al. Seasonal and 2009 H1N1 influenza vaccine uptake, predictors of vaccination, and self-reported barriers to vaccination among secondary school teachers and staff. Hum Vaccin. 2011;7(1):89–95. doi: 10.4161/hv.7.1.13460. [DOI] [PMC free article] [PubMed] [Google Scholar]
- 9.Gaygisiz Ü, Gaygisiz E, Özkan T, et al. Why were Turks unwilling to accept the A/H1N1 influenza-pandemic vaccination? People's beliefs and perceptions about the swine flu outbreak and vaccine in the later stage of the epidemic. Vaccine. 2010;29(2):329–333. doi: 10.1016/j.vaccine.2010.10.030. [DOI] [PubMed] [Google Scholar]
- 10.Mak DB, Daly AM, Armstrong PK, et al. Pandemic (H1N1) 2009 influenza vaccination coverage in Western Australia. Med J Aust. 2010;193(7):401–404. doi: 10.5694/j.1326-5377.2010.tb03969.x. [DOI] [PubMed] [Google Scholar]
- 11.Maurer J, Uscher-Pines L, Harris KM. Perceived seriousness of seasonal and A(H1N1) influenzas, attitudes toward vaccination, and vaccine uptake among U.S. adults: does the source of information matter? Prev Med. 2010;51(2):185–187. doi: 10.1016/j.ypmed.2010.05.008. [DOI] [PubMed] [Google Scholar]
- 12.Vaux S, Van Cauteren D, Guthmann JP, et al. Influenza vaccination coverage against seasonal and pandemic influenza and their determinants in France: a cross-sectional survey. BMC Public Health. 2011;11(1):30. doi: 10.1186/1471-2458-11-30. doi:10.1186/1471-2458-11-30. [DOI] [PMC free article] [PubMed] [Google Scholar]
- 13.Velan B, Kaplan G, Ziv A, et al. Major motives in non-acceptance of A/H1N1 flu vaccination: the weight of rational assessment. Vaccine. 2011;29(6):1173–1179. doi: 10.1016/j.vaccine.2010.12.006. [DOI] [PubMed] [Google Scholar]
- 14.Barrière J, Vanjak D, Kriegel I, et al. Acceptance of the 2009 A(H1N1) influenza vaccine among hospital workers in two French cancer centers. Vaccine. 2010;28(43):7030–7034. doi: 10.1016/j.vaccine.2010.08.021. [DOI] [PubMed] [Google Scholar]
- 15.Nougairède A, Lagier JC, Ninove L, et al. Likely correlation between sources of information and acceptability of A/H1N1 swine-origin influenza virus vaccine in Marseille, France. PLoS ONE. 2010;5(6):pe11292. doi: 10.1371/journal.pone.0011292. doi:10.1371/journal.pone.0011292. [DOI] [PMC free article] [PubMed] [Google Scholar]
- 16.Amodio E, Anastasi G, Marsala MG, et al. Vaccination against the 2009 pandemic influenza A (H1N1) among healthcare workers in the major teaching hospital of Sicily (Italy) Vaccine. 2011;29(7):1408–1412. doi: 10.1016/j.vaccine.2010.12.041. [DOI] [PubMed] [Google Scholar]
- 17.Park SW, Lee JH, Kim ES, et al. Adverse events associated with the 2009 H1N1 influenza vaccination and the vaccination coverage rate in health care workers. Am J Infect Control. 2011;39(1):69–71. doi: 10.1016/j.ajic.2010.08.007. [DOI] [PubMed] [Google Scholar]
- 18.Rodríguez-Rieiro C, Esteban-Vasallo MD, Domínguez-Berjón MF, et al. Coverage and predictors of vaccination against 2009 pandemic H1N1 influenza in Madrid, Spain. Vaccine. 2011;29(6):1332–1338. doi: 10.1016/j.vaccine.2010.10.061. [DOI] [PubMed] [Google Scholar]
- 19.Stavroulopoulos A, Stamogiannos G, Aresti V. Pandemic 2009 influenza H1N1 virus vaccination: compliance and safety in a single hemodialysis center. Ren Fail. 2010;32(9):1044–1048. doi: 10.3109/0886022X.2010.510232. [DOI] [PubMed] [Google Scholar]
- 20.Statistics Canada. Population and Dwelling Counts, for Canada, Provinces and Territories, and Census Divisions, 2006 and 2001 Censuses—100% Data. Ottawa, Ontario, Canada: Statistics Canada; 2008. (http://www12.statcan.ca/english/census06/data/popdwell/Table.cfm?T=702&PR=24&SR=1&S=3&O=D. ). (Accessed July 15, 2011) [Google Scholar]
- 21.Statistics Canada. 2006 Census Dictionary. Ottawa, Ontario, Canada: Statistics Canada; 2007. (http://www12.statcan.ca/census-recensement/2006/ref/dict/index-eng.cfm. ). (Accessed July 15, 2011) [Google Scholar]
- 22.Agence de la santé et des services sociaux de Montréal, Gouvernement du Québec. Définition des découpages géographiques. Montréal, Québec, Canada: Agence de la santé et des services sociaux de Montréal; 2012. (http://emis.santemontreal.qc.ca/outils/atlas-sante-montreal/caracteristiques-de-la-population/definition-des-decoupages-geographiques/ ). (Accessed February 23, 2012) [Google Scholar]
- 23.Bérard A, Lacasse A. Validity of perinatal pharmacoepidemiologic studies using data from the RAMQ administrative database. Can J Clin Pharmacol. 2009;16(2):e360–e369. [PubMed] [Google Scholar]
- 24.Bérard A, Azoulay L, Koren G, et al. Isotretinoin, pregnancies, abortions and birth defects: a population-based perspective. Br J Clin Pharmacol. 2007;63(2):196–205. doi: 10.1111/j.1365-2125.2006.02837.x. [DOI] [PMC free article] [PubMed] [Google Scholar]
- 25.Martel MJ, Rey E, Beauchesne MF, et al. Use of inhaled corticosteroids during pregnancy and risk of pregnancy induced hypertension: nested case-control study. BMJ. 2005;330(7485):230. doi: 10.1136/bmj.38313.624352.8F. doi:10.1136/bmj.38313.624352.8F. [DOI] [PMC free article] [PubMed] [Google Scholar]
- 26.Public Health Agency of Canada. Canadian Chronic Disease Surveillance System Methods Documentation, 2009. Ottawa, Ontario, Canada: Public Health Agency of Canada; 2010; [Google Scholar]
- 27.Hux JE, Ivis F, Flintoft V, et al. Diabetes in Ontario: determination of prevalence and incidence using a validated administrative data algorithm. Diabetes Care. 2002;25(3):512–516. doi: 10.2337/diacare.25.3.512. [DOI] [PubMed] [Google Scholar]
- 28.Jimenez-Garcia R, Carrasco-Garrido P, Hernandez-Barrera V, et al. Estimates of influenza vaccination target population sizes in Spain for the 2006–2007 season. Vaccine. 2007;25(17):3249–3253. doi: 10.1016/j.vaccine.2007.01.004. [DOI] [PubMed] [Google Scholar]
- 29.Centers for Disease Control and Prevention, US Department of Health and Human Services. Projected Influenza Vaccination Target Population Sizes, Vaccination Coverage and Doses to Be Used During the 2008–09 Season. Atlanta, GA: Centers for Disease Control and Prevention; 2008. (http://www.cdc.gov/flu/professionals/pdf/influenza_vaccine_target_populations.pdf. ). (Accessed July 15, 2011) [Google Scholar]
- 30.Statistics Canada. National Population Health Survey: Health Institutions 1999 Questionnaire. Ottawa, Ontario, Canada: Statistics Canada; 2000. (http://www.statcan.gc.ca/imdb-bmdi/instrument/5003_Q1_V3-eng.pdf. ). (Accessed June 15, 2011) [Google Scholar]
- 31.Statistics Canada. Canadian Community Health Survey (CCHS) 2008 Questionnaire. Ottawa, Ontario, Canada: Statistics Canada; 2009. (http://www.statcan.gc.ca/imdb-bmdi/instrument/3226_Q1_V5-eng.pdf. ). (Accessed July 15, 2011) [Google Scholar]
- 32.Johansen H, Sambell C, Zhao W. Flu shots—national and provincial/territorial trends. Health Rep. 2006;17(2):43–48. [PubMed] [Google Scholar]
- 33.Kwong JC, Rosella LC, Johansen H. Trends in influenza vaccination in Canada, 1996/1997 to 2005. Health Rep. 2007;18(4):9–19. [PubMed] [Google Scholar]
- 34.Statistics Canada. Canadian Community Health Survey (CCHS). 2007 Microdata Files—User Guide. Ottawa, Ontario, Canada: Statistics Canada; 2008. (http://www.statcan.gc.ca/imdb-bmdi/document/3226_D7_T9_V4-eng.pdf. ). (Accessed July 15, 2011) [Google Scholar]
- 35.Russell ML. Denominators for estimation of influenza vaccine coverage among high risk persons aged 15 to 64 years. Can J Public Health. 1996;87(5):301–304. [PubMed] [Google Scholar]
- 36.Jimenez-Garcia R, Carrasco-Garrido P, Hernandez-Barrera V, et al. Influenza vaccination coverage and predictors for vaccination among Spanish healthcare workers. Hum Vaccin. 2007;3(1):33–36. doi: 10.4161/hv.3.1.3750. [DOI] [PubMed] [Google Scholar]
- 37.Interim results: influenza A (H1N1) 2009. monovalent and seasonal influenza vaccination coverage among health-care personnel—United States, August 2009–January 2010. MMWR Morb Mortal Wkly Rep. 2010;59(12):357–362. [PubMed] [Google Scholar]
- 38.Seale H, Kaur R, Wang Q, et al. Acceptance of a vaccine against pandemic influenza A (H1N1) virus amongst healthcare workers in Beijing, China. Vaccine. 2011;29(8):1605–1610. doi: 10.1016/j.vaccine.2010.12.077. [DOI] [PubMed] [Google Scholar]
- 39.Torun SD, Torun F. Vaccination against pandemic influenza A/H1N1 among healthcare workers and reasons for refusing vaccination in Istanbul in last pandemic alert phase. Vaccine. 2010;28(35):5703–5710. doi: 10.1016/j.vaccine.2010.06.049. [DOI] [PubMed] [Google Scholar]
- 40.Torun SD, Torun F, Catak B. Healthcare workers as parents: attitudes toward vaccinating their children against pandemic influenza A/H1N1. BMC Public Health. 2010;10:596. doi: 10.1186/1471-2458-10-596. doi:10.1186/1471-2458-10-596. [DOI] [PMC free article] [PubMed] [Google Scholar]
- 41.Vírseda S, Restrepo MA, Arranz E, et al. Seasonal and pandemic A (H1N1) 2009 influenza vaccination coverage and attitudes among health-care workers in a Spanish university hospital. Vaccine. 2010;28(30):4751–4757. doi: 10.1016/j.vaccine.2010.04.101. [DOI] [PMC free article] [PubMed] [Google Scholar]
- 42.Brien S, Kwong JC, Buckeridge DL. The determinants of 2009 pandemic A/H1N1 influenza vaccination: a systematic review. Vaccine. 2012;30(7):1255–1264. doi: 10.1016/j.vaccine.2011.12.089. [DOI] [PubMed] [Google Scholar]
- 43.Pampalon R, Raymond G. A deprivation index for health and welfare planning in Quebec. Chronic Dis Can. 2000;21(3):104–113. [PubMed] [Google Scholar]
- 44.Gamache P, Pampalon R, Hamel D. Methodological Guide—“The Material and Social Deprivation Index: A Summary.”. Québec, Québec, Canada: Institut national de santé publique du Québec; 2010. (http://www.inspq.qc.ca/santescope/documents/Guide_Metho_Indice_defavo_Sept_2010_A.pdf. ). (Accessed July 4, 2011) [Google Scholar]
- 45.Crouse DL, Ross NA, Goldberg MS. Double burden of deprivation and high concentrations of ambient air pollution at the neighbourhood scale in Montreal, Canada. Soc Sci Med. 2009;69(6):971–981. doi: 10.1016/j.socscimed.2009.07.010. [DOI] [PubMed] [Google Scholar]
- 46.Philibert MD, Pampalon R, Hamel D, et al. Material and social deprivation and health and social services utilisation in Québec: a local-scale evaluation system. Soc Sci Med. 2007;64(8):1651–1664. doi: 10.1016/j.socscimed.2006.12.010. [DOI] [PubMed] [Google Scholar]
- 47.Gagné M, Hamel D. Deprivation and unintentional injury hospitalization in Quebec children. Chronic Dis Can. 2009;29(2):56–69. [PubMed] [Google Scholar]
- 48.Charland KM, Brownstein JS, Verma A, et al. Socio-economic disparities in the burden of seasonal influenza: the effect of social and material deprivation on rates of influenza infection. PLoS ONE. 2011;6(2):e17207. doi: 10.1371/journal.pone.0017207. doi:10.1371/journal.pone.0017207. [DOI] [PMC free article] [PubMed] [Google Scholar]
- 49.Burrows S, Auger N, Roy M, et al. Socio-economic inequalities in suicide attempts and suicide mortality in Québec, Canada, 1990–2005. Public Health. 2010;124(2):78–85. doi: 10.1016/j.puhe.2010.01.008. [DOI] [PubMed] [Google Scholar]
- 50.Schmitz N, Nitka D, Gariepy G, et al. Association between neighborhood-level deprivation and disability in a community sample of people with diabetes. Diabetes Care. 2009;32(11):1998–2004. doi: 10.2337/dc09-0838. [DOI] [PMC free article] [PubMed] [Google Scholar]
- 51.Statistics Canada. Census Tract Suppression List With Names—100% Data. Ottawa, Ontario, Canada: Statistics Canada; 2008. (http://www12.statcan.ca/census-recensement/2006/ref/notes/sup_CT2A-SR2A-eng.cfm. ). (Accessed July 15, 2011) [Google Scholar]
- 52.Statistics Canada. 2006 Community Profiles Suppression Criteria. Ottawa, Ontario, Canada: Statistics Canada; 2010. (http://www12.statcan.ca/census-recensement/2006/dp-pd/prof/92-591/help-aide/metadata/Suppression.cfm?Lang=E. ). (Accessed November 29, 2011) [Google Scholar]
- 53.Montomoli C, Allemani C, Solinas G, et al. An ecologic study of geographical variation in multiple sclerosis risk in central Sardinia, Italy. Neuroepidemiology. 2002;21(4):187–193. doi: 10.1159/000059522. [DOI] [PubMed] [Google Scholar]
- 54.Lawson AB, Browne WJ, Rodeiro CLV. Disease Mapping With WinBUGS and MLwiN. United Kingdom: John Wiley & Sons, Publishers; 2003. [Google Scholar]
- 55.Besag J, York J, Mollié A. Bayesian image restoration, with two applications in spatial statistics. Ann Inst Stat Math. 1991;43(1):1–59. [Google Scholar]
- 56.Omer SB, Salmon DA, Orenstein WA, et al. Vaccine refusal, mandatory immunization, and the risks of vaccine-preventable diseases. N Engl J Med. 2009;360(19):1981–1988. doi: 10.1056/NEJMsa0806477. [DOI] [PubMed] [Google Scholar]
- 57.Salathé M, Bonhoeffer S. The effect of opinion clustering on disease outbreaks. J R Soc Interface. 2008;5(29):1505–1508. doi: 10.1098/rsif.2008.0271. [DOI] [PMC free article] [PubMed] [Google Scholar]
- 58.Ozer A, Arikan DC, Kirecci E, et al. Status of pandemic influenza vaccination and factors affecting it in pregnant women in Kahramanmaras, an eastern Mediterranean city of Turkey. PLoS ONE. 2010;5(12):e14177. doi: 10.1371/journal.pone.0014177. doi:10.1371/journal.pone.0014177. [DOI] [PMC free article] [PubMed] [Google Scholar]
- 59.Fabry P, Gagneur A, Pasquier JC. Determinants of A(H1N1) vaccination: cross-sectional study in a population of pregnant women in Quebec. Vaccine. 2011;29(9):1824–1829. doi: 10.1016/j.vaccine.2010.12.109. [DOI] [PubMed] [Google Scholar]
- 60.Mavros MN, Mitsikostas PK, Kontopidis IG, et al. H1N1v influenza vaccine in Greek medical students. Eur J Public Health. 2011;21(3):329–332. doi: 10.1093/eurpub/ckq109. [DOI] [PubMed] [Google Scholar]
- 61.Printza N, Farmaki E, Bosdou J, et al. Pandemic influenza A 2009 (H1N1) vaccination in high risk children with chronic renal diseases: acceptance and perceptions. Hum Vaccin. 2010;6(10):819–822. doi: 10.4161/hv.6.10.12846. [DOI] [PubMed] [Google Scholar]
- 62.Ompad DC, Galea S, Vlahov D. Distribution of influenza vaccine to high-risk groups. Epidemiol Rev. 2006;28:54–70. doi: 10.1093/epirev/mxj004. [DOI] [PubMed] [Google Scholar]
- 63.Rangel MC, Shoenbach VJ, Weigle KA, et al. Racial and ethnic disparities in influenza vaccination among elderly adults. J Gen Intern Med. 2005;20(5):426–431. doi: 10.1111/j.1525-1497.2005.0097.x. [DOI] [PMC free article] [PubMed] [Google Scholar]
- 64.Logan JL. Disparities in influenza immunization among US adults. J Natl Med Assoc. 2009;101(2):161–166. doi: 10.1016/s0027-9684(15)30830-0. [DOI] [PubMed] [Google Scholar]
- 65.Hebert PL, Frick KD, Kane RL, et al. The causes of racial and ethnic differences in influenza vaccination rates among elderly Medicare beneficiaries. Health Serv Res. 2005;40(2):517–537. doi: 10.1111/j.1475-6773.2005.00370.x. [DOI] [PMC free article] [PubMed] [Google Scholar]
- 66.Chen JY, Fox SA, Cantrell CH, et al. Health disparities and prevention: racial/ethnic barriers to flu vaccinations. J Community Health. 2007;32(1):5–20. doi: 10.1007/s10900-006-9031-7. [DOI] [PubMed] [Google Scholar]
- 67.Lu P, Bridges CB, Euler GL, et al. Influenza vaccination of recommended adult populations, U.S., 1989–2005. Vaccine. 2008;26(14):1786–1793. doi: 10.1016/j.vaccine.2008.01.040. [DOI] [PubMed] [Google Scholar]
- 68.Ward L, Draper J. A review of the factors involved in older people's decision making with regard to influenza vaccination: a literature review. J Clin Nurs. 2008;17(1):5–16. doi: 10.1111/j.1365-2702.2006.01861.x. [DOI] [PubMed] [Google Scholar]