

Abstract
Crawling locomotion of eukaryotic cells is achieved by a process dependent on the actin cytoskeleton1: protrusion of the leading edge requires assembly of a network of actin filaments2, which must be disassembled at the cell rear for sustained motility. Although ADF/cofilin proteins have been shown to contribute to actin disassembly3, it is not clear how activity of these locally acting proteins could be coordinated over the whole-cell distance scale. Here we show that nonmuscle myosin II plays a direct role in actin network disassembly in crawling cells. In moving fish keratocytes, myosin II is concentrated in regions at the rear with high rates of network disassembly. Activation of myosin II by ATP in detergent-extracted cytoskeletons results in rear-localized disassembly of the actin network. Inhibition of myosin II activity and stabilization of actin filaments synergistically impede cell motility, suggesting the existence of two disassembly pathways, one of which requires myosin II activity. Our results establish the importance of myosin II as an enzyme for actin network disassembly; we propose that gradual formation and reorganization of an actomyosin network provides an intrinsic destruction timer, enabling long-range coordination of actin network treadmilling in motile cells.
A thorough understanding of actin polymerization-based crawling at the whole-cell scale has long been a challenge in the field of cell biology. A combination of biochemical and cell-biological experiments has led to a consensus model for the mechanism by which steady-state actin network treadmilling in the lamellipodia of motile cells contributes to protrusion of the leading edge: new filaments are nucleated near the leading edge, resulting in the assembly of a branched actin network, which is eventually disassembled by ADF/cofilin proteins, replenishing the pool of polymerizable actin monomers3.
However, extending this model from the micrometer scale of the leading edge lamellipodium to the tens-of-micrometers scale of an entire cell requires a mechanism for longer-range coordination: a cell-scale spatial organization of network assembly and disassembly processes, giving rise to sustained whole-cell motility. The molecular mechanisms of actin network disassembly and its spatial regulation in motile cells are not completely understood (Supplementary Note 1).
Here we use fish epidermal keratocytes (Fig. 1a) as a model system to investigate the spatial regulation of actin network turnover in motile cells. These cells are fast-moving with persistent velocity and shape4 and maintain a continuous actin network throughout the lamellipodium5,6 (Fig. 1b), implying that the net rates of assembly at the front and disassembly at the rear must be closely and constantly coordinated. This property allows us to analyze network turnover based on steady-state measurements.
Figure 1. Myosin II in keratocytes colocalizes with the primary sites of actin network disassembly.
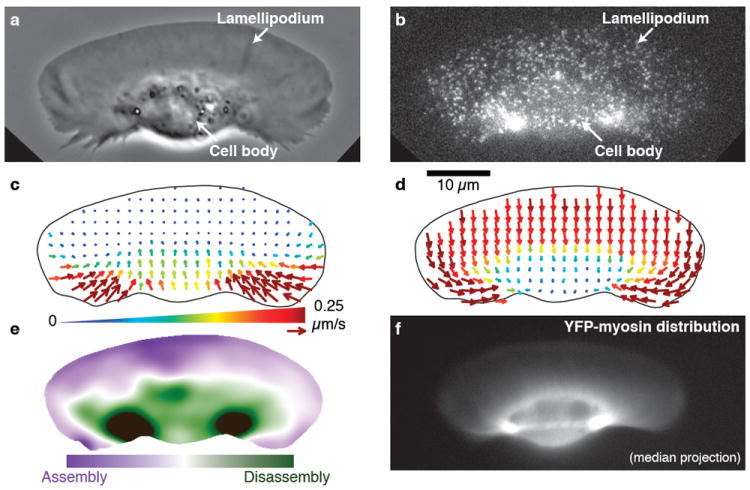
a–e, data and analysis of a single live keratocyte. a, Phase-contrast image of the keratocyte moving upward. b, Fluorescence speckle microscopy (FSM) image of the actin network labeled with a low concentration of phalloidin. c, F-actin flow field based on speckle tracking, in the laboratory frame of reference. Arrow length and color both indicate the speed of actin network flow. d, F-actin flow field in the cell frame of reference. e, Steady-state net F-actin assembly and disassembly. f, Fluorescence image of YFP-tagged myosin regulatory light chain in a keratocyte of similar size and shape to the one shown in a–e. Myosin II is found at low levels throughout the lamellipodium and at the highest concentrations in two foci flanking the cell body, which coincide with the primary sites of actin network disassembly as shown in e.
To investigate the spatial organization of actin network movement and dynamics, we performed fluorescence speckle microscopy (FSM) on cells moving at steady state (Fig. 1b). The direction and speed of actin network movement was determined by speckle flow tracking7 as a function of position within the lamellipodium (Fig. 1c). Consistent with photoactivation experiments2, we found that the actin network in the lamellipodium remains nearly stationary with respect to the substrate, with minimal retrograde flow (Fig. 1c). At the cell rear, the actin network moved forward and rapidly inward from the sides.
To analyze the movement of the actin network relative to the boundaries of these fast-moving cells, we represented the FSM flow field in the cell’s moving frame of reference8 (Fig. 1d, Supplementary Movie 1). In the cell frame of reference, movement of the network appeared uniform and rearward in the front of the cell, and almost completely perpendicular to the direction of motion at the rear sides. Under the cell body, network flow ceased without significantly changing its direction.
The pattern of fluorescent speckle motion suggests that net actin network assembly occurred in the front of the cell and net disassembly in the rear. This was confirmed by calculating the spatial distribution of net filamentous actin (F-actin) assembly and disassembly, using actin speckle density and the divergence of the FSM flow field9 (Fig. 1e; Supplementary Fig. 2a). Intriguingly, we found that the rear-localized pattern of disassembly, with two foci flanking the cell body, was strongly reminiscent of the distribution of myosin II, as visualized by YFP-tagged myosin II regulatory light chain (Fig. 1f).
While the role of myosin II in the rear of motile cells is conventionally associated with mechanical force generation and contraction (Supplementary Note 2), several lines of evidence raise the possibility that myosin II may also play a specific role in driving actin network disassembly. Spatially correlated contraction and actin depolymerization in motile cells has been shown to be promoted by a drug that stimulates myosin II activity9. In cytokinesis, where contraction of the cleavage furrow is driven in part by myosin II motor activity, inhibition of myosin II leads to increased accumulation of F-actin in the cleavage furrow, consistent with a role for myosin II in regulating or catalyzing F-actin disassembly in the contractile ring10,11. During the early steps of inner ear morphogenesis, myosin II activity is required for depletion of F-actin from the basal cortex of an ectodermal sheet12. More directly, myosin II has been shown to potentiate severing and disassembly of actin filament bundles at the base of neuronal growth cones13. Finally, in a recent in vitro experiment, a loss of actin filaments in solution has been observed in the presence of purified myosin II14.
Our observation of disassembly colocalized with myosin II density suggested that such a link between myosin II activity and actin network disassembly might be at work in keratocyte motility. To investigate this possibility, we treated keratocytes with the myosin II ATPase inhibitor, blebbistatin15. Although blebbistatin-treated cells continued to move with little shape change at the leading edge (Fig. 2, Supplementary Movie 1) and with only a moderate decrease in speed (Fig. 3f), the pattern of disassembly was markedly altered: the two foci of disassembly adjacent to the cell body disappeared, and disassembly was distributed along the trailing edge (Fig. 2e, Supplementary Note 3b).
Figure 2. Inhibition of myosin II blocks inward flow and alters the pattern of disassembly of the actin network.
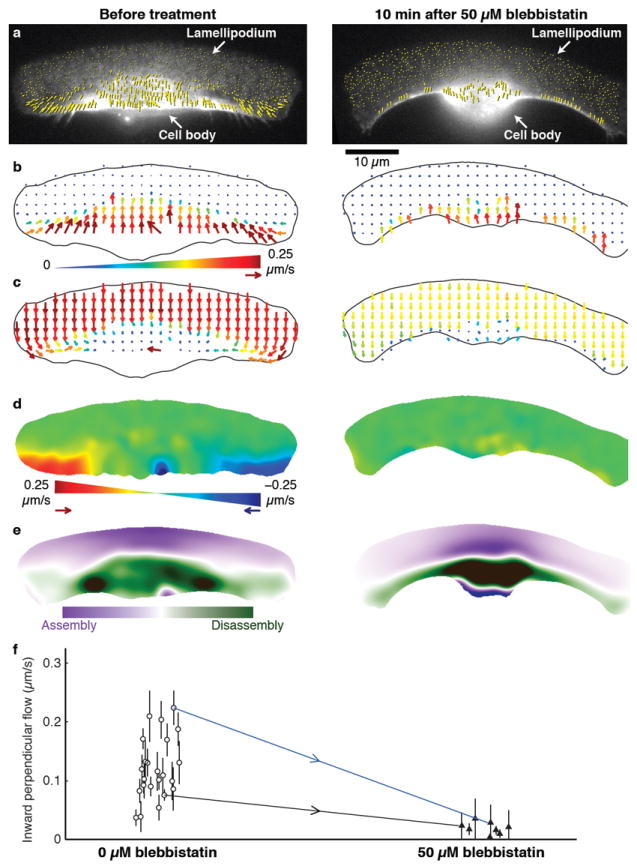
a–e, Analysis of actin network flow in a single keratocyte before (left) and ~10 min after (right) addition of 50 μM blebbistatin. a, Raw F-actin speckle flow measurements (yellow arrows) in the laboratory frame of reference, superimposed on the corresponding FSM frames. b, Resampled flow field in the laboratory frame of reference. c, Resampled flow field in the cell frame of reference. d, Maps showing the component of network flow perpendicular to the direction of cell movement (“perpendicular flow”), in the cell frame of reference. Red indicates F-actin flow toward the right; blue, toward the left. Actin network movement in the green regions is parallel to the direction of cell locomotion. Blebbistatin treatment abolishes inward flow. e, Steady-state assembly/disassembly maps. Before blebbistatin treatment, the highest rate of disassembly is found in two foci flanking the cell body. After blebbistatin treatment, disassembly is distributed along the rear margin. f, Inward perpendicular flow of the actin network in untreated (white circles; n = 23) and blebbistatin-treated (black triangles; n = 8) cells. Error bars indicate average ± s.d. over each movie (typically 4 min). Measurements were made both before and after treatment for two of the cells; blue and black arrows connect the corresponding data points. The data points connected by the blue arrow correspond to the cell shown in a–e. Compare Supplementary Movie 1.
Figure 3. Jasplakinolide specifically halts actin dynamics of cells in which myosin II is inhibited.

a, Raw F-actin speckle flow measurements in the cell frame of reference (yellow arrows) superimposed on the corresponding FSM frames, for a cell in 50 μM blebbistatin before (top) and ~2 min after (middle) addition of 1 μM jasplakinolide. Bottom, a separate cell in jasplakinolide alone. b, F-actin flow magnitude maps corresponding to a. The combination of blebbistatin and jasplakinolide immobilizes the actin network, an effect that is not achieved by either drug alone. c–e, Fixed, phalloidin-labeled keratocytes, untreated (c) or treated with 50 μM blebbistatin (d) or 1 μM jasplakinolide (e). Consistent with impaired actin network disassembly, blebbistatin-treated cells accumulate F-actin along the rear margin; jasplakinolide-treated cells underneath the cell body. f, Treatment with either 5 nM latrunculin A, 50 μM blebbistatin, or 1 μM jasplakinolide can slow cells relative to the control population. The combination of blebbistatin and latrunculin A or jasplakinolide and latrunculin A has no significant further effect on cell speed than either drug alone. The combination of blebbistatin and jasplakinolide significantly (p < 0.05 by Tukey’s test) and synergistically slows cell locomotion. g, Blebbistatin causes significant (p < 0.05 by Tukey’s test) F-actin accumulation in the trailing “tails” (but not in the cell body), whereas jasplakinolide causes accumulation underneath the cell body (but not in the “tails”), relative to untreated cells. a.u., arbitrary units (see Methods). Compare c–e. Box-and-whisker plots (f and g) indicate the mean, 95% confidence interval (C.I.), extrema and quartiles, for the indicated number of cells (n) in each treatment group. Compare Supplementary Movie 3.
Continued motility of keratocytes under blebbistatin treatment indicates that at least some actin network disassembly activity was retained. We judged that inhibition of myosin II was essentially complete under the conditions of our blebbistatin treatment (50 μM active enantiomer, 10 min) based on two criteria. First, two aspects of motility that are normally attributed to myosin II activity (Supplementary Note 2) were reduced below the detection limit: inward flow in the cell rear (Fig. 2b–d; Supplementary Movie 1) and inward traction force (Supplementary Fig. 3, Supplementary Movie 2). Second, increasing the blebbistatin concentration by two-fold did not have a further effect on cell speed (data not shown). These observations led us to hypothesize that there may be a parallel pathway that disassembles the actin network independent of myosin II.
We thus proceeded to examine the effect of myosin II inhibition in a sensitized background where actin depolymerization was partially inhibited. The F-actin stabilizing drug jasplakinolide11,16, at 1 μM, decreased cell speed moderately, an effect comparable to that of 50 μM blebbistatin (Fig. 3f). For cells pre-incubated with 50 μM blebbistatin, however, 1 μM jasplakinolide dramatically inhibited motility (Fig. 3a, b, f; Supplementary Movie 3), often causing a rapid and complete cessation of both movement and actin network flow (Fig. 3a, b; Supplementary Movie 3). To test the specificity of this synthetic effect, we examined the effect of latrunculin A, which slows actin network turnover by sequestering monomer (inhibiting polymerization) rather than by inhibiting depolymerization. While 50 nM latrunculin A caused keratocytes to lose polarity and stop moving (data not shown), 5 nM latrunculin A caused a speed decrease comparable to sole treatment with either 50 μM blebbistatin or 1 μM jasplakinolide (Fig. 3f). Treatment with the combination of blebbistatin and latrunculin A, or jasplakinolide and latrunculin A, did not have a synthetic effect on cell speed (Fig. 3f). This suggested that the synthetic effect was not simply a result of actin monomer depletion, but specific to disassembly inhibition. Both blebbistatin-treated cells and jasplakinolide-treated cells showed an unusual accumulation of F-actin in the cell rear, but the patterns were distinct: in blebbistatin-treated cells, F-actin accumulated primarily along the trailing edge and in tail-like structures (Fig. 3d, g), whereas in jasplakinolide-treated cells F-actin accumulated under the cell body (Fig. 3e, g). These observations are consistent with the existence of two complementary and partially redundant mechanisms for actin network disassembly, one dependent on myosin II activity and the other inhibited by jasplakinolide.
Our in vivo experiments do not distinguish between a direct or indirect contribution of myosin II activity to actin network disassembly. To investigate the specific contribution of myosin II activity, it was essential to analyze disassembly of the rear network in isolation—in the absence of the continuous replenishment that occurs in a live forward-moving cell—and to exclude the action of cytosolic factors. Accordingly, we performed experiments using isolated cytoskeletons of Triton X-100–extracted keratocytes6. Strikingly, addition of ATP to the extracted cytoskeletons caused not only a rapid inward contraction at the cell rear, but also a concomitant dissolution of the actin network in that region (Fig. 4a, Supplementary Movie 4, Supplementary Fig. 6). The leading edge of the cell was not significantly affected by this process. The rear-dominant disassembly of actin (as well as contraction) was significantly suppressed (sometimes to undetectable levels) when cells were incubated with blebbistatin prior to the detergent extraction (Fig. 4b, Supplementary Movie 4, Supplementary Fig. 6). The ATP dependence, blebbistatin sensitivity, rear localization, and synchrony with contraction of the network disassembly are consistent with myosin II as the active agent, and recapitulation of this myosin II–dependent disassembly in extracted cells strongly suggests that soluble proteins are not required for this process.
Figure 4. Actin network disassembly in the rear of detergent-extracted keratocyte cytoskeletons is ATP-dependent and blebbistatin-sensitive, consistent with a direct role for myosin II in this process.

a–d, ATP triggers an acute loss of actin network in the rear region of the cell, where myosin II is localized (compare Fig. 1f). a, A detergent-extracted and phalloidin-labeled keratocyte cytoskeleton6. b, The same cytoskeleton 7 min after addition of 1 mM ATP. c, Overlay of initial frame (a, cyan) and frame at 7 min (b, yellow); regions with increase, decrease, or no change in net intensity appear yellow, cyan, or white, respectively. d, Time evolution of fluorescence intensities (normalized at t = 0) in the indicated regions. Time points for a mock buffer wash (chevron) and ATP addition (black arrowhead) are indicated. e–h, In a cell treated with 50 μM blebbistatin for 30 min prior to extraction, addition of ATP does not induce a loss of actin network. There is a slow loss of fluorescence due to photobleaching or background dissociation. i–l, The F-actin severing protein villin rapidly disassembles the lamellipodial actin network, demonstrating that this part of the cytoskeleton is not protected against a general disassembling activity. 0.1 μM GST-villin was added instead of ATP (arrow in l). m–t, Addition of GST-villin (arrows in p, t) in addition to ATP (arrowheads in p, t), in either order, results in complete, rapid disassembly of the actin network. Compare Supplementary Movie 4.
To test for the possibility that an unrelated mechanism was protecting the actin network in the front of the cell from disassembly, we treated extracted cytoskeletons with the gelsolin-family Ca2+-dependent actin severing protein villin17,18, in the absence of ATP. GST-villin solubilized F-actin in most regions of the cell, including the front (Fig. 4c, Supplementary Movie 4). Interestingly, however, a portion of the network in the rear was relatively insensitive to GST-villin. This region of the network, which lingered during prolonged villin treatment (Supplementary Movie 4), was reminiscent of the pattern of myosin II localization (Fig. 1f) and net actin network disassembly in intact cells (Fig. 1e) and complementary to the pattern of actin network stability after ATP treatment. Addition of both ATP and GST-villin, in either order, gave nearly complete destruction of the actin cytoskeleton (Fig. 4d, e; Supplementary Movie 4). Thus the rear-dominant pattern of ATP-dependent disassembly (Fig. 4a) is not due to other regions being impervious to disassembly per se; it likely reflects regions where myosin II is abundant and integrated into the actin network in a configuration that brings about maximal disassembling activity.
Our combined experimental observations point to a direct role for myosin II in actin network disassembly in motile fish keratocytes. A second, unidentified disassembly mechanism appears to act in parallel with myosin II in unperturbed cells. We found this pathway to be sensitive to jasplakinolide, and we conjecture that it may involve cofilin or gelsolin activity (Supplementary Note 1). Previous reports showing that F-actin disassembly increases upon stimulation of myosin II phosphorylation9 and that jasplakinolide selectively halts actin turnover in regions of cells lacking myosin II19 are consistent with these conclusions.
The observed spatial and temporal coincidence of contraction and disassembly (Fig. 1, 4; ref. 9) is most consistent with a simple mechanism for network disassembly by myosin II: mechanical breakage of actin filaments20. Such an effect could be assisted by the ability of the nonmuscle myosin II motor domain to stably bind actin filaments when under tension21, and may represent a common feature of myosin II function in all but the most specialized organization found in striated muscle.
The contribution of myosin II–driven network disassembly to whole-cell motility may vary in different cell types depending on the spatial arrangement of the cytoskeletal elements. In keratocytes, we find myosin II to be concentrated at the cell rear and to contribute to cell-scale network treadmilling; given the similar localization of myosin II to the rear in Dictyostelium22 and neutrophils23, we suggest that its role there may be very similar. In contrast, myosin II in neurons appears to be involved in network disassembly at the base of growth cones13. In fibroblasts and larger epithelial cells, the concentration of myosin II in the lamella (behind the lamellipodium) may primarily contribute to local network disassembly in the transition zone between the lamellipodial and lamellar networks19,24.
The involvement of myosin II in actin network disassembly motivates an appealing model for the long-range spatial and temporal coordination of disassembly in motile cells (Supplementary Fig. 1): slow incorporation of myosin II into the network and subsequent myosin II–mediated rearrangement of F-actin occur over the same time scale as whole cell translocation6, serving as a timing mechanism. Progressively assembled myosin II bipolar filaments gradually coalesce the initially dendritic actin network into a more parallel organization6 that permits efficient action of the myosin II motor, eventually leading to disassembly. The spatiotemporal organization of myosin II incorporation and actin network rearrangement takes place at a large enough scale to serve as a basis for cell-scale treadmilling of the actin cytoskeleton during steady-state motility in these cells.
Methods
Keratocyte cultures and labeling
We cultured keratocytes from the scales of the Central American cichlid Hypsophrys nicaraguensis as described in ref. 25. Keratocytes from this species exhibit less cell-to-cell variability than those of goldfish (Carassius auratus) and black tetra (Gymnocorymbus ternetzi). We used cells that had been cultured for 18–36 hours. Prior to microscopic observation, we treated the cells with 85% PBS containing 2.5 mM EGTA for ~5 min to break up sheets and obtain individually crawling cells. Only persistently polarized, fast-moving “coherent” cells were analyzed, as this subset of keratocytes maintain the most consistent shape and speed over time26.
F-actin and myosin II were labeled in live keratocytes as described25by small-volume electroporation on the coverslip. For F-actin speckle visualization, we introduced Alexa Fluor 546 phalloidin (Molecular Probes) into the cells at low density. Cells were allowed to recover for ~15 min in complete medium. For myosin II visualization, we transfected keratocytes26 with YFP-tagged Xenopus laevis nonmuscle myosin II regulatory light chain (a gift of Dr. A.F. Straight, Stanford University). Cells were allowed to recover for 18–24 hours before EGTA treatment.
Microscopy
We imaged cells at room temperature on a Nikon Diaphot-300 inverted microscope with a 60× (NA 1.4) objective. We acquired phase contrast and epifluorescence images at 2 s (live cell experiments) or 10 s (extracted cytoskeleton experiments) time intervals with a 16-bit 512 × 512 pixel cooled back-thinned CCD camera (Princeton Instruments). One pixel corresponded to 0.112 μm. All raw images displayed are single image frames, except for Fig. 1f, which is a median projection from a 90 s movie (45 frames). Alexa Fluor 546 phalloidin and TRITC-phalloidin were excited with a narrow band excitation TRITC filter cube (Chroma Technology) to minimize light absorption by blebbistatin, thereby limiting photoinactivation27 and phototoxicity28.
Flow tracking
We measured movement of the actin network using the adaptive multi-frame correlation algorithm with modifications described in ref. 25. We used a 5-frame (10 s) temporal window, and a correlation template size adaptively adjusted between a minimum of 11 × 11 pixels and a maximum of 21 × 21 pixels. This algorithm assumes quasi-stationary network movement within the area of the template and over the duration of the temporal window. Motile keratocytes moved so rapidly that over the 5-frame time window the requirement for stationarity could not be fulfilled. On the other hand, integration over five frames was necessary due to the relatively low signal-to-noise ratio of the FSM images. Therefore, we performed the F-actin flow tracking in the cell frame of reference, in which the actin meshwork movement was approximately constant over a local neighborhood in space and time. Speckle flow could then be tracked using the methods described in ref. 7. We removed isolated or grossly incoherent vectors from the raw flow data before resampling the flow field on a regular grid for visualization and further processing. We used the term “perpendicular flow” to denote the component of flow perpendicular to the direction of cell movement.
Frames of reference
In order to define the transformations between the lab and cell reference frames, as well as to calculate cell speeds, we tracked whole cell movement in the phase contrast image sequences using the two-stage cross-correlation approach8. This track of cell movement approximated as rigid motion (translation and rotation) was then used to convert image sequences from the laboratory frame of reference (in which they were acquired) to the cell frame of reference for flow tracking; and then to convert flow measurements from the cell frame of reference to the laboratory frame of reference.
Region analysis
As different cells had slightly different sizes and shapes, comparison or averaging of F-actin velocity fields among different cells was difficult. Instead of using the velocity fields directly, we divided them into a set of five standard regions (illustrated in Supplementary Fig. 4b) in each cell and averaged the measurements within each region at each time point. This yielded a set of time series which could further be averaged over time to summarize a cell’s steady-state actin network movement pattern as a set of five velocity vectors. The five regions we manually defined in each cell are: rear left (when facing the direction of movement), front left, front center, front right, and rear right. Inward perpendicular flow for a cell was computed by taking the average of the perpendicular flow in the rear left region and the negated perpendicular flow in the rear right region.
Assembly and disassembly maps
To estimate the spatial pattern of net assembly and disassembly of the actin network, we used an algorithm based on steady-state flow field and intensity. We applied spatial smoothing to the flow field (resampled per-pixel) and normalized the fluorescence image in each frame before computing the average over the length of the movie (30 s in Fig. 1e; 1 min in Fig. 2e). We then multiplied the average smoothed velocity field (v) by the average smoothed intensity (ρ) and calculated the divergence (▽·(ρv)) (similar to ref. 9) to obtain a steady-state assembly/disassembly map (see Supplementary Note 3 for further details).
Pharmacological treatments
We performed pharmacological treatments during observation of the cells on the microscope, such that we were able to observe the changes that occurred as the drug took effect. The coverslip was mounted in a chamber for live-cell imaging with 1 mL medium above the coverslip. The medium was exchanged with one containing the desired drug or drug combination. For myosin II inhibition we used 100 μM (±)-blebbistatin (a generous gift of Dr. A.F. Straight, Stanford University) or 50 μM (–)-blebbistatin (the active enantiomer; Toronto Research Chemicals). We refer to the concentration of the active enantiomer in the main text. To promote myosin II activity, we used 25 μM calyculin A (Upstate Biotechnology). The F-actin stabilizing drug jasplakinolide (Molecular Probes) was used at 1 μM and the actin monomer sequestering drug latrunculin A (Molecular Probes) was used at 5 nM.
Fluorescence labeling of fixed cells
To examine the effect of blebbistatin or jasplakinolide on F-actin distribution, we fixed keratocytes with 4% formaldehyde for 15 min following a 15 min treatment with blebbistatin or jasplakinolide. We permeabilized the cells with 0.5% Triton X-100 in PBS for 10 min, blocked with 3% BSA in PBS with 0.1% Triton X-100 for 10 min, and labeled with 3.5 nM TRITC-phalloidin for 15 min before observation.
F-actin accumulation analysis
The F-actin accumulation analysis required additional steps, because fluorescence levels between cells could vary not only due to F-actin amount, but also due to fixation variations, phalloidin labeling efficiency, and background fluorescence on the cover slip. We coarsely defined six regions in the phase-contrast image: front left, center, right, and rear left, center, right. To refine the regions, we manually segmented the cell interior by tracing its outline in the phase-contrast image. Note that this segmentation followed the overall contour of the cell without including any retraction fibers or “tails.” The final regions were then defined as the intersection of the coarse regions and the cell interior.
We defined an additional background region in the phalloidin fluorescence image, and subtracted the median value of that region from the entire phalloidin fluorescence image, clamping to zero. We then computed the relative F-actin amount in each region as the ratio of the median phalloidin fluorescence in the region to the median phalloidin fluorescence in the front center region. These ratios for the rear center region are shown in Fig. 3g.
The rear “tails” lie outside the cell interior traced as described above. We defined a minimum threshold for true fluorescence signal as the 1st percentile value of (background-subtracted) fluorescence intensity inside the cell interior. Pixel locations that were outside the cell interior, inside the coarsely defined rear left and rear right regions, and had (background-subtracted) values above the minimum threshold were classified as the rear “tail” regions. The ratios of their median phalloidin fluorescence to median front-center phalloidin fluorescence are shown in Fig. 3g.
Detergent-extracted cytoskeletons
To obtain Triton X-100–extracted keratocyte cytoskeletons, we cultured keratocytes on 22 × 40 mm coverslips. Following EGTA treatment, we attached the coverslips to microscope slides in orthogonal orientation to construct flow chambers containing the cells. Parafilm spacers were melted onto the slide at 80°C prior to chamber assembly to form a 10 mm wide channel. We used silicone grease to seal the chamber and to construct an approximately 3 × 3 mm inlet port, which allowed fluid (including surfactant-containing buffers) to gently flow through the chamber by gravity, minimizing disruption of the specimen. We treated keratocytes essentially as in ref. 6 while observing on the microscope. After quick rinses with Hank’s balanced salt solution (HBSS) and cytoskeleton buffer6 (CB; 50 mM imidazole, pH 7.4, 50 mM KCl, 0.5 mM MgCl2, 0.1 mM EDTA, 1 mM EGTA), we exposed the cells to extraction buffer (CB containing 1% Triton X-100, 4% polyethylene glycol, M.W. 40,000, and 0.2 μM TRITC-phalloidin) for ~30 s, then rinsed thoroughly with CB containing 0.2 μM TRITC-phalloidin and incubated for 5 min. Extraction buffer and all subsequent buffers added during the experiment contained an oxygen-scavenging system (2 mM DTT, 50 U/mL glucose oxidase (Sigma), 1500 U/mL catalase (Sigma), 50 mM d-glucose) to minimize photobleaching.
To test for actin network disassembly, we perfused the chamber with assay buffer20 (AB; 25 mM imidazole, pH 7.4, 25 mM KCl, 4 mM MgCl2, 0.2 mM CaCl2) and started time-lapse fluorescence imaging. Immediately after the indicated time points, we added AB or AB containing an ATP-regenerating system (1 mM ATP, 5 mM creatine phosphate (Sigma), 10 μg/mL creatine phosphokinase (Sigma)), 0.1 μM GST-villin (a gift of M.J. Footer, Stanford University), or both; the chamber was fully perfused by the new buffer before the next image acquisition occurred. To inhibit myosin II, we treated the cells with 50 μM blebbistatin prior to extraction for 30 min; in these experiments, every subsequently applied buffer contained 50 μM blebbistatin (or, in the control, the 0.1% DMSO vehicle).
For the experiments whose results are shown in Supplementary Fig. 6, imaging was performed through a 40x (NA 0.85) objective using a 16-bit 1024 × 1024 pixel cooled back-thinned CCD camera (Andor iXon+ DU-888).
Deformable substrates
We prepared gelatin-coated coverslips using a protocol derived from that of Doyle & Lee29. 200 μL of heated (40°C) 2.5% gelatin was added to each coverslip, then aspirated off, leaving a thin layer. Coverslips were cooled at 4°C for 24 hours. We then pipetted 0.5 mL media onto the gelatin and incubated at 4°C for 1 hour. Afterwards we placed a fish scale and 27 μL media atop the gelatin on each coverslip and incubated at room temperature overnight. Before transferring a coverslip to the microscope for imaging, we incubated it briefly in a suspension of streptavidin-conjugated quantum dots (Molecular Probes). The quantum dots stuck non-specifically to the surface of the gelatin, acting as fiducial marks to allow observation of substrate deformation. (Note that because the streptavidin-conjugated quantum dots stuck non-specifically, some stuck to the dorsal surface of the cells as well.)
Supplementary Material
Acknowledgments
We thank M.J. Footer for the gift of purified GST-villin, A. Mogilner and S. Sivaramakrishnan for thoughtful discussions and Z. Pincus, N. Dye, and T. Y.-C. Tsai for critical reading of the manuscript. C.A.W. and J.A.T. were supported by NIH grant R01AI067712 (J.A.T.). M.A.T. and E.L.B. were supported by NIH grant T32GM007276. G.M.A. was supported by the Stanford Medical Scientist Training Program. P.T.Y. was supported by an HHMI Predoctoral Fellowship, Stanford Graduate Fellowship, and a Skye International Foundation Scholarship. K.T.A. was supported by a National Science Foundation Graduate Research Fellowship. K.K. was a Damon Runyon Fellow supported by the Damon Runyon Cancer Research Foundation (DRG-#1854-05). K.T.A., L.J. and G.D. were supported by NIH grant U54GM64346 and U01GM67230 (G.D.). J.A.T. was supported by the Howard Hughes Medical Institute.
Footnotes
Author contributions C.A.W., M.A.T., and J.A.T. conceived and designed the experiments. C.A.W. and P.T.Y. performed FSM on untreated motile keratocytes. C.A.W. performed the pharmacological manipulation experiments, FSM observation, and the analysis. L.J. and G.D. developed the flow tracking algorithm specific to the needs of this analysis. C.A.W. and P.T.Y. developed methods and software to integrate the flow tracking algorithm with these experiments and analysis. K.T.A., C.A.W., and G.D. developed algorithms for the F-actin turnover analysis. E.L.B. imaged myosin II localization. G.M.A., K.K., and E.L.B. collected the cell speed data and observed fixed cells under the different treatments; G.M.A. and C.A.W. analyzed these data. M.A.T. performed experiments on detergent-extracted cytoskeletons and analyzed the results. M.A.T., C.A.W., and J.A.T. wrote the paper. All authors discussed the results and commented on the manuscript.
Supplementary Information is linked to the online version of the paper at www.nature.com/nature.
References
- 1.Abercrombie M. The Croonian lecture, 1978: the crawling movement of metazoan cells. Proc R Soc Lond B Biol Sci. 1980;207:129–47. [Google Scholar]
- 2.Theriot JA, Mitchison TJ. Actin microfilament dynamics in locomoting cells. Nature. 1991;352:126–31. doi: 10.1038/352126a0. [DOI] [PubMed] [Google Scholar]
- 3.Pollard TD, Borisy GG. Cellular motility driven by assembly and disassembly of actin filaments. Cell. 2003;112:453–65. doi: 10.1016/s0092-8674(03)00120-x. [DOI] [PubMed] [Google Scholar]
- 4.Euteneuer U, Schliwa M. Persistent, directional motility of cells and cytoplasmic fragments in the absence of microtubules. Nature. 1984;310:58–61. doi: 10.1038/310058a0. [DOI] [PubMed] [Google Scholar]
- 5.Small JV, Herzog M, Häner M, Abei U. Visualization of actin filaments in keratocyte lamellipodia: negative staining compared with freeze-drying. J Struct Biol. 1994;113:135–41. doi: 10.1006/jsbi.1994.1043. [DOI] [PubMed] [Google Scholar]
- 6.Svitkina TM, Verkhovsky AB, McQuade KM, Borisy GG. Analysis of the actin-myosin II system in fish epidermal keratocytes: mechanism of cell body translocation. J Cell Biol. 1997;139:397–415. doi: 10.1083/jcb.139.2.397. [DOI] [PMC free article] [PubMed] [Google Scholar]
- 7.Ji L, Danuser G. Tracking quasi-stationary flow of weak fluorescent signals by adaptive multi-frame correlation. J Microsc. 2005;220:150–67. doi: 10.1111/j.1365-2818.2005.01522.x. [DOI] [PubMed] [Google Scholar]
- 8.Wilson CA, Theriot JA. A correlation-based approach to calculate rotation and translation of moving cells. IEEE Trans Image Process. 2006;15:1939–51. doi: 10.1109/tip.2006.873434. [DOI] [PubMed] [Google Scholar]
- 9.Vallotton P, Gupton SL, Waterman-Storer CM, Danuser G. Simultaneous mapping of filamentous actin flow and turnover in migrating cells by quantitative fluorescent speckle microscopy. Proc Natl Acad Sci U S A. 2004;101:9660–5. doi: 10.1073/pnas.0300552101. [DOI] [PMC free article] [PubMed] [Google Scholar]
- 10.Guha M, Zhou M, Wang Y-L. Cortical actin turnover during cytokinesis requires myosin II. Curr Biol. 2005;15:732–6. doi: 10.1016/j.cub.2005.03.042. [DOI] [PubMed] [Google Scholar]
- 11.Murthy K, Wadsworth P. Myosin-II-dependent localization and dynamics of F-actin during cytokinesis. Curr Biol. 2005;15:724–31. doi: 10.1016/j.cub.2005.02.055. [DOI] [PubMed] [Google Scholar]
- 12.Sai X, Ladher RK. FGF signaling regulates cytoskeletal remodeling during epithelial morphogenesis. Curr Biol. 2008;18:976–81. doi: 10.1016/j.cub.2008.05.049. [DOI] [PubMed] [Google Scholar]
- 13.Medeiros NA, Burnette DT, Forscher P. Myosin II functions in actin-bundle turnover in neuronal growth cones. Nat Cell Biol. 2006;8:215–26. doi: 10.1038/ncb1367. [DOI] [PubMed] [Google Scholar]
- 14.Haviv L, Gillo D, Backouche F, Bernheim-Groswasser A. A cytoskeletal demolition worker: myosin II acts as an actin depolymerization agent. J Mol Biol. 2008;375:325–30. doi: 10.1016/j.jmb.2007.09.066. [DOI] [PubMed] [Google Scholar]
- 15.Straight AF, et al. Dissecting temporal and spatial control of cytokinesis with a myosin II inhibitor. Science. 2003;299:1743–7. doi: 10.1126/science.1081412. [DOI] [PubMed] [Google Scholar]
- 16.Bubb MR, Senderowicz AM, Sausville EA, Duncan KL, Korn ED. Jasplakinolide, a cytotoxic natural product, induces actin polymerization and competitively inhibits the binding of phalloidin to F-actin. J Biol Chem. 1994;269:14869–71. [PubMed] [Google Scholar]
- 17.Bretscher A, Weber K. Villin is a major protein of the microvillus cytoskeleton which binds both G and F actin in a calcium-dependent manner. Cell. 1980;20:839–47. doi: 10.1016/0092-8674(80)90330-x. [DOI] [PubMed] [Google Scholar]
- 18.Glenney JR, Jr, Kaulfus P, Weber K. F actin assembly modulated by villin: Ca++-dependent nucleation and capping of the barbed end. Cell. 1981;24:471–80. doi: 10.1016/0092-8674(81)90338-x. [DOI] [PubMed] [Google Scholar]
- 19.Ponti A, Machacek M, Gupton SL, Waterman-Storer CM, Danuser G. Two distinct actin networks drive the protrusion of migrating cells. Science. 2004;305:1782–6. doi: 10.1126/science.1100533. [DOI] [PubMed] [Google Scholar]
- 20.Kron SJ, Spudich JA. Fluorescent actin filaments move on myosin fixed to a glass surface. Proc Natl Acad Sci U S A. 1986;83:6272–6. doi: 10.1073/pnas.83.17.6272. [DOI] [PMC free article] [PubMed] [Google Scholar]
- 21.Kovács M, Thirumurugan K, Knight PJ, Sellers JR. Load-dependent mechanism of nonmuscle myosin 2. Proc Natl Acad Sci U S A. 2007;104:9994–9. doi: 10.1073/pnas.0701181104. [DOI] [PMC free article] [PubMed] [Google Scholar]
- 22.Yumura S, Mori H, Fukui Y. Localization of actin and myosin for the study of ameboid movement in Dictyostelium using improved immunofluorescence. J Cell Biol. 1984;99:894–9. doi: 10.1083/jcb.99.3.894. [DOI] [PMC free article] [PubMed] [Google Scholar]
- 23.Keller HU, Niggli V. Colchicine-induced stimulation of PMN motility related to cytoskeletal changes in actin, α-actinin, and myosin. Cell Motil Cytoskeleton. 1993;25:10–8. doi: 10.1002/cm.970250103. [DOI] [PubMed] [Google Scholar]
- 24.Vicente-Manzanares M, Zareno J, Whitmore L, Choi CK, Horwitz AF. Regulation of protrusion, adhesion dynamics, and polarity by myosins IIA and IIB in migrating cells. J Cell Biol. 2007;176:573–80. doi: 10.1083/jcb.200612043. [DOI] [PMC free article] [PubMed] [Google Scholar]
- 25.Yam PT, et al. Actin-myosin network reorganization breaks symmetry at the cell rear to spontaneously initiate polarized cell motility. J Cell Biol. 2007;178:1207–21. doi: 10.1083/jcb.200706012. [DOI] [PMC free article] [PubMed] [Google Scholar]
- 26.Lacayo CI, et al. Emergence of large-scale cell morphology and movement from local actin filament growth dynamics. PLoS Biol. 2007;5:e233. doi: 10.1371/journal.pbio.0050233. [DOI] [PMC free article] [PubMed] [Google Scholar]
- 27.Sakamoto T, Limouze J, Combs CA, Straight AF, Sellers JR. Blebbistatin, a myosin II inhibitor, is photoinactivated by blue light. Biochemistry. 2005;44:584–8. doi: 10.1021/bi0483357. [DOI] [PubMed] [Google Scholar]
- 28.Kolega J. Phototoxicity and photoinactivation of blebbistatin in UV and visible light. Biochem Biophys Res Commun. 2004;320:1020–5. doi: 10.1016/j.bbrc.2004.06.045. [DOI] [PubMed] [Google Scholar]
- 29.Doyle AD, Lee J. Cyclic changes in keratocyte speed and traction stress arise from Ca2+-dependent regulation of cell adhesiveness. J Cell Sci. 2005;118:369–79. doi: 10.1242/jcs.01590. [DOI] [PubMed] [Google Scholar]
Associated Data
This section collects any data citations, data availability statements, or supplementary materials included in this article.