

Abstract
Biopolymers composed of a pH-responsive, hydrophilic poly(methacrylic acid – grafted – ethylene glycol) (P(MAA-g-EG)) network polymerized in the presence of PMMA nanoparticles were designed for the oral delivery of chemotherapeutics for the treatment of colon cancer. An inulin-doxorubicin conjugate, designed to target the colon and improve doxorubicin efficacy, was loaded into these polymer carriers at an efficiency of 54%. Release studies indicated these polymer carriers minimized conjugate release in low pH conditions and released the conjugate at neutral pH conditions using a two – step pH experiment modeling the stomach and the small intestine. At lower concentration levels, the presence of the polymer carriers did not disrupt tight junctions as determined by transepithelial electrical resistance studies using Caco-2 and HT29-MTX cell lines which are an accurate model of the GI tract epithelia. Permeability values of unmodified doxorubicin and the inulin-doxorubicin conjugate in the presence of the polymer carriers were also determined using the same cell models and ranged from 1.87 – 3.80 × 10⁻⁶ cm/s.
Keywords: Chemotherapeutics, oral delivery, permeability, hydrogels, nanoparticles, controlled release
1. Introduction
Chemotherapy uses chemical structures designed to alter or manipulate DNA to cause disruption in the cell replication process and cell death. Chemotherapy is routinely administered systemically through an intravenous drip and is best used for metastatic cancers. However, for earlier stage cancers which have not metastasized, the use of chemotherapy is limited since cytotoxic effects on healthy tissues outweigh the benefit of using the cytotoxic drug to help eradicate any remaining cancer cells. Therefore, there is a need for new delivery methods and targeting chemotherapeutics which will be more convenient for the patient, reduce side effects to healthy tissues, and may be administered for earlier staged cancers.
New oral delivery methods for chemotherapeutics can be achieved by combining biopolymers which exhibit either pH-responsive or hydrophobic properties [1–7]. pH-Responsive biopolymers can use the pH shift from the stomach to the upper small intestine as a physiological trigger for releasing encapsulated chemotherapeutics while hydrophobic biopolymers can preferentially associate with the hydrophobic chemotherapeutics to improve loading efficiencies. Oral delivery of chemotherapeutics will give patients more power to control when and where they will receive their treatment and may reduce overall healthcare costs to the patient and to the medical community in general [8–10]. pH-Responsive hydrogels are a class of biopolymers that have been used for oral delivery of therapeutic agents [11–13] and commonly composed of methacrylic acid, N-isopropyl acrylamide, ethylene glycol dimethacrylate, 2-hydroxy methacrylate, poly(vinyl alcohol), or poly(n-vinyl pyrrolidone) [14–20].
By attaching unique chemical molecules directly to chemotherapeutics, a chemotherapeutic-conjugate can be developed that targets the tumor or tumor environment. For example, conjugates composed of long polysaccharide chains can be attached to chemotherapeutics for local degradation in the colon for the treatment of colon cancer. These same polysaccharide chains could also enhance the efficacy of the chemotherapeutic since sugars are regularly uptaken into cells due to the energy they provide for cellular function and specific sugar receptors found on the cell surface [21,22]. Guar gum, pectins, inulin, pullulan, and dextran are several polysaccharides routinely used in conjugation with dextran being the most widely used in the research community [23–25].
Synthesized polymer carriers and the development of chemotherapeutic conjugates must also be designed to either reside in the GI tract to directly treat tumors along the GI tract or transport across the GI tract epithelium into the bloodstream to treat other cancers such as in the lung, liver, or breast. The four pathways for transport across the GI tract epithelium include paracellular, passive diffusion, carrier-mediated, and transcytosis. The primary mechanism to enhance permeation is to loosen tight junctions between the epithelial cells and increase paracellular transport. Tight junctions are protein complexes (primarily composed of occluding and claudins) [26–27] formed between cells which are regulated by a host of intracellular and extracellular signaling. Due to rising costs in pharmaceutical research and final drug approval, the development of model systems which can mimic the characteristics of these tight junctions and assess paracellular transport has been established.
Transepithelial electrical resistance (TEER) measurements which monitor the electrical resistance between cell layers, are routinely used to determine when cell cultures have reached confluency, formed tight junctions, and if the cell layers are compromised when exposed to biological or non-biological substances [28–30]. TEER values can also be simultaneously measured during transport studies to help determine transport mechanisms of polymer systems and chemotherapeutic conjugates. Caco-2 cells are the most well established and widely used in vitro model for TEER studies [31,32]. Caco-2 cell monolayers differentiate into columnar absorptive cells, exhibit brush border, and form tight junctions similar to the small intestine epithelial layer [33] and when co-cultured with HT29-MTX goblet cells (mucosal secreting), develop monolayers with cellular properties more similar to native tissue including absorption and electrical resistance [34].
Previously, we have developed a pH-responsive hydrogel composed of poly(methacrylic acid – grafted – ethylene glycol) (P(MAA-g-EG)) dispersed with hydrophobic poly(methyl methacrylate) (PMMA) nanoparticles for the oral delivery of doxorubicin, a common chemotherapeutic, for the local, direct treatment of colon cancer[35]. We have also previously developed an inulin-doxorubicin conjugate for targeting doxorubicin to the colon and improving the efficacy of doxorubicin by enhancing cellular uptake [36]. Therefore we focused on the investigation of loading and releasing the inulin-doxorubicin conjugate using the P(MAA-g-EG) dispersed with PMMA nanoparticles in this paper.
P(MAA-g-EG) based polymer carriers have been used extensively in the past to not only deliver therapeutic agents to the upper small intestine, but also as a way to improve permeation across the GI tract for increased bioavailability [37–40]. It is proposed that the presence of the PMMA nanoparticles could reduce the permeation effect of P(MAA-g-EG) or determine a concentration level of microparticles that does not elicit permeation-enhancing effects. Thus, we are also presenting in this paper the transport properties of doxorubicin and the inulin-doxorubicin conjugate in the presence of the P(MAA-g-EG) and P(MAA-g-EG) containing nanoparticles. These values will then be compared to permeation values previously determined for doxorubicin and the inulin-doxorubicin conjugate with the presence of the P(MAA-g-EG) or P(MAA-g-EG) containing nanoparticles [36].
2. Materials and methods
Materials
Inulin from dahlia tubers, solid sodium hydroxide 20 – 40 mesh beads (NaOH), chloroacetic acid 99+% A.C.S. grade, phenolphthalein, phenol, Methacrylic acid (MAA), methyl methacrylate (MMA), tetraethylene glycol dimethacrylate (TEGDMA), 1-hydroxycyclohexyl phenyl ketone (Irgacure® 184), ammonium persulfate (APS), and dimethyl sulfoxide (DMSO) were purchased from Sigma – Aldrich (St. Louis, MO). Glacial acetic acid, anhydrous methanol, nitric acid, acetone, 1N hydrochloric acid, 10× phosphate buffer solution, sulfuric acid, and ethanol were purchased from Fisher Scientific (Fair Lawn, NJ). N-Hydroxysulfosuccinimide (sulfo-NHS) and 1-ethyl-3-(3-dimethylaminopropyl) carbodiimide (EDC) were from ThermoScientific (Rockford, IL). Poly(ethylene glycol) monomethyl ether monomethacrylate (PEGMMA; 1000 g/mol) was from Polysciences Inc. (Warrington, PA). Hanks’ Balanced Salt Solution was from SAFC Biosciences (Lenexa, Kansas). Doxorubicin was purchased from Selleck Chemicals (Houston, TX). Caco-2 cells were obtained from American Type Culture Collection (ATCC, Rockwell, MD) and HT29-MTX cells were a gift from Dr. Thecla Lesuffleur, INSERM, Paris, France. All chemicals were used as received except for MAA which was vacuum distilled at 54 °C and 25 mm Hg prior to use to remove the inhibitor hydroquinone. Double distilled water was used in all studies.
Synthesis of P(MAA-g-EG) hydrogels dispersed with PMMA
P(MAA-g-EG) hydrogels dispersed with PMMA nanoparticles were previously synthesized and discussed in detail [2]. Briefly, PMMA nanoparticles were formed by placing MMA, TEGDMA, and APS in water and reacting for 3 hr at 75 °C. The nanoparticles were then dialyzed and freeze dried. Then MAA, PEGMMA, TEGDMA, Irgacure® 184, and dry PMMA nanoparticles were dissolved in ethanol and water. The solution was sonicated, purged with N2, placed between glass slides, and exposed to UV light. The P(MAA-g-EG) film containing nanoparticles were purified and dried. P(MAA-g-EG) hydrogels dispersed with 5 wt% PMMA nanoparticles will be identified as P(MAA-g-EG)-5.0NP henceforth.
Synthesis of inulin-doxorubicin conjugate
An inulin-doxorubicin conjugate was previously synthesized and discussed in detail [36]. Briefly, inulin, chloroacetic acid, sodium hydroxide, and water were added in a round bottom flask and reacted for 2 hr at 60 °C to form carboxylated inulin [41]. The carboxylated inulin was recovered by precipitation in methanol, dried, and the degree of substitution determined by acidimetric titration. Then EDC, NHS, carboxylated inulin, and water were mixed for 1 hr, and then doxorubicin added and mixed for an additional 2 hr. The final product was dialyzed and freeze dried. The amount of inulin and doxorubicin was 0.926 mg and 0.462 μg per mg of inulin-doxorubicin conjugate, respectively.
Loading of inulin-doxorubicin conjugate P(MAA-g-EG) dispersed with PMMA nanoparticles
The inulin-doxorubicin conjugate was loaded by equilibrium partitioning in the following manner: a stock solution of inulin-doxorubicin conjugate was prepared in 1× PBS (pH 7.4) at a concentration of 0.25 mg/mL. A 5 mg/mL concentration of P(MAA-g-EG)-5.0NP (75 –150 μm) to inulin-doxorubicin conjugate stock solution was allowed to stir slowly for 2 hr. The inulin-doxorubicin conjugate loaded particles were filtered and rinsed with water to remove any surface absorbed doxorubicin. The UV/VIS spectrometer operating at a 485 nm excitation and 590 nm emission wavelengths, determined the concentration levels and calculated the loading efficiency as follows:
| (1) |
where Co is the initial inulin-doxorubicin conjugate concentration and Cf is the final inulin-doxorubicin conjugate concentration remaining in the solution.
Inulin-doxorubicin conjugate release from P(MAA-g-EG) dispersed with PMMA nanoparticles
Release experiments were performed on a rotary mixer (Glas-Col, Terre Haute, IN) operating at 15 rpm and placed in a 37 °C oven. A 1.5 mg sample of inulin-doxorubicin conjugate loaded P(MAA-g-EG)-5.0NP was added to 3 mL of 1× PBS (pH 2.0 or 7.4). For inulin-doxorubicin conjugate release in neutral pH, 1× PBS (pH 7.4) was used and over the duration of 6 hr, samples were taken and replaced to maintain sink conditions. Inulin-doxorubicin conjugate release in low pH was conducted in the same manner as neutral pH except 1× PBS was adjusted to a pH of 2.0 using 1N HCl.
A two-step pH change from low pH (2.0) to high pH (7.0) was used to model the physiological conditions and residence time of the stomach and small intestine [42, 43]. Inulin-doxorubicin conjugate loaded microparticles were first placed in 1× PBS at pH 2.0. After 90 min, 5N NaOH was added to increase the pH to 7.0 where release continued for 6 hr. Samples were obtained as above. The mass of inulin-doxorubicin conjugate released was determined by the fluorescent plate reader and reported as follows:
| (2) |
where Mt is mass released at a given time and M8 is total mass released.
Caco-2 and HT29-MTX Transwell® co-culture
All experiments used co-cultures of Caco-2 and HT29-MTX cells plated on 12 – well Costar Transwell® plates (Corning, Corning, NY) with a 0.4 μm porous membrane. Caco-2 and HT29-MTX cells were grown in Dulbecco’s Modified Eagle’s Medium (Sigma-Aldrich) in separate T-75 flasks in 5% CO2 and thermostated to 37 °C. After subculturing, cells were counted and mixed together in a 1:1 ratio before seeding onto the Transwell® plate at a density of 1.0 × 10⁵ cells/cm2 and cultured for 21 – 24 days with media replaced every other day.
Transepithelial electrical resistance (TEER) studies
Through tight junctions, epithelial cells form a sealed layer of cells which separate the apical and basolateral side of the GI tract lumen. This separation develops a polarity above and below the epithelial cell layer and can be correlated to transepithelial electrical resistance (TEER) measurements which monitor the electrical resistance between cell layers. A chopstick electrode is often used in combination with specialized cell culture dishes (Transwell®) which allow cells to grow on a porous surface with cell media above and below the cell layer. Using a chopstick electrode, the TEER values can be determine by placing one tip of the electrode in the basolateral side and the other electrode in the apical side.
TEER measurements were taken every other day and monitored the development of tight junction in the Transwell® cultures. TEER measurements were taken using a chopstick electrode and an EVOM epithelial volt-ohm meter (World Precision Instruments, Sarasota, FL). Resistance of the cell monolayer, Rcell, was computed using equation 3:
| (3) |
where Rt is the resistance at each time point and R0 is the resistance due to the membrane and media without cells. Rcell values were multiplied by the growth area (1 cm2) of the Transwell® to report TEER values as a unit area resistance and allowing comparison to other experiments which utilized different size Transwell® plates.
TEER experiments using P(MAA-g-EG) and P(MAA-g-EG)-5.0NP microparticles (75 –150 μm) of different concentrations were conducted in order to determine the effect of the microparticles on tight junctions. 12 – well Transwell® plates were used with co-cultures of Caco-2 and HT29-MTX cells grown for 21 – 24 days or until TEER values reached constant values. The cell media was removed, the cells rinsed with HBSS three times, and finally incubated in HBSS for 1 hr. The apical HBSS was then removed and replaced with 5 mg/mL or 20 mg/mL of P(MAA-g-EG) or P(MAA-g-EG)-5.0NP microparticles in HBSS which were pre-swollen for 24 hr and pre-warmed to 37 °C. Control cells contained HBSS without microparticles. TEER values were monitored every 15 min for 3 hr. All measurements were completed on Transwell® plates placed on a heating mat to maintain a temperature of 37 °C.
Unmodified doxorubicin and inulin-doxorubicin conjugate transport studies
The transport properties of unmodified doxorubicin and the inulin-doxorubicin conjugate were previously determined without the presence of P(MAA-g-EG) or P(MAA-g-EG) containing nanoparticles [36]. This paper focuses on determining the effect that P(MAA-g-EG) and P(MAA-g-EG)-5.0NP microparticles (75 – 150 μm) will have on transport properties using the porous Transwell® plates. 12 – well Transwell® plate were seeded and prepped as discussed above. The apical HBSS was then removed and replaced with 5 mg/mL of P(MAA-g-EG) or P(MAA-g-EG)-5.0NP microparticles in HBSS plus 25 μg/mL of doxorubicin or inulin-doxorubicin conjugates in HBSS. Microparticles were pre-swollen for 24 hr.
After adding the doxorubicin or the conjugate plus microparticles, 100 μL samples were taken from each basolateral well at 0, 0.5, 1, 2, and 3 hr time points. Samples were replaced with 100 μL of HBSS warmed to 37°C to maintain sink conditions. Doxorubicin or conjugate transport across the cell monolayer was determined by UV/VIS spectrometry (Biotek Synergy-HT, Winooski, VT) operating at 485 nm excitation and 590 nm emission.
The apparent drug permeability coefficient, Papp, was calculated using equation 4:
| (4) |
Here dQ/dt is the steady-state flux of doxorubicin or inulin-doxorubicin conjugate across the cell monolayer. This value was calculated from the slope of doxorubicin or inulin-doxorubicin conjugate transported to the basolateral chamber versus time. C0 is the initial concentration of doxorubicin or inulin-doxorubicin (25 μg/mL) added to the apical chamber and term A is the surface area of the membrane (1 cm2).
3. Results and discussion
P(MAA-g-EG) hydrogels polymerized in the presence of PMMA nanoparticles were formed as amphiphilic polymer carriers for the oral delivery of chemotherapeutic agents. It was previously determined these materials were capable of loading and releasing doxorubicin [35]. and has now been extended to an inulin-doxorubicin conjugate. The inulin-doxorubicin conjugate may prove useful in new cancer treatments because it has enhanced the effectiveness of doxorubicin against various colon tumor cell models.
Loading of inulin-doxorubicin conjugate P(MAA-g-EG) dispersed with PMMA nanoparticles
The inulin-doxorubicin conjugate was loaded into P(MAA-g-EG)-5.0NP microparticles by equilibrium partitioning and the loading efficiency was determined to be 54 ± 2.0%. The weight percent loading, defined as the mg of inulin-doxorubicin conjugate per mg of P(MAA-g-EG)-5.0NP polymer, was 2.6%. These values are reduced as compared to the loading efficiency of unmodified doxorubicin in P(MAA-g-EG)-5.0NP which was 64 ± 1% and the weight percentage of 3.1%. [35]. The reduced loading efficiency is due to the physical increase in size due to the presence of inulin which prevents the inulin-doxorubicin conjugate to migrate and penetrate the smaller porous network of the swollen P(MAA-g-EG)-5.0NP polymer that unmodified doxorubicin can get to.
Inulin-doxorubicin conjugate release from P(MAA-g-EG) dispersed with PMMA nanoparticles
Inulin-doxorubicin conjugate loaded P(MAA-g-EG)-5.0NP particles slowly swelled and released their contents as indicated by the red tint of the solution. In neutral pH, maximum release occurred after 2 hr with over 90% of inulin-doxorubicin conjugate released from P(MAA-g-EG)-5.0NP (Figure 1) and was expected since the pH is greater than the pKa value of MAA allowing the polymer carrier to swell and release its contents quickly [44–47]
Figure 1. Inulin-doxorubicin conjugate release from P(MAA-g-EG)-5.0NP in neutral pH conditions.
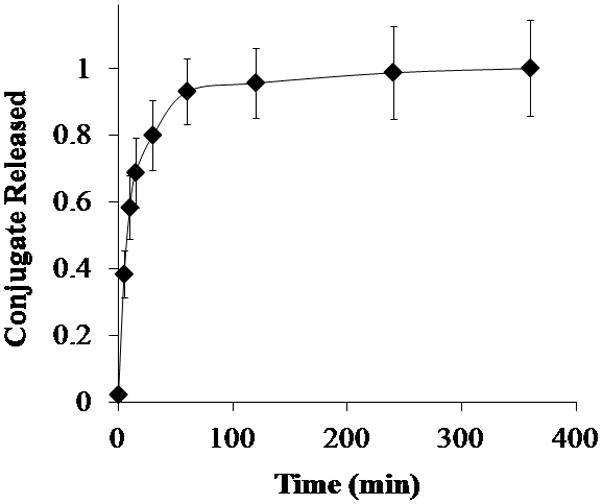
Inulin-doxorubicin conjugate loaded P(MAA-g-EG)-5.0NP (◆) crushed particles (75 – 150 μm) were released in 1× PBS (pH 7.4) for 6 hr. Doxorubicin release is expressed as Mt/M∞. Curves generated are n = 3 and error bars represent error propagation due to ratio of Mt/M∞.
The two – step pH experiment modeled the gastrointestinal pH conditions of the stomach and upper small intestine. P(MAA-g-EG)-5.0NP released approximately 23% of the inulin-doxorubicin conjugate in the low pH conditions (Figure 2). After the pH was increased from 2.0 to 7.0, the remaining amount of the inulin-doxorubicin conjugate loaded in the P(MAA-g-EG)-5.0NP polymer carrier was slowly released over 6 hr (Figure 2) with 98% released after 2 hr.
Figure 2. Inulin-doxorubicin conjugate release from P(MAA-g-EG)-5.0NP in two – step pH conditions.

Inulin-doxorubicin conjugate loaded P(MAA-g-EG)-5.0NP (◆) crushed particles (75 – 150 μm) were released in 1× PBS (pH 2.0) for 90 min. Then the pH was increased to 7.0 by adding 5 N NaOH and release continued for 6 hr. Inulin-doxorubicin conjugate release is expressed as Mt/M∞. Curves generated are n = 3 and error bars represent error propagation due to ratio of Mt/M∞.
Release studies were extended to 2 hr in low pH conditions to model longer residency times in the stomach. P(MAA-g-EG)-5.0NP released 27% of the inulin-doxorubicin conjugate after 2 hr in the low pH conditions (Figure 3). This is a small increase as compared to the 23% released at 1.5 hr in the low pH conditions of the two – step pH study. These values are still low and indicate that a majority of the encapsulated conjugate will be delivered to the upper small intestine.
Figure 3. Inulin-doxorubicin conjugate release of P(MAA-g-EG)-5.0NP in low pH conditions.

Inulin-doxorubicin conjugate loaded P(MAA-g-EG)-5.0NP (◆) crushed particles (75 – 150 μm) were released in 1× PBS (pH 2.0) for 2 hr to evaluate longer gastric transit times. Inulin-doxorubicin conjugate release is expressed as Mt/M∞. Curves generated are n = 3 and error bars represent error propagation due to ratio of Mt/M∞.
Transepithelial electrical resistance (TEER) studies
Co-culture of Caco-2 and HT29-MTX cells were grown on 12 – well Transwell® plates and their TEER measurements recorded for 21 – 24 days. Measured TEER values (350 – 450 Ω * cm2) were slightly higher than those previously published in our laboratory [47–50] and human small intestinal epithelia (50 – 100 Ω * cm2) [51, 52] Increased TEER values can be contributed to cell passage numbers, growth media, seeding density, and inherent variability due to the chopstick and EVOM volt-ohm meter.
The co-cultures were exposed to P(MAA-g-EG) and P(MAA-g-EG)-5.0NP microparticles (75 – 150 μm) at a concentration of 5 mg/mL and 20 mg/mL in HBSS for 3 hr. The 5 mg/mL concentration of microparticles experiment illustrated no significant drop in resistance across the monolayer as compared to the control wells (Figure 4). However, with the 20 mg/mL concentration level, a decrease in TEER values was observed as compared to the controls (Figure 5). Decrease in TEER values in the presence of P(MAA-g-EG) particles has been discussed by Madsen and Peppas [53] as well as Ichikawa and Peppas [29]. In each paper, P(MAA-g-EG) chelated Ca2+ in the apical side and caused an increase of Ca2+ flux from the basolateral to apical direction to maintain homeostasis. At low concentration levels (5 mg/mL), P(MAA-g-EG) and P(MAA-g-EG)-5.0NP may not chelate Ca2+ in amounts necessary to drive Ca2+ in the basolateral side to the apical side through the tight junctions. With the increased concentration (20 mg/mL) of P(MAA-g-EG) and P(MAA-g-EG)-5.0NP enough Ca2+ was chelated to drive Ca2+ flux through the opening of tight junctions. Since HT29-MTX were present in the cell culture, the development of a mucosal layer could have also influenced TEER values by increasing the distance between microparticles and the cell monolayer. With the 5 mg/mL, the mucus layer resisted microparticles penetration, but with 20 mg/mL the mucus layer could have been saturated with microparticles and failed to keep the polymer carriers away from the cell monolayer. There was no variability in TEER values between P(MAA-g-EG) and P(MAA-g-EG) containing nanoparticles indicating PMMA nanoparticles play no role in permeation enhancement or resistance.
Figure 4. Evaluation of TEER values on Caco-2 and HT29-MTX cell culture with 5 mg/mL of P(MAA-g-EG) or P(MAA-g-EG)-5.0NP microparticles present.

A co-culture of Caco-2 and HT29-MTX were plated on Transwell® plates and grown for 21 – 24 days. TEER measurements were recorded for 3 hr for co-cultures exposed to 5 mg/mL of P(MAA-g-EG) (
 ) or P(MAA-g-EG)-5.0NP (◆) microparticles and compared to co-cultures with no microparticles (○). n = 3 ± SD
Figure 5. Evaluation of TEER values on Caco-2 and HT29-MTX cell culture with 20 mg/mL of P(MAA-g-EG) or P(MAA-g-EG)-5.0NP microparticles present.

A co-culture of Caco-2 and HT29-MTX were plated on Transwell® plates and grown for 21 – 24 days. TEER measurements were recorded for 3 hr for co-cultures exposed to 20 mg/mL of P(MAA-g-EG) (
) or P(MAA-g-EG)-5.0NP (◆) microparticles and compared to co-cultures with no microparticles (○). n = 3 ± SD
Unmodified doxorubicin and inulin-doxorubicin conjugate transport studies
Unmodified doxorubicin and conjugate transport studies were completed to determine the transport properties with the presence of microparticles. 12 – well Transwell® plates containing the co-culture of Caco-2 and HT29-MTX cell lines were exposed to 5 mg/mL of P(MAA-g-EG)or P(MAA-g-EG)-5.0NP in HBSS plus 25 μg/mL of unmodified doxorubicin or the conjugate for 3 hr.
The analysis of transport of unmodified doxorubicin or the inulin-doxorubicin conjugate was based on calculations using equation 3 to determine the apparent permeability, Papp. The apparent permeability of unmodified doxorubicin with and without P(MAA-g-EG) or P(MAA-g-EG)-5.0NP microparticles is shown in Table 1. Unmodified doxorubicin permeability (4.5 × 10⁻⁶ cm/s) was calculated as slightly higher than P(MAA-g-EG) (3.8 × 10⁻⁶ cm/s) and P(MAA-g-EG)-5.0NP (3.26 × 10⁻⁶ cm/s), but was not significant (Figure 6).
Table 1.
Apparent permeability of unmodified doxorubicin or inulin-doxorubicin conjugate mixed with P(MAA-g-EG) or P(MAA-g-EG)-5.0NP microparticles (75 – 150μm) across Caco-2 and HT29-MTX cell monolayers.
| Therapeutic Agent | Apparent Permeability, Papp (× 10−6 cm/s) in the presence of | ||
|---|---|---|---|
| No Polymer | P(MAA-g-EG) | P(MAA-g-EG)-5.0NP | |
| Unmodified Doxorubicin | 4.53 [36] | 3.80 | 3.26 |
| Inulin-Doxorubicin Conjugate | 2.67 [36] | 1.93 | 1.87 |
Figure 6. Doxorubicin transport across Caco-2 and HT29-MTX cell culture with and without 5 mg/mL of P(MAA-g-EG) or P(MAA-g-EG)-5.0NP.

A co-culture of Caco-2 and HT29-MTX were plated on Transwell® plates and grown for 21 – 24 days. Cells were incubated with 5 mg/mL P(MAA-g-EG) (
) or P(MAA-g-EG)-5.0NP (◆) microparticles plus 25 μg/mL of unmodified doxorubicin. Transport properties of unmodified doxorubicin (○) was previously completed and added to these graphs for comparative purposes [36]. n = 4 – 6 ± SD
TEER values were also monitored during the experiment and demonstrated no decrease in value as compared to the control cells. Since TEER values were unchanged, the tight junctions were not compromised and permeability of unmodified doxorubicin primarily occurred transcellularly. It is not surprising that the tight junctions were not opened due to the presence of microparticles because it was demonstrated that concentrations of 5 mg/mL of microparticles did not decrease TEER values (Figure 4). The small decrease in permeability values in the presence of microparticles could be due to the microparticles absorbing a small amount of doxorubicin into its polymer structure and thus reducing the doxorubicin concentration present in the apical side of the Transwell®.
The apparent permeability of the conjugate and the conjugate in the presence of P(MAA-g-EG) or P(MAA-g-EG)-5.0NP is shown in Table 2 and demonstrated similar trends seen with unmodified doxorubicin. The conjugate’s permeability (2.6 × 10⁻⁶ cm/s) was calculated as slightly higher than with P(MAA-g-EG) (1.9 × 10⁻⁶ cm/s) and P(MAA-g-EG)-5.0NP (1.8 × 10⁻⁶ cm/s), but was not significant (Figure 7). Again TEER values were monitored and demonstrated no decrease in values as compared to control cells. Thus, tight junctions were not compromised and transport of the conjugate from the apical to basolateral side was primarily transcellular. Reduced permeability values of the conjugate in the presence of microparticles was due to the microparticles absorbing the conjugate into or on its polymer structure and thus reducing the conjugate concentration on the apical side of the Transwell®.
Figure 7. Inulin-doxorubicin conjugate transport across Caco-2 and HT29-MTX cell culture with and without 5 mg/mL of P(MAA-g-EG) or P(MAA-g-EG)-5.0NP.

A co-culture of Caco-2 and HT29-MTX were plated on Transwell® plates and grown for 21 – 24 days. Cells were incubated with 5 mg/mL P(MAA-g-EG) (
) or P(MAA-g-EG)-5.0NP (◆) microparticles plus 25 μg/mL of the inulin-doxorubicin conjugate. Transport properties of the inulin-doxorubicin conjugate (○) was previously completed and added to these graphs for comparative purposes [36]. n = 4 – 6 ± SD
Permeability values have been determined for doxorubicin using Caco-2 cell monolayers only and determined to be 2.8 × 10⁻⁵ cm/s or 2.9 × 10⁻⁵ cm/s in HBSS or with fasted state simulated intestinal fluids (FaSSIF), respectively [54]. Our permeability values are slightly lower than these and can be contributed to the mucus layer secreted by the HT29-MTX cells. Doxorubicin permeability values have also been determined for leukemia cells (7.4 × 10⁻⁵ cm/s), Ehrlich ascites tumor cells (2.4 × 10⁻⁵ cm/s), human red blood cells (2.4 × 10⁻⁷ cm/s), and Wistar rat hepatocyte membranes (10−6 cm/s) [55–58].
4. Conclusions
Amphiphilic polymers composed of pH-responsive P(MAA-g-EG) and hydrophobic PMMA nanoparticles has been synthesized and demonstrated their potential to load and release an inulin-doxorubicin conjugate. Overall, it appears that the size of the inulin-doxorubicin conjugate plays a leading role in its loading and release profiles as compared to unmodified doxorubicin. For loading, the smaller doxorubicin molecule can more easily penetrate smaller pores of the swollen P(MAA-g-EG)-5.0NP polymer carrier resulting in high loading levels (64%) [35] as compared to the conjugate (54%). However, due to its small nature, unmodified doxorubicin release in low pH conditions in both the two – step pH experiment (27%) and 2 hr low pH experiment (33%) [35] was higher than the inulin-doxorubicin conjugate (23% and 27%, respectively). The loading and release profiles of the inulin-doxorubicin conjugate from the P(MAA-g-EG)-5.0NP prove that this polymer drug carrier can be utilized to deliver colon targeted cancer drugs via the oral route.
P(MAA-g-EG) and P(MAA-g-EG)-5.0NP microparticles can serve as polymer carriers for colon drug delivery if their concentration is kept at or below 5 mg/mL. At 5 mg/mL, the microparticles do not cause TEER values to decrease and indicated that tight junctions remained closed which is favorable for local, direct delivery of chemotherapeutics to the colon. If tight junctions were compromised or open, unmodified doxorubicin or inulin-doxorubicin conjugate could significantly be transported across the GI tract into the bloodstream and reduce the amount necessary to achieve therapeutic effects against colon cancer. Concentrations of 20 mg/mL of P(MAA-g-EG) or P(MAA-g-EG)-5.0NP did decrease TEER values indicating the compromise of tight junctions.
Unmodified doxorubicin and inulin-doxorubicin conjugate permeability values were previously determined without the presence of microparticles [36] and now compared to permeability values with the presence of microparticles as completed in this paper. With the microparticles present, the permeability values were slightly decreased, but not significant and maybe due to the absorption of small amounts of doxorubicin or the conjugate into or on the polymer structure. Since the molecular weight of unmodified doxorubicin (543 g/mol) is smaller than the inulin-doxorubicin conjugate (~2000 – 2500 g/mol) the higher permeability values of unmodified doxorubicin is expected since it can more readily penetrate the mucosal layer.
Lastly, the measured Papp values for unmodified doxorubicin and the inulin-doxorubicin conjugate were on the order of 10−6 cm/s and were in the range of Papp values previously published using different human cells or cell models.
Acknowledgments
This research was supported by a grant from the NIH/NCI Center for Oncophysics (CTOPSOCU54-CA-143837). C.A.S. acknowledges the National Science Foundation for a Graduate Research Fellowship.
References
- 1.Schoener CA, Hutson HN, Fletcher GK, Peppas NA. Ind Eng Chem Res. 2011;50:12556. doi: 10.1021/ie201593h. [DOI] [PMC free article] [PubMed] [Google Scholar]
- 2.Schoener CA, Hutson HN, Peppas NA. Polym Int. 2012;61:874. doi: 10.1002/pi.4219. [DOI] [PMC free article] [PubMed] [Google Scholar]
- 3.Fisher OZ, Kim T, Dietz SR, Peppas NA. Pharm Res. 2009;26:51. doi: 10.1007/s11095-008-9704-2. [DOI] [PMC free article] [PubMed] [Google Scholar]
- 4.Owens DE, III, Jian Y, Fang JE, Slaughter BV, Chen YH, Peppas NA. Macromolecules. 2007;40:7306. [Google Scholar]
- 5.Sato K, Yoshida K, Takahashi S, Anzai J. Adv Drug Del Rev. 2011;63:809. doi: 10.1016/j.addr.2011.03.015. [DOI] [PubMed] [Google Scholar]
- 6.Huh KM, Kang HC, Lee YJ, Bae YH. Marcomol Res. 2012;20:224. [Google Scholar]
- 7.Tang Y, Heaysman CL, Willis S, Lewis AL. Expert Opin Drug Del. 2012;8:1141. doi: 10.1517/17425247.2011.588205. [DOI] [PubMed] [Google Scholar]
- 8.Liu G, Franssen E, Fitch MI, Warner E. J Clin Oncol. 1997;15:110. doi: 10.1200/JCO.1997.15.1.110. [DOI] [PubMed] [Google Scholar]
- 9.Irshad S, Maisey N. Eur J Cancer Care. 2010;19:5. [Google Scholar]
- 10.DeMario MD, Ratain MJ. J Clin Oncol. 1998;16:2557. doi: 10.1200/JCO.1998.16.7.2557. [DOI] [PubMed] [Google Scholar]
- 11.Peppas NA, Wood KM, Blanchette JO. Expert Opin Biol Ther. 2004;4:881. doi: 10.1517/14712598.4.6.881. [DOI] [PubMed] [Google Scholar]
- 12.Peppas NA, Bures P, Leobandung W, Ichikawa H. Eur J Pharm Biopharm. 2000;50:27. doi: 10.1016/s0939-6411(00)00090-4. [DOI] [PubMed] [Google Scholar]
- 13.Peppas NA, Hilt JZ, Khademhosseini A, Langer R. Adv Mater. 2006;18:1345. [Google Scholar]
- 14.Zhang J, Peppas NA. J Appl Polym Sci. 2001;82:1077. [Google Scholar]
- 15.Leobandung W, Ichikawa H, Fukumori Y, Peppas NA. J Controlled Release. 2002;80:357. doi: 10.1016/s0168-3659(02)00028-7. [DOI] [PubMed] [Google Scholar]
- 16.Bell CL, Peppas NA. Biomaterials. 1996;17:1203. doi: 10.1016/0142-9612(96)84941-6. [DOI] [PubMed] [Google Scholar]
- 17.Mundargi RC, Patil SA, Kulkarni PV, Mallikarjuna NN, Aminabhavi TM. J Microencapsulation. 2008;25:228. doi: 10.1080/02652040801896435. [DOI] [PubMed] [Google Scholar]
- 18.Peppas NA, Klier J. J Controlled Release. 1991;16:203. [Google Scholar]
- 19.Park SE, Nho YC, Lim YM, Kim HI. J Appl Polym Sci. 2003;91:636. [Google Scholar]
- 20.Peppas NA. In: Poly(2-hydroxy ethyl methacrylate) 2. Mark JE, editor. New York: Oxford University Press; 2009. [Google Scholar]
- 21.Papa V, Pezzino V, Costantino A, Belfiore A, Giuffrida D, Frittitta L, et al. J Clin Invest. 1990;86:1503. doi: 10.1172/JCI114868. [DOI] [PMC free article] [PubMed] [Google Scholar]
- 22.Frasca F, Pandini G, Scalia P, Sciacca L, Mineo R, Costantino A, et al. Mol Cell Biol. 1999;19:3278. doi: 10.1128/mcb.19.5.3278. [DOI] [PMC free article] [PubMed] [Google Scholar]
- 23.Chiu HC, Hsiue GH, Lee YP, Huang LW. J Biomater Sci, Polym Ed. 1999;10:591. doi: 10.1163/156856299x00504. [DOI] [PubMed] [Google Scholar]
- 24.Evans DF, Pye G, Bramley R, Clark AG, Dyson TJ, Hardcastle JD. Gut. 1988;29:1035. doi: 10.1136/gut.29.8.1035. [DOI] [PMC free article] [PubMed] [Google Scholar]
- 25.Chourasia MK, Jain SK. Drug Deliv. 2004;11:129. doi: 10.1080/10717540490280778. [DOI] [PubMed] [Google Scholar]
- 26.Tsukita S, Furuse M. Trends Cell Biol. 1999;9:268. doi: 10.1016/s0962-8924(99)01578-0. [DOI] [PubMed] [Google Scholar]
- 27.Fasano A, Nataro JP. Adv Drug Delivery Rev. 2004;56:795. doi: 10.1016/j.addr.2003.10.045. [DOI] [PubMed] [Google Scholar]
- 28.Foss AC, Peppas NA. Eur J Pharm Biopharm. 2004;57:447. doi: 10.1016/j.ejpb.2004.02.008. [DOI] [PubMed] [Google Scholar]
- 29.Ichikawa H, Peppas NA. J Biomed Mater Res, Part A. 2003;67A:609. doi: 10.1002/jbm.a.10128. [DOI] [PMC free article] [PubMed] [Google Scholar]
- 30.Blanchette J, Kavimandan N, Peppas NA. Biomed Pharmacother. 2004;58:142. doi: 10.1016/j.biopha.2004.01.006. [DOI] [PubMed] [Google Scholar]
- 31.Bast RC, Kufe DW, Pollock RE, Weichselbaum RR, Holland JF, Frei E. Cancer medicine. 5. Hamilton, ON: BC Decker; 2000. [Google Scholar]
- 32.Delie F, Rubas W. Crit Rev Ther Drug. 1997;14:221. [PubMed] [Google Scholar]
- 33.Behrens I, Kissel T. Eur J Pharm Sci. 2003;19:433. doi: 10.1016/s0928-0987(03)00146-5. [DOI] [PubMed] [Google Scholar]
- 34.Hilgendorf C, Spahn-Langguth H, Regårdh CG, Lipka E, Amidon GL, Langguth P. J Pharm Sci. 2000;89:63. doi: 10.1002/(SICI)1520-6017(200001)89:1<63::AID-JPS7>3.0.CO;2-6. [DOI] [PubMed] [Google Scholar]
- 35.Schoener CA, Hutson HN, Peppas NA. J Biomed Mater Res, Part A. 2012. submitted for publication. [DOI] [PMC free article] [PubMed] [Google Scholar]
- 36.Schoener CA, Carillo-Conde B, Peppas NA. J Drug Deliv Sci Tech. 2012 doi: 10.1016/s1773-2247(13)50018-9. submitted for publication. [DOI] [PMC free article] [PubMed] [Google Scholar]
- 37.Torres-Lugo M, García M, Record R, Peppas NA. Biotechnol Prog. 2002;18:612. doi: 10.1021/bp0101379. [DOI] [PMC free article] [PubMed] [Google Scholar]
- 38.Lopez JE, Peppas NA. J Biomater Sci, Polym Ed. 2004;15:385. doi: 10.1163/156856204323005262. [DOI] [PubMed] [Google Scholar]
- 39.Torres-Lugo M, Garcia M, Record R, Peppas NA. J Controlled Release. 2002;80:197. doi: 10.1016/s0168-3659(02)00027-5. [DOI] [PubMed] [Google Scholar]
- 40.Goto T, Morishita M, Kavimandan N, Takayama K, Peppas NA. J Pharm Sci. 2006;95:462. doi: 10.1002/jps.20566. [DOI] [PubMed] [Google Scholar]
- 41.Verraest DL, Peters JA, Batelaan JG, van Bekkum H. Carbohydr Res. 1995;271:101. doi: 10.1016/0008-6215(95)00028-r. [DOI] [PubMed] [Google Scholar]
- 42.Blanchette J, Peppas NA. Ann Biomed Eng. 2005;33:142. doi: 10.1007/s10439-005-8973-8. [DOI] [PubMed] [Google Scholar]
- 43.Wood KM, Stone GM, Peppas NA. Biomacromolecules. 2008;9:1293. doi: 10.1021/bm701274p. [DOI] [PMC free article] [PubMed] [Google Scholar]
- 44.Carr DA, Peppas NA. J Biomed Mater Res, Part A. 2010;92A:504. doi: 10.1002/jbm.a.32395. [DOI] [PMC free article] [PubMed] [Google Scholar]
- 45.Klier J, Scranton AB, Peppas NA. Macromolecules. 1990;23:4944. [Google Scholar]
- 46.Robinson DN, Peppas NA. Macromolecules. 2002;35:3668. [Google Scholar]
- 47.Sporn MB. Lancet. 1996;347:1377. doi: 10.1016/s0140-6736(96)91015-6. [DOI] [PubMed] [Google Scholar]
- 48.Phillips MR, Peppas NA. Trans Ann Biomater Meeting. 2009;33:267. [Google Scholar]
- 49.Howard DH, Kauh JK, Lipscomb J. Arch Intern Med. 2010;170:537. doi: 10.1001/archinternmed.2010.36. [DOI] [PubMed] [Google Scholar]
- 50.Gilman A. Am J Surg. 1963;105:574. doi: 10.1016/0002-9610(63)90232-0. [DOI] [PubMed] [Google Scholar]
- 51.Wardman P. Clinical Oncology. 2007;19:397. doi: 10.1016/j.clon.2007.03.010. [DOI] [PubMed] [Google Scholar]
- 52.McKinnell RG, Parchment RE, Perantoni AO, Damjanov I, Pierce GB. The biological basis of cancer. New York, NY: Cambridge University Press; 2006. [Google Scholar]
- 53.Madsen F, Peppas NA. Biomaterials. 1999;20:1701. doi: 10.1016/s0142-9612(99)00071-x. [DOI] [PubMed] [Google Scholar]
- 54.Rappeneau S, Baeza-Squiban A, Jeulin C, Marano F. Toxicological Science. 2000;54:212. doi: 10.1093/toxsci/54.1.212. [DOI] [PubMed] [Google Scholar]
- 55.Dalmark M, Storm HH. J Gen Physiol. 1981;78:349. doi: 10.1085/jgp.78.4.349. [DOI] [PMC free article] [PubMed] [Google Scholar]
- 56.Gottesman MM. Annu Rev Med. 2002;53:615. doi: 10.1146/annurev.med.53.082901.103929. [DOI] [PubMed] [Google Scholar]
- 57.Dordal MS, Winter JN, Atkinson AJ. J Pharmacol Exp Ther. 1992;263:762. [PubMed] [Google Scholar]
- 58.Seiwert TY, Salama JK, Vokes EE. Nat Clin Pract Oncol. 2007;4:86. doi: 10.1038/ncponc0750. [DOI] [PubMed] [Google Scholar]