

This study supports the notion that CT-derived pulmonary blood volume is a suitable surrogate for CT-derived pulmonary blood flow, providing a functional measure that may lead to new insights into disease processes not achievable by simply mapping the aftermath (parenchymal destruction and airway remodeling) of the pathologic process.
Abstract
Purpose:
To compare measurements of regional pulmonary perfused blood volume (PBV) and pulmonary blood flow (PBF) obtained with computed tomography (CT) in two pig models.
Materials and Methods:
The institutional animal care and use committee approved all animal studies. CT-derived PBF and PBV were determined in four anesthetized, mechanically ventilated, supine swine by using two methods for creating pulmonary parenchymal perfusion heterogeneity. Two animals were examined after sequentially moving a pulmonary arterial balloon catheter from a distal to a central location, and two others were examined over a range of static airway pressures, which varied the extents of regional PBF. Lung sections were divided into blocks and Pearson correlation coefficients calculated to compare matching regions between the two methods.
Results:
CT-derived PBF, CT-derived PBV, and their associated coefficients of variation (CV) were closely correlated on a region-by-region basis in both the balloon occlusion (Pearson R = 0.91 and 0.73 for animals 1 and 2, respectively; Pearson R = 0.98 and 0.87 for comparison of normalized mean and CV for animals 1 and 2, respectively) and lung inflation studies (Pearson R = 0.94 and 0.74 for animals 3 and 4, respectively; Pearson R = 0.94 and 0.69 for normalized mean and CV for animals 3 and 4, respectively). When accounting for region-based effects, correlations remained highly significant at the P < .001 level.
Conclusion:
CT-derived PBV heterogeneity is a suitable surrogate for CT-derived PBF heterogeneity.
©RSNA, 2012
Supplemental material: http://radiology.rsna.org/lookup/suppl/doi:10.1148/radiol.12112789/-/DC1
Introduction
Despite considerable successes with quantitative computed tomography (CT) and its adoption into numerous multicenter pharmaceutical and device trials, the assessment of the presence and distribution of emphysema and airway wall remodeling in chronic obstructive pulmonary disease may be missing crucial underlying differences more closely aligned with disease pathophysiology (1,2). It has recently been demonstrated (1) that a subset of smokers with very early CT-based evidence of susceptibility to centrilobular emphysema and normal findings at spirometry has increased regional heterogeneity of pulmonary blood flow (PBF) and mean transit time. These findings are consistent with the hypothesis that patchy, inflammation-based hypoxic pulmonary vasoconstriction is occurring in smokers susceptible to centrilobular emphysema, whereas the normal response to inflammation-associated hypoxia (local alveolar flooding) is to maintain regional perfusion (2,3). We strongly believe that an assessment of functional phenotypes such as PBF and mean transit time is crucial for the advancement of the understanding of the etiology of the disease and the development of new targeted therapies.
Implementation of the CT-derived PBF method, which necessitates placement of a central line for rapid high-pressure injection of radiologic contrast material during sequential cardiac-gated axial CT during a breath hold, is impractical for widespread implementation in multicenter studies. Recent developments in dual-source dual-energy CT offer the ability to image regional pulmonary perfused blood volume (PBV) by using a peripheral venous line and slow infusion of contrast material while spirally imaging the entire lung in a single short breath hold, a protocol similar to that used for assessment of pulmonary emboli (4–10).
The lung has a large capacity for dilation and recruitment of capillary beds because the entire blood volume passes through the pulmonary vascular bed while maintaining very low pressures relative to the systemic circulation (11). There is a close relationship between pulmonary perfusion and capillary recruitment (12). Thus, one would expect that there is a correlation between CT measures of regional perfused blood volume (PBV) and CT measures of pulmonary perfusion. As perfusion to a region increases, capillary beds would be expected to expand and new portions of the capillary bed may be recruited. Thus, simpler measures of pulmonary PBV, requiring only a single volume scan with dual-energy CT (13) to quantitate regional iodine concentrations, can serve as a surrogate for the dynamic imaging methods that have been used to date (1,14). We performed this study to compare measurements of regional PBV and PBF obtained with CT in two pig models.
Materials and Methods
Animal Preparation
The institutional animal care and use committee approved all animal studies reported herein. Four farm-bred swine (mean weight ± standard deviation, 32.7 kg ± 5.6; two males) were premedicated with intramuscular administration of ketamine (20 mg/kg) and xylazine (2 mg/kg) and anesthetized with 3%–5% isoflurane in oxygen by means of nose cone inhalation. Once surgical depth of anesthesia was achieved, a cuffed endotracheal tube with an inner diameter of 8.0 mm was placed through a tracheostomy and the animal was mechanically ventilated with 100% oxygen, a tidal volume of 10–14 mL/kg, and a rate of 10–20 per minute adjusted to achieve an end-tidal Pco2 of 30–40 mm Hg. Femoral arterial, femoral venous, and external jugular venous introducers were placed. A 7.0-F pigtail catheter was advanced into the right ventricle under hemodynamic and fluoroscopic control. A surgical plane of anesthesia was maintained with inhaled isoflurane (1%–5% in oxygen), and neuromuscular blockade was achieved with pancuronium (0.1 mg/kg intravenous initial dose and 0.5–1 mg/kg hourly as needed). Arterial pressure, oxygen saturation, and airway pressures were continuously monitored and recorded. Cardiac output was determined with a thermal-dilution technique.
CT Scanning
All CT scans were obtained with a second-generation dual-source unit (Somatom Definition Flash; Siemens Medical Systems, Erlangen, Germany). To determine PBF, axial (4-cm z-axis extent) electrocardiographically gated dynamic CT (80 kV, 150 mAs, 0.75-mm section thickness, 0.5-mm increments, 0.28-second rotation time, 25 time points, ∼4.2 mSv) was performed during continuous airway pressure breath holds after right ventricular injection of iodinated contrast material (0.5 mL/kg over 2 seconds; Isovue, 370 mg of iodine per milliliter, Bracco Diagnostics, Princeton NJ), as previously described (1,14,15). To determine PBV, spiral dual-energy CT (either 80 and 140 or 100 and 140 kV, 0.75-mm-thick sections, 0.5-mm increments, 0.55 pitch, ∼3.5 mSv) was performed during continuous airway pressure breath holds after an infusion of Isovue (4 mL/sec). A delay adequate for Isovue equilibration, approximately 15 seconds, was included before the initiation of the dual-energy scan in accordance with the standard pulmonary embolism scanning protocol (16).
The issue in using dual-energy CT and iodinated intravenous contrast material for assessing PBV is that there are three unknown independent variables per voxel (air, soft tissue and/or blood, and iodine) and only two measured linear attenuation coefficients per voxel. We solved this by using a generalized three-material mass fraction decomposition technique discussed elsewhere (17).
Perfusion Heterogeneity
Pulmonary perfusion was altered by using two methods chosen to facilitate the comparison of the two techniques over a variety of PBF values and induce a range of PBF heterogeneities. Two animals (animals 1 and 2) were examined after sequential occlusion with a balloon catheter placed in a pulmonary artery such that blood flow to progressively larger portions of lung parenchyma was occluded. In the other two animals (animals 3 and 4), the continuous airway inflation pressures were increased in 5 cm H2O increments, from 5 to 25 cm H2O, to obtain five different lung inflation levels for comparison. The acquisition of CT-derived PBF and PBV data sets was done as a coupled pair performed sequentially at each state, with a minimal (approximately 5 minutes) delay between scans necessary for animal recovery and contrast material washout. Thus, at each state, two CT scans were obtained in each animal, one to determine PBF and one to determine PBV. The balloon model incorporated four states (baseline, balloon 1, balloon 2, and balloon 3), resulting in eight scans, whereas the lung inflation model incorporated five states (5, 10, 15, 20, and 25 cm H20), resulting in 10 scans.
Image Analysis
Quantitative regional PBF was determined with the application of indicator dilution theory and first-pass kinetics to the four-dimensional electrocardiographically gated axial CT perfusion images (14,15). PBF was calculated by using the ratio of peak parenchymal attenuation enhancement to the area under the time-attenuation curve of a reference pulmonary artery by means of the time-series image analysis module of the Pulmonary Analysis Software Suite (Fig E1, online) (18). The voxel size for PBF imaging was 0.46 × 0.46 × 0.5 mm. The software performs a curve-fitting process on the mean intensity of a region of interest (ROI) over time. To reduce noise, a neighborhood-averaging filter was applied on each ROI such that the mean value from a 7 × 7-voxel region surrounding a voxel was used to represent the attenuation of the voxel for that time point. Regional perfusion values (in milliliters per minute per ROI) were normalized by total blood flow in the 4-cm section stack and presented as a percentage to allow for comparisons between conditions. PBV was calculated by using scanner-associated three-material decomposition software (Fig E2, online), which extracts the iodine attenuation and creates an image for the entire lung representing blood volume as discussed earlier. The voxel size for PBV imaging was 0.46 × 0.46 × 0.5 mm. Similar to CT-derived PBF, noise reduction for CT-derived PBV, performed by the scanner-associated software, was accomplished by calculating values with use of a 7 × 7-voxel neighborhood average to represent the attenuation of each voxel. Corresponding regions from the full lung PBV scans were isolated and extracted to match the axial 4-cm section stack obtained during PBF CT. Thresholding was used to exclude voxels outside of the −910 HU to −50 HU range. CT-derived PBF was thresholded by using a range of 0 to 0.25 mL/min, and CT-derived PBV was thresholded by using a range of 0 to 375 mL/min. Simple thresholding is confounded by a potential difference in contrast material distribution between PBF and PBV scans. CT-derived PBF uses the distribution over time of a short bolus of iodinated contrast material, whereas CT-derived PBV uses a continuous infusion until a plateau is reached. Scans acquired during PBF CT will have a variety of iodine profiles because the distribution of contrast material will vary with mean transit times for each location. Therefore, in addition to simple thresholding, a combination of semiautomated lung and vessel segmentation was used to restrict the areas of comparison to the lung parenchyma. Because catheters can occasionally cause variable, highly visible artifacts within the image, and because these artifacts may not be in the same place on both the PBF and PBV CT scans, these regions of distinct artifacts (largely at the lung apices) were manually selected and removed from analysis (M.K.F., with 7 years of experience). The lung boundaries were also eroded to further reduce edge artifacts. CT-derived PBV values were also normalized to represent a percentage of total attenuation in the 4-cm section stack. CT-derived PBF and PBV were compared on a regional basis by dividing the matching 4-cm section stacks into a 10 × 10 × 3 (x, y, z) grid of blocks. The volume of each block contained between 100 and 25 000 CT-derived PBF or PBV ROIs. Blocks that had a difference in ROI count between CT-derived PBF and PBV greater that 40% were also excluded. Normalized mean CT-derived PBF and PBV values, as well as the coefficients of variation (CVs) of normalized CT-derived PBF and PBV values, were compared by using the sectioned data. Pearson R and linear correlation coefficients were calculated for both comparisons. The analysis process is depicted in Figure 1.
Figure 1:

Flowchart of image acquisition and analysis process. The CT-derived PBV method (left column) employs dual-energy imaging in spiral scanning mode with a three-material decomposition process to extract iodine attenuation for full lung. The CT-derived PBF method (middle column) employs an axial scanning mode to perform time-series indicator dilution, resulting in a blood flow map for a 4-cm section stack of the lung near the heart. To compare CT-derived PBF and PBV, a matching 4-cm section stack is identified and extracted from the full-lung CT-derived PBV scan. Semiautomated lung segmentation along with vessel and airway segmentation is used to limit the analysis region to lung parenchyma (right column, second row). The 4-cm section stacks are then divided into a 10 × 10 × 3 grid of blocks and the mean and CV within each block calculated.
Results
Normalized color maps for CT-derived PBF and PBV obtained with the balloon occlusion and lung inflation models are shown in Figure 2. Figure 2a, which shows an example data set from the balloon occlusion model, demonstrates the decreased CT-derived PBF in the occluded region of the left lung and the increased area of this region when the balloon is repositioned to a more proximal location. CT-derived PBV and PBF color maps were visually equivalent. In Figure 2b, note the increasing extent of the nondependent low perfusion regions associated with lung inflation. The increased nondependent area of low perfusion associated with lung inflation is mirrored on the PBV maps.
Figure 2a:

Gray-scale, PBV, and PBF CT scans. (a) Color map comparison of CT-derived PBF and PBV from pig studied with balloon occlusion model. (b) Color map comparison of CT-derived PBF and PBV from pig studied at five different lung volumes, which were used to achieve a range of pulmonary perfusion values. Color coding is the same for each condition, with low values in blue and high values in red.
Figure 2b:

Gray-scale, PBV, and PBF CT scans. (a) Color map comparison of CT-derived PBF and PBV from pig studied with balloon occlusion model. (b) Color map comparison of CT-derived PBF and PBV from pig studied at five different lung volumes, which were used to achieve a range of pulmonary perfusion values. Color coding is the same for each condition, with low values in blue and high values in red.
As shown in Tables 1 and 2, the normalized PBF and the CV of the PBF were highly correlated with the normalized PBV and the CV of the PBV, respectively. For the balloon occlusion model, the Pearson R ranged from 0.91 to 0.99 in the comparison of normalized mean PBF with normalized mean PBV and from 0.78 to 0.98 in the comparison of the CV of normalized mean PBF with the CV of normalized mean PBV. All correlations were statistically significant (P < .001). The R2 for the linear correlation of normalized mean PBF and normalized mean PBV was 0.83 for the combined data in animal 1 (R2 = 0.91 for baseline, 0.87 for balloon 1, 0.86 for balloon 2, and 0.91 for balloon 3) (Fig 3, A) and 0.96 for the combined data in animal 2 (R2 = 0.96 for baseline, 0.97 for balloon 1, 0.96 for balloon 2, and 0.97 for balloon 3) (Fig 3, C). The R2 values for the linear correlation of the CV of normalized mean PBF and that of normalized mean PBV was 0.53 for the combined data in animal 1 (R2 = 0.59 for baseline, 0.26 for balloon 1, 0.55 for balloon 2, and 0.60 for balloon 3) (Fig 3, B) and 0.76 for the combined data in animal 2 (R2 = 0.57 for baseline, 0.52 for balloon 1, 0.86 for balloon 2, and 0.68 for balloon 3) (Fig 3, D). Table 2 demonstrates that, for the lung inflation model, the Pearson R ranged from 0.94 to 0.97 in the comparison of normalized mean PBF with normalized mean PBV and from 0.64 to 0.84 in the comparison of the CV of normalized mean PBF with that of normalized mean PBV. All correlations were statistically significant (P < .001). The R2 for the linear correlation of normalized mean PBF and normalized mean PBV was 0.88 for the combined data in animal 3 (R2 = 0.93 with positive end-expiratory pressure [PEEP] of 5 cm H2O, 0.93 with PEEP of 10 cm H2O, 0.89 with PEEP of 15 cm H2O, 0.90 with PEEP of 20 cm H2O, and 0.89 with PEEP of 25 cm H2O) (Fig 4, A) and 0.88 for the combined data in animal 4 (R2 = 0.90 with PEEP of 5 cm H2O, 0.93 with PEEP of 10 cm H2O, 0.93 with PEEP of 15 cm H2O, 0.92 with PEEP of 20 cm H2O, and 0.94 with PEEP of 25 cm H2O) (Fig 4, C). The R2 for the linear correlation of the CV of normalized mean PBF and that of normalized mean PBV was 0.54 for the combined data in animal 3 (R2 = 0.41 with PEEP of 5 cm H2O, 0.58 with PEEP of 10 cm H2O, 0.71 with PEEP of 15 cm H2O, 0.56 with PEEP of 20 cm H2O, and 0.60 with PEEP of 25 cm H2O) (Fig 4, B) and 0.51 for the combined data in animal 4 (R2 = 0.41 with PEEP of 5 cm H2O, 0.57 with PEEP of 10 cm H2O, 0.62 with PEEP of 15 cm H2O, 0.58 with PEEP of 20 cm H2O, and 0.46 with PEEP of 25 cm H2O) (Fig 4, D).
Table 1.
Balloon Occlusion Model: Comparison between Normalized Values and CVs of Normalized Values
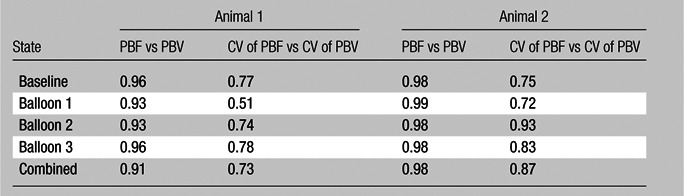
Note.—Data are Pearson R values. All values are statistically significant to the P < .001 level.
Table 2.
Lung Inflation Model: Comparison between Normalized Values and CVs of Normalized Values
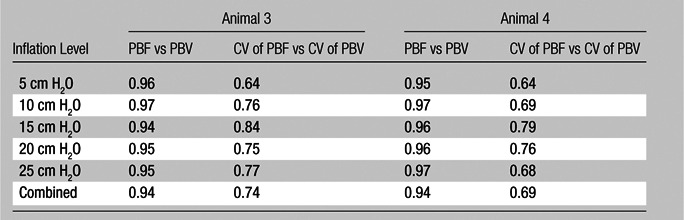
Note.—Data are Pearson R values. All values are statistically significant to the P < .001 level.
Figure 3a:

Comparison of normalized mean values and CVs of CT-derived PBF versus CT-derived PBV in two animals studied with balloon occlusion model, which was used to achieve a range of pulmonary perfusion values and heterogeneities. Values are percentages of summed total voxel values. (a, b) Normalized mean values for animals 1 and 2, respectively. (c, d) CVs of normalized values for animals 1 and 2, respectively.
Figure 4a:

Comparison of normalized mean values and CVs of CT-derived PBF versus CT-derived PBV in two animals studied with the lung inflation model, which was used to achieve a range of pulmonary perfusion values and heterogeneities. Values are percentages of summed total voxel values. (a, b) Normalized mean values for animals 3 and 4, respectively. (c, d) CVs of normalized values for animals 3 and 4, respectively.
Figure 3b:

Comparison of normalized mean values and CVs of CT-derived PBF versus CT-derived PBV in two animals studied with balloon occlusion model, which was used to achieve a range of pulmonary perfusion values and heterogeneities. Values are percentages of summed total voxel values. (a, b) Normalized mean values for animals 1 and 2, respectively. (c, d) CVs of normalized values for animals 1 and 2, respectively.
Figure 3c:

Comparison of normalized mean values and CVs of CT-derived PBF versus CT-derived PBV in two animals studied with balloon occlusion model, which was used to achieve a range of pulmonary perfusion values and heterogeneities. Values are percentages of summed total voxel values. (a, b) Normalized mean values for animals 1 and 2, respectively. (c, d) CVs of normalized values for animals 1 and 2, respectively.
Figure 3d:

Comparison of normalized mean values and CVs of CT-derived PBF versus CT-derived PBV in two animals studied with balloon occlusion model, which was used to achieve a range of pulmonary perfusion values and heterogeneities. Values are percentages of summed total voxel values. (a, b) Normalized mean values for animals 1 and 2, respectively. (c, d) CVs of normalized values for animals 1 and 2, respectively.
Figure 4b:

Comparison of normalized mean values and CVs of CT-derived PBF versus CT-derived PBV in two animals studied with the lung inflation model, which was used to achieve a range of pulmonary perfusion values and heterogeneities. Values are percentages of summed total voxel values. (a, b) Normalized mean values for animals 3 and 4, respectively. (c, d) CVs of normalized values for animals 3 and 4, respectively.
Figure 4c:

Comparison of normalized mean values and CVs of CT-derived PBF versus CT-derived PBV in two animals studied with the lung inflation model, which was used to achieve a range of pulmonary perfusion values and heterogeneities. Values are percentages of summed total voxel values. (a, b) Normalized mean values for animals 3 and 4, respectively. (c, d) CVs of normalized values for animals 3 and 4, respectively.
Figure 4d:

Comparison of normalized mean values and CVs of CT-derived PBF versus CT-derived PBV in two animals studied with the lung inflation model, which was used to achieve a range of pulmonary perfusion values and heterogeneities. Values are percentages of summed total voxel values. (a, b) Normalized mean values for animals 3 and 4, respectively. (c, d) CVs of normalized values for animals 3 and 4, respectively.
To address the possibility that the correlation between CT-derived PBF and PBV might simply reflect a persistent association in the regions studied, we performed additional statistical evaluations for the lung inflation model. This was not possible for the balloon occlusion model for two reasons: (a) The left lung was occluded in animal 1 and the right lung was occluded in animal 2, and (b) the balloon was placed along whatever peripheral path the catheter took at the time of insertion, with the goal of occluding a sublobar segment when the balloon was resting at its most distal location. The lung inflation model had no localized intervention effects and was simply associated with lung geometry. Therefore, we chose to use the inflation model for the test of region-based effects.
For each block within the 4-cm section stack, the mean value between both animals for the normalized means and CVs was calculated and then subtracted from animal 4. A second Pearson correlation analysis was then performed on the mean-corrected data from animal 4. For the normalized means, before correction, the Pearson R was 0.93 with use of 1011 regions. After correction, the Pearson R was 0.75 and remained statistically significant well below the P < .001 level. This correction suggests approximately a 31% region level effect. Although not small, the 31% region level effect yields an R2 (after adjustment) of 0.56, a value well above a standard error of 0.06 for a measurement containing 1011 regions. Following a similar correction for the CV, the Pearson R was 0.54, which is also significantly well below the P < .001 level. The CV correction suggests approximately a 25% region level effect. Although not small, the 25% region level effect yields an R2 (after adjustment) of 0.29, a value well above a standard error of 0.06 for a measurement containing 1011 regions.
Discussion
CT-derived PBV has been shown herein to be a good surrogate for CT-derived PBF heterogeneity, replacing the hard-to-implement CT PBF protocol in a clinical setting. A prerequisite for the CT-derived PBV method is the requirement of a dual-energy CT scanner. Dual-energy scanners are available from two of the major manufacturers and will likely be more widely available in the near future. An assumption of the CT-derived PBV method is that the PBV is uniformly enhanced. In this study, we used normal pigs of similar age and weight and used an injection and scanning protocol that had previously been proved to ensure good, uniform blood pool enhancement. To implement this study in a clinical setting, a protocol should incorporate a test injection to ensure that the timing and rate of infusion is adequate for blood volume enhancement. With experience, protocols may emerge that limit the need for such test injections.
Visual assessment of the PBF and PBV color maps showed that a strong relationship exists between these two methods for assessing regional pulmonary parenchymal perfusion. With progressive obstruction of pulmonary parenchymal perfusion, equivalent lobar boundaries become visible on both of the functional maps. A comparison of the CV of the two techniques showed a strong correlation, as seen by direct comparison and by examining the bivariate Pearson correlations. From this we can conclude that the CV of CT-derived PBV is a suitable surrogate for that of CT-derived PBF.
The main goal of this study was to determine whether CT-derived PBF and PBV correlate with each other in general, which we believe was clearly demonstrated in our results. That being said, CT-derived PBF and PBV were not 100% the same owing to differences in methodologic artifacts unique to each method. The major artifacts in both methods relate to measurement proximity to the heart, being either partial volume effects from cardiogenic motion or beam-hardening streaks related to a high concentration of contrast material and the presence of catheters in the heart. Ideally, we would simply avoid regions containing the heart; however, the CT-derived PBF method requires a reference ROI placed in a main pulmonary artery to perform properly and, with the axial sections acquired being only 4 cm long in the z-axis, the heart could not be avoided in this study.
With comparison of the normalized means, the steepness of the slope correlating CT-derived PBF and PBV increased at a certain level of the PBF. We believe that flow through the vessel can increase to a point beyond which there is no further room for capillary recruitment or vessel expansion. Thus, at the higher flow rates, CT-derived PBF was seen to increase while CT-derived PBV increased more slowly. When the two parts were combined it yielded an overall slope greater than 1. Linear regression plots for CV, conversely, had a slope very close to 1, indicating that the measurement error for each technique is likely unaffected by the flow limitation and clearly illustrating that the CV is not a duplication of mean PBF with a constant standard deviation but offers added information.
CT-derived PBV, in addition to providing a simpler protocol, reduces radiation exposure compared with CT-derived PBF protocols and enables assessment of the whole lung. Because the Siemens 128-section Flash CT scanner splits energy spectra between the two x-ray sources such that there is minimal overlap, dual-energy imaging is achieved with no additional radiation dose compared with single x-ray source scanners (19). The CT-derived PBV method also eliminates the need for central line placement because of the elimination of a high-pressure injection. In principle, dual-energy imaging allows the removal of the iodine signal from the images, creating a “virtual” unenhanced image data set that can provide the more traditional quantitative measures of the lung parenchyma and airway structure.
Although the CT-derived PBV method provides a simpler-to-perform surrogate for regional blood flow measurements from CT-derived PBF, it requires infusion timing such that contrast material concentration in the blood is at steady-state levels at imaging. CT technologists must ensure proper infusion and scanner timing to minimize the presence of scatter and beam-hardening artifacts. In addition, the continued delivery of contrast material via the distal axillary and subclavian veins near the first rib causes artifacts in the extreme apical extent of the lung. Improvements in reconstruction algorithms, along with novel iodinated blood pool contrast material, hold promise for artifact reduction and serve to further simplify the CT-derived PBV method in the future (20).
In summary, the results of this study support the notion that CT-derived PBV is a suitable surrogate for CT-derived PBF, providing a functional measure that may lead to new insights into disease processes not achievable by simply mapping the aftermath (parenchymal destruction and airway remodeling) of the pathologic process.
Advances in Knowledge.
• We demonstrate that relative values of pulmonary perfused blood volume (PBV), as assessed with dual-energy CT, can serve as a surrogate for true CT-based measures of regional pulmonary parenchymal perfusion (Pearson R for CT-derived pulmonary blood flow [PBF] vs CT-derived PBV = 0.91−0.98).
• By showing the similarity of the CT-derived pulmonary parenchymal perfusion (PBF) and CT-derived perfused PBV, we demonstrate the quantitative reliability of newly emerging dual-energy CT methodology (Pearson R for CT-derived PBF vs CT-derived PBV = 0.91–0.98; Pearson R for coefficient of variation of CT-derived PBF vs that of CT-derived PBV = 0.69−0.87)
Implications for Patient Care.
• Dual-energy CT pulmonary PBV heterogeneity, as a surrogate for CT-derived pulmonary parenchymal perfusion (PBF) heterogeneity provides for a simpler-to-implement procedure while maintaining quantitative similarity.
• CT-derived PBV avoids the need for a central high-pressure bolus of contrast material and allows for a single dual-energy spiral scan of the entire lung during a short duration breath hold as opposed to scanning a limited axial extent of the lung during a cardiac-gated scan.
Disclosures of Conflicts of Interest: M.K.F. No relevant conflicts of interest to disclose. A.E.H. No relevant conflicts of interest to disclose. S.E.H. No relevant conflicts of interest to disclose. A.A.D. No relevant conflicts of interest to disclose. J.G. Financial activities related to the present article: none to disclose. Financial activities not related to the present article: is a shareholder in VIDA Diagnostics. Other relationships: none to disclose. E.A.H. Financial activities related to the present article: none to disclose. Financial activities not related to the present article: is a founder of and shareholder in VIDA Diagnostics and Marvel Biosciences. Other relationships: none to disclose.
Supplementary Material
Acknowledgments
We thank Siemens Medical for their continued support, in particular our onsite research contact Andrew Primak, PhD. We also thank Jered P. Sieren, BA, RTR, John H. Morgan, BS, Krishna Iyer, BS, Olga Kravchuk, BA, and Elizabeth Allard, RTR, for their efforts during animal experiments and Kung-Sik Chan, PhD, for assistance with statistical analyses.
Received January 12, 2012; revision requested February 13; revision received May 25; accepted July 18; final version accepted August 14.
Funding: This research was supported by the National Institutes of Health (grant NIH RO1-HL-064368).
Abbreviations:
- CV
- coefficient of variation
- PBF
- pulmonary blood flow
- PBV
- perfused blood volume
- PEEP
- positive end-expiratory pressure
- ROI
- region of interest
References
- 1.Alford SK, van Beek EJ, McLennan G, Hoffman EA. Heterogeneity of pulmonary perfusion as a mechanistic image-based phenotype in emphysema susceptible smokers. Proc Natl Acad Sci U S A 2010;107(16):7485–7490 [DOI] [PMC free article] [PubMed] [Google Scholar]
- 2.Hoffman EA, Simon BA, McLennan G. State of the art: a structural and functional assessment of the lung via multidetector-row computed tomography—phenotyping chronic obstructive pulmonary disease. Proc Am Thorac Soc 2006;3(6):519–532 [DOI] [PMC free article] [PubMed] [Google Scholar]
- 3.Easley RB, Fuld MK, Fernandez-Bustamante A, Hoffman EA, Simon BA. Mechanism of hypoxemia in acute lung injury evaluated by multidetector-row CT. Acad Radiol 2006;13(7):916–921 [DOI] [PubMed] [Google Scholar]
- 4.Thieme SF, Hoegl S, Nikolaou K, et al. Pulmonary ventilation and perfusion imaging with dual-energy CT. Eur Radiol 2010;20(12):2882–2889 [DOI] [PubMed] [Google Scholar]
- 5.Thieme SF, Johnson TR, Reiser MF, Nikolaou K. Dual-energy lung perfusion computed tomography: a novel pulmonary functional imaging method. Semin Ultrasound CT MR 2010;31(4):301–308 [DOI] [PubMed] [Google Scholar]
- 6.Yuan R, Shuman WP, Earls JP, et al. Reduced iodine load at CT pulmonary angiography with dual-energy monochromatic imaging: comparison with standard CT pulmonary angiography—a prospective randomized trial. Radiology 2012;262(1):290–297 [DOI] [PubMed] [Google Scholar]
- 7.Lee CW, Seo JB, Song JW, et al. Evaluation of computer-aided detection and dual energy software in detection of peripheral pulmonary embolism on dual-energy pulmonary CT angiography. Eur Radiol 2011;21(1):54–62 [DOI] [PubMed] [Google Scholar]
- 8.Remy-Jardin M, Faivre JB, Pontana F, et al. Thoracic applications of dual energy. Radiol Clin North Am 2010;48(1):193–205 [DOI] [PubMed] [Google Scholar]
- 9.Ferda J, Ferdová E, Mírka H, et al. Pulmonary imaging using dual-energy CT, a role of the assessment of iodine and air distribution. Eur J Radiol 2011;77(2):287–293 [DOI] [PubMed] [Google Scholar]
- 10.Pontana F, Faivre JB, Remy-Jardin M, et al. Lung perfusion with dual-energy multidetector-row CT (MDCT): feasibility for the evaluation of acute pulmonary embolism in 117 consecutive patients. Acad Radiol 2008;15(12):1494–1504 [DOI] [PubMed] [Google Scholar]
- 11.Cournand A, Riley RL, et al. Pulmonary circulation and alveolar ventilation perfusion relationships after pneumonectomy. J Thorac Surg 1950;19(1):80–116 [PubMed] [Google Scholar]
- 12.Presson RG, Jr, Hanger CC, Godbey PS, Graham JA, Lloyd TC, Jr, Wagner WW., Jr Effect of increasing flow on distribution of pulmonary capillary transit times. J Appl Physiol 1994;76(4):1701–1711 [DOI] [PubMed] [Google Scholar]
- 13.Brown M, Abtin F, Kim HJ, McNitt-Gray M, Goldin JG. Imaging biomarkers for patient selection and treatment planning in emphysema. Imaging Med 2010;2(5):565–573 [Google Scholar]
- 14.Won C, Chon D, Tajik J, et al. CT-based assessment of regional pulmonary microvascular blood flow parameters. J Appl Physiol 2003;94(6):2483–2493 [DOI] [PubMed] [Google Scholar]
- 15.Chon D, Beck KC, Larsen RL, Shikata H, Hoffman EA. Regional pulmonary blood flow in dogs by 4D-x-ray CT. J Appl Physiol 2006;101(5):1451–1465 [DOI] [PubMed] [Google Scholar]
- 16.Henzler T, Meyer M, Reichert M, et al. Dual-energy CT angiography of the lungs: comparison of test bolus and bolus tracking techniques for the determination of scan delay. Eur J Radiol 2012;81(1):132–138 [DOI] [PubMed] [Google Scholar]
- 17.Liu X, Yu L, Primak AN, McCollough CH. Quantitative imaging of element composition and mass fraction using dual-energy CT: three-material decomposition. Med Phys 2009;36(5):1602–1609 [DOI] [PMC free article] [PubMed] [Google Scholar]
- 18.Guo J, Fuld M, Alford SK, Reinhardt JM, Hoffman EA. Pulmonary Analysis Software Suite 9.0: integrating quantitative measures of function with structural analyses. In: Brown M, de Bruijne M, van Ginneken B, et al., eds. Proceedings of the First International Workshop on Pulmonary Image Analysis, 2008; 283–292 [Google Scholar]
- 19.Schenzle JC, Sommer WH, Neumaier K, et al. Dual energy CT of the chest: how about the dose? Invest Radiol 2010;45(6):347–353 [DOI] [PubMed] [Google Scholar]
- 20.Kravchuk O, Halaweish A, Fuld M, Ghaghada K, Annapragada A, Hoffman EA. Validation of liposomal blood pool CT contrast agent in assessment of CT-derived perfused blood volume heterogeneity [abstr]. Am J Respir Crit Care Med 2011;183(Suppl 1):A5202 [Google Scholar]
Associated Data
This section collects any data citations, data availability statements, or supplementary materials included in this article.