

Significantly lower N-acetylaspartate (NAA)/creatinine and NAA/choline ratios in the precentral gyrus, midfrontal region, left caudate, occipital lobe, and other regions confirm that amyotrophic lateral sclerosis is a multisystem disorder of the entire brain and is not restricted to the motor cortex.
Abstract
Purpose:
To detect regional metabolic differences in amyotrophic lateral sclerosis (ALS) with whole-brain echo-planar spectroscopic imaging.
Materials and Methods:
Sixteen patients with ALS (nine men, seven women; mean age, 56.6 years), five persons suspected of having ALS (four men, one woman; mean age, 62.6 years), and 10 healthy control subjects (five men, five women; mean age, 56.1 years) underwent echo-planar spectroscopic imaging after providing informed consent. The study was approved by the institutional review board and complied with HIPAA. Data were analyzed with the Metabolic Imaging and Data Analysis System software, and processed metabolite maps were coregistered and normalized to a standard brain template. Metabolite maps of creatine (Cr), choline (Cho), and N-acetylaspartate (NAA) were segmented into 81 regions with Automated Anatomical Labeling software to measure metabolic changes throughout the brains of patients with ALS. Statistical analysis involved an unpaired, uncorrected, two-sided Student t test.
Results:
The NAA/Cho ratio across six regions was significantly lower by a mean of 23% (P ≤ .01) in patients with ALS than in control subjects. These regions included the caudate, lingual gyrus, supramarginal gyrus, and right and left superior and right inferior occipital lobes. The NAA/Cr ratio was significantly lower (P ≤ .01) in eight regions in the patient group, by a mean of 16%. These included the caudate, cuneus, frontal inferior operculum, Heschl gyrus, precentral gyrus, rolandic operculum, and superior and inferior occipital lobes. The Cho/Cr ratio did not significantly differ in any region between patient and control groups.
Conclusion:
Whole-brain echo-planar spectroscopic imaging permits detection of regional metabolic abnormalities in ALS, including not only the motor cortex but also several other regions implicated in ALS pathophysiologic findings.
© RSNA, 2013
Introduction
Amyotrophic lateral sclerosis (ALS) is a neurologic disorder characterized by progressive degeneration of upper motor neurons and lower motor neurons (1). ALS manifests as muscle paralysis and loss of voluntary motor control, progressively disrupting such functions as limb movement, speech, eating, and respiration. Increasing neurologic and pathologic evidence suggests that ALS is not an isolated motor neuron disorder but rather a multisystem disease with varying presentations and widespread extramotor involvement. Although electromyography depicts involvement of lower motor neurons, subjective neurologic examination remains the current standard for assessing involvement of upper motor neurons (2,3). Clinical assessment of dysfunction of the upper motor neurons can be confounded by the masking effect of lower motor neuron dysfunction. Sensitive and objective methods for earlier detection of involvement of upper motor neurons may help accelerate the time course of diagnosis and therapeutic intervention. Furthermore, because histopathologic abnormalities are widespread (4), detecting metabolic dysfunction throughout the brain could help better characterize this disease.
Magnetic resonance (MR) spectroscopy is among several advanced imaging modalities with the potential to help objectively evaluate the pathologic features of ALS (5–7). Previous MR spectroscopic studies of ALS found significant reductions in N-acetyl aspartate (NAA) and increases in choline (Cho) and creatine (Cr) or decreases in the NAA/Cho and NAA/Cr ratios, particularly in the motor cortex (8–10).
Most spectroscopic studies of ALS have focused on such regions as the motor cortex, where neuronal dysfunction is already suspected, because conventional single-voxel spectroscopy and two-dimensional chemical shift imaging (7–14) are limited in spatial coverage and relatively large individual voxels (15,16). Moreover, conventional phase encoding of both spatial dimensions in chemical shift imaging results in relatively long acquisition times and coverage typically restricted to a single section.
Three-dimensional echo-planar spectroscopic imaging facilitates high-resolution volumetric (multisection) studies (17) by using echo-planar readouts to accelerate spatial encoding. Recent evidence suggests that ALS is more diffuse than previously understood because more widespread brain dysfunction has been reported (18–20). Echo-planar spectroscopic imaging has demonstrated utility in detecting metabolic abnormalities in such regions as the basal ganglia, thalamus, and corticospinal tract of patients with ALS (21,22).
Because specific brain regions with metabolic abnormalities in ALS are unknown, we performed unbiased whole-brain analysis by coregistering metabolite maps to a segmented Montreal Neurological Institute template brain atlas. Data from patients with ALS were compared with those from age-matched healthy control subjects to detect brain regions that demonstrate MR spectroscopy–detectable abnormalities. The purpose of this study was to detect regional metabolic differences in ALS by using whole-brain echo-planar spectroscopic imaging.
Materials and Methods
Twenty-one patients (13 men, eight women; mean age ± standard deviation, 58.0 years ± 10.7 [range, 45–82 years]) were recruited from the Hospital of the University of Pennsylvania (Philadelphia, Pa) for this retrospective study, along with 10 age- and sex-matched healthy persons as control subjects (five men, five women; mean age, 56.1 years ± 4.3 [range, 49–62 years]). All subjects underwent echo-planar spectroscopic imaging after providing informed consent. Healthy persons had no family history of ALS and reported no known neurologic disease or symptoms. All studies were conducted between March 2009 and July 2011, were approved by the institutional review board at the University of Pennsylvania, and complied with the Health Insurance Portability and Accountability Act. Informed consent was obtained from all participants. Patients categorized as having clinically definite, clinically probable, and clinically possible ALS were included in the study. Patients only suspected of having ALS (n = 5) were excluded from the analysis. Exclusion criterion included contraindications to MR imaging (claustrophobia, pacemaker, metallic implants in the brain) and presence of any brain disease other than ALS.
Clinical diagnoses were made (L.B.E., L.F.M., or M.G., with 14, 24, and 27 years of experience, respectively), and patients underwent neurologic examination to evaluate disease severity according to the revised ALS Functional Rating Scale, or ALSFRS-R. This scale assesses impairment with scores ranging from zero, indicating total disability, to 48, indicating no disability. Pathologic or hyperactive reflexes or otherwise preserved reflexes in weak limbs, along with increased tone or spasticity, were all considered indicators of upper motor neuron dysfunction in patients (23). Patients with ALS were each classified as having clinically definite (n = 5), clinically probable (n = 6), clinically possible (n = 5), and clinically suspected (n = 5) ALS according to the El Escorial World Federation of Neurology criteria (24). As noted, the last group was excluded from the analysis. The remaining participants classified as having clinically definite, clinically probable, and clinically possible ALS were grouped together (n = 16), and their data were then compared statistically with those of control subjects (n = 10).
Data Acquisition
Studies were performed by one author (S.C., with 10 years of experience) using a 3.0-T imager (Siemens Healthcare; Erlangen, Germany) that featured a 12-channel phased-array head coil. The protocol for echo-planar spectroscopic imaging consisted of a localizer, an axial three-dimensional T1-weighted magnetization-prepared rapid acquisition gradient-echo (GRE) sequence (repetition time msec/echo time msec/inversion time msec, 1620/3.9/192; flip angle, 15°; number of sections, 192; spatial array, 256 × 256; section thickness, 1.0 mm; voxel size, 1.0 × 1.0 × 1.0 mm3), and axial proton density-weighted images (repetition time msec/echo time msec, 4100/13; number of signals acquired, one; number of sections, 40; section thickness, 3.0 mm; bandwidth, 130 Hz; flip angle, 120°). Magnetization-prepared rapid acquisition GRE images were used for planning echo-planar spectroscopic imaging sections and in postprocessing for image coregistration.
Imaging parameters for the volumetric spin-echo echo-planar spectroscopic imaging sequence were as follows: 1710/70; spatial array, 50 × 50 × 18 over a field of view of 280 × 280 × 180 mm3 (corresponding to a nominal voxel size of 5.6 × 5.6 × 10 mm3 [0.31 cm3]); flip angle, 73°; number of complex points, 512; bandwidth, 613 Hz; and number of signals acquired, one. Water suppression with frequency-selective saturation pulses and inversion-recovery nulling of lipid signal was performed with an inversion time of 198 milliseconds (25). The echo-planar spectroscopic imaging sequence took 26 minutes in total, including an interleaved water reference acquisition image, obtained by using a GRE acquisition with a 20° flip angle and an echo time of 6.3 milliseconds. This water-unsuppressed image obtained before imaging was used to normalize signals and correct for eddy currents. This short single-average water image obtained before imaging was also used to coregister images. Manual shimming was performed to achieve optimal full width at half maximum of less than 20 Hz (magnitude spectrum). Data from T1-weighted imaging and echo-planar spectroscopic imaging were acquired with the same angulation (approximately 15°–20°) and were aligned along the anterior commissure–posterior commissure line.
Data Analysis
Data processing was performed off-line by two authors (S.C. and S.W., with 10 and 7 years of experience, respectively) by using the Metabolic Imaging and Data Analysis System, or MIDAS, software package developed by Maudsley et al (26). MIDAS allows the correction for inhomogeneity in the primary magnetic field, correction for eddy-current distortion, and interpolation of the acquired data to a final spatial resolution of 64 × 64 × 32. A Gaussian filter was applied for spatial smoothing, expanding the effective voxel size to 1 mL. The processing steps also included correction of frequency shifts caused by magnetic field strength inhomogeneity and k-space extrapolation to reduce ringing artifacts from subcutaneous lipids by using a mask of the scalp region derived from the T1-weighted images. Lipid masking was used to eliminate the voxels with the heaviest lipid contamination, but some voxels that contained both viable metabolite spectra and remnant lipids remained in the analysis. Baseline correction was applied to reduce the contribution from these lipids and residual water from metabolite measurements. Signal intensity of metabolite maps was normalized by using tissue water as an internal reference. Concentrations of NAA, Cr, and Cho, as well as their respective metabolic maps, were computed by using a prior knowledge–based fitting algorithm analogous to the LC Model algorithm reported earlier (27). A spatial map of water was also generated by using interleaved unsuppressed water spectroscopic imaging.
Metabolite maps of Cho, Cr, NAA, and unsuppressed water were co-regis-tered with T1-weighted magnetization-prepared rapid acquisition GRE images by one author (G.V., with 7 years of experience) using statistical parametric mapping (SPM5; University College London, London, England) (28). Axial magnetization-prepared rapid acquisition GRE images were coregistered with maps of unsuppressed water from echo-planar spectroscopic imaging data because water is considerably more concentrated than brain metabolites are (29,30). Once the water map was coregistered with the magnetization-prepared rapid acquisition GRE image, the offsets generated by this coregistration were applied to the metabolite maps. After registration, all images were normalized to a standard T1 template of statistical parametric mapping (SPM5).
Coregistration of metabolite maps with magnetization-prepared rapid acquisition GRE data facilitated regional analysis by using Automated Anatomical Labeling software (Cyceron, Caen, France) (31). This software used the Montreal Neurological Institute brain atlas to identify and segment the brain into separate regions of interest (ROIs). Eighty-one ROIs of varying size were selected; the ROIs covered the whole brain superior to the cerebellum. To minimize bias, no particular criteria were used for the ROIs except their presence in the brain at section levels superior to the cerebellum. Selecting an ROI that encompassed multiple voxels effectively summed the metabolite concentrations from several adjacent voxels. Relative concentrations of Cho, Cr, and NAA were calculated for each ROI, and NAA/Cho and NAA/Cr ratios were computed by using these summed concentrations in each segmented ROI. Statistical analyses for these measures were performed with unpaired, uncorrected, two-sided Student t tests on groups of patients with patients versus control subjects by two authors (G.V. and J.H.W., with 7 and 15 years of experience, respectively). Because in the statistical analysis numerous regions were compared, a conservative P value (P ≤ .01) was selected to establish a significant difference between patients with ALS and control subjects.
Results
Table 1 shows the NAA/Cho ratios from the six segmented ROIs where significant variation (P ≤ .01) was detected between patient and control groups (left caudate, right lingual lobe, right inferior occipital lobe, left and right superior occipital lobes, and left supramarginal gyrus). The mean NAA/Cho ratios across these six regions were 8.2 ± 2.2 in control subjects and 6.7 ± 1.4 in patients with ALS (23% lower in patients). Across all 81 segmented regions, the mean NAA/Cho ratios were 6.1 ± 1.9 in control subjects and 5.3 ± 2.3 in patients with ALS (13% lower in patients). The NAA/Cho ratios were also 14% and 15% lower in the right precentral gyrus (P = .012) and left precentral gyrus (P = .016) of the patient group, respectively, although the P values were above the threshold level used here to denote findings with a significant difference.
Table 1.
NAA/Cho Ratios in Patients with ALS and Control Subjects
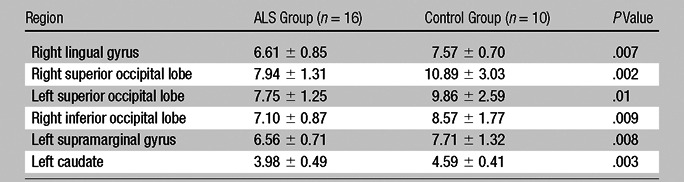
Note.—Data are NAA/Cho ratios from the six regions in which ratios significantly varied (P ≤ .01) between patient and control groups. Data are means ± standard deviations.
Table 2 shows the eight regions where the NAA/Cr ratio significantly differed between patient and control groups (P ≤ .01). These were the left caudate, right cuneus, left frontal inferior operculum, left Heschl gyrus, right superior occipital lobe, left inferior occipital lobe, right precentral gyrus, and left rolandic operculum. Means and standard deviations for each quantified ROI are included in Table 2, and the confidence interval can be computed from these results; for example, the 95% confidence interval for the NAA/Cr ratio in the right precentral gyrus is 1.2 to 1.9. The mean NAA/Cr ratios across these eight regions were 1.6 ± 0.19 in control subjects and 1.4 ± 0.086 in patients (16% lower in patients). The NAA/Cr ratios were 1.5 ± 0.26 in control subjects and 1.3 ± 0.18 in patients (10% lower in patients) across all 81 measured regions.
Table 2.
NAA/Cr Ratios in Patients with ALS and Control Subjects
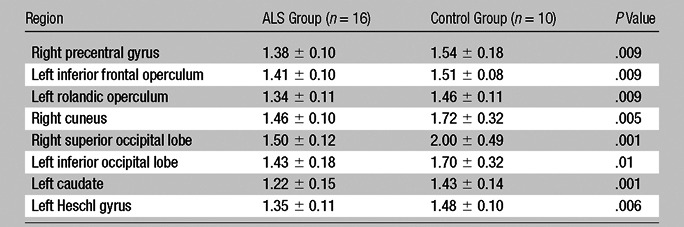
Note.—Data are NAA/Cr ratios from the eight regions in which ratios significantly varied (P ≤ .01) between patient and control groups. Data are means ± standard deviations.
The left caudate and right superior occipital lobes were the only two segmented regions where both the NAA/Cho and NAA/Cr ratios were significantly different. Although the differences in the Cho/Cr ratio were also compared, none of the surveyed regions showed any significant variation between patients and control subjects. The mean Cho/Cr ratios were 0.26 ± 0.050 for patients and 0.26 ± 0.060 for control subjects across all 81 ROIs, although the ratio was 0.4% higher in patients.
Figure 1 shows the segmented regions where significant differences were found between patients and control subjects through four of 18 different section levels in the brain. The identified regions have been colored red to indicate a significant difference in the NAA/Cho ratio, blue to indicate a significant difference in the NAA/Cr ratio, and purple to indicate a significant difference in both ratios. These regions were then superimposed on a composite brain template.
Figure 1:
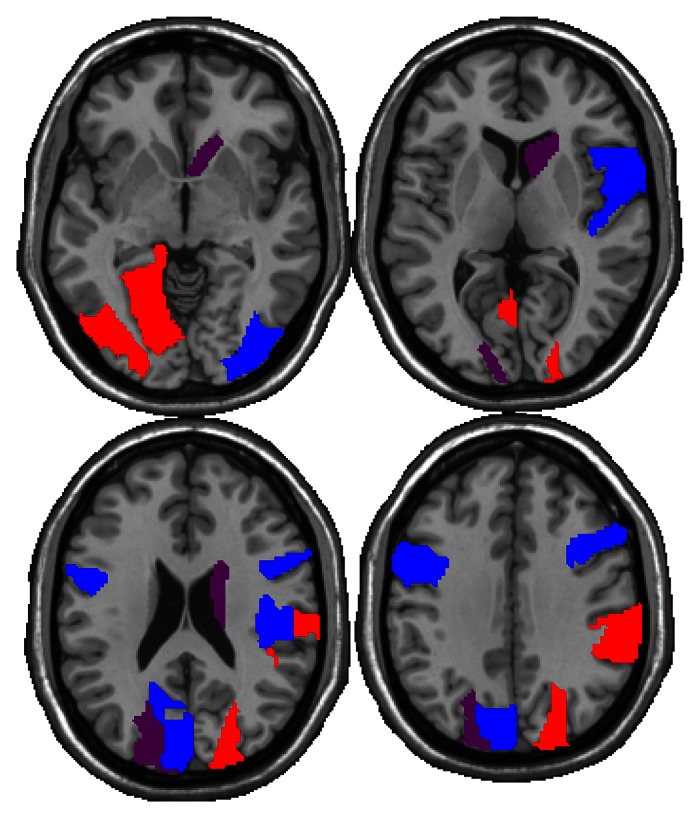
Regions showing significantly lower NAA/Cho ratios (red), NAA/Cr ratios (blue), or both (purple) in the patient group. Regions are highlighted through four of 18 different section levels in the brain, moving from inferior to superior in the left-to-right direction.
Figure 2 shows representative spectra from a voxel in the precentral gyrus region of a patient (red) and a control subject (black). This particular voxel shows relatively lower NAA and Cr levels in the patient, resulting in lower NAA/Cho and NAA/Cr ratios.
Figure 2:

Representative spectra from the right precentral lobe of a 55-year-old woman with ALS (red) and a 57-year-old healthy female control subject (black), along with the corresponding voxel localization overlaid onto a coregistered T1-weighted image.
Discussion
Our study shows that echo-planar spectroscopic imaging is a useful method for detecting metabolic abnormalities throughout the brain of patients with ALS. The findings of significantly lower NAA/Cr and NAA/Cho ratios in the precentral gyrus, midfrontal region, left caudate, occipital lobe, and other regions of patients confirm that ALS is a multisystem disorder of the entire brain. It is not just restricted to the motor cortex, which has traditionally been a main focus of ALS studies (32,33). The mean NAA/Cho ratios were 8.2 ± 2.2 in control subjects and 6.7 ± 1.4 in patients across the six regions where a significant difference was observed, or 23% lower in patients. The mean NAA/Cr ratio was significantly different between patients and control subjects in eight regions, with 6.1 ± 1.9 in control subjects and 5.3 ± 2.3 in patients, or 16% lower in patients. No significant changes in the Cho/Cr ratio were observed in any region.
Among the major metabolites detectable with MR spectroscopy, NAA is a marker for neuronal function, and Cho is an indicator of cell membrane turnover, whereas Cr concentration reflects cellular energy reserves. The NAA/Cr ratio has previously been presented as a biomarker for neuronal integrity (34). Although none of the imaged patients were prescribed Cr, its presence as an over-the-counter supplement could have played a role in observed changes in the NAA/Cr ratio. Cho is present in cell membranes as a component of phosphatidylcholine, and increases in Cho concentration have previously been attributed to breakdown of these membranes, resulting in accumulation of measurable Cho. Involvement of the precentral region, resulting in decreases in the NAA/Cho and NAA/Cr ratios, are consistent with the pathologic features of ALS and previously reported findings; they suggest histopathologic disease in the motor cortex (35).
Of the six and eight regions, respectively, where NAA/Cho and NAA/Cr ratios significantly differed between patients with ALS and control subjects, the ratios were lower in patients in each instance. Because NAA is considered a marker (36,37) for neuronal function, a decrease in the NAA/Cho ratio is consistent with neuronal dysfunction in these areas (8). Of note, we observed significant reduction of the NAA/Cho ratio in the left caudate but not in the right caudate, which was also reported in a previous study with echo-planar spectroscopic imaging (21). Metabolic abnormalities assessed with echo-planar spectroscopic imaging were also reported along the corticospinal tract, thereby confirming the metabolic involvement of upper motor neurons in patients with ALS (22).
Decreases in the NAA/Cho ratio from the occipital lobe of patients with ALS were unexpected because the occipital lobe is supposedly unaffected in ALS (8). The proximity of the occipital lobe to the posterior skull marrow possibly contributed to variability in NAA measurements. Despite prior knowledge–based peak fitting performed by using the MIDAS software, voxels close to skull marrow were affected by the presence of lipids, whose concentration is considerably higher than that of NAA. This caused an artificial increase in quantified NAA concentration and was apparent in both the NAA metabolite maps and voxel spectra. Lipid contamination would affect NAA more strongly than does either Cho or Cr because of the relative proximity of NAA to lipid resonances. Despite this finding, some voxels that did not exhibit any lipid contamination also showed a decrease in the NAA/Cho ratio. The reason for increased Cho in the occipital region remains unclear, although histopathologic abnormalities have been identified in this area in “heat maps” assessing the density of pathologic features of TAR DNA-binding protein 43 (or TDP-43) throughout the brain (4). Future studies that include histologic correlation of MR spectroscopic studies from the occipital lobe may help delineate whether increased histopathologic disease also occurs in the occipital lobe in ALS.
Combined with segmentation anal-ysis, echo-planar spectroscopic imaging facilitated substantial expansion in the spatial coverage of spectroscopic studies of ALS. Echo-planar spectroscopic imaging offers improvements over single-voxel spectroscopy and chemical shift imaging by accelerating spatial encoding and facilitating smaller voxel sizes. The effective 1.0-mL acquired voxel volume is considerably smaller than that in previous chemical shift imaging studies of ALS, wherein voxel sizes were generally 2.0 mL or more (12,38). Segmentation analysis requires coregistration of spectroscopic imaging data with separately acquired MR imaging, which may contribute spatial inaccuracies even with relatively high-spatial-resolution echo-planar spectroscopic imaging data. More reliable coregistration could facilitate segmentation of smaller and more specific regions of brain anatomy, extending spatial coverage to such regions as the brain stem.
Patient group size reflects both a relatively low incidence of the disease and the time-intensive nature of spectroscopic imaging and physical examination protocols. Larger patient and control cohorts could have lent statistical weight to observed trends of decreased NAA measured throughout the brain. Because of the large number of regions surveyed in the statistical analysis, random variability could account for some of the differences observed. For this reason, the statistical observations should be studied in greater detail and considered in combination with the broader metabolic trends and the pathologic features of ALS. Although echo-planar spectroscopic imaging facilitated acquisition from several ROIs throughout the brain, a limitation of such a multiregion analysis is the potential of false-positive findings. The false discovery rates (39) were calculated to be 13.5% in the NAA/Cho data set and 10.1% in the NAA/Cr data set. The number of false-positive results was limited by our decision to use the conservative P value of .01.
In conclusion, echo-planar spectroscopic imaging is a useful method for detecting metabolic abnormalities throughout the brain of patients with ALS. Findings of reduction of NAA/Cho and NAA/Cr ratios obtained by using the echo-planar spectroscopic imaging sequence show agreement with findings of previous spectroscopic studies of the motor cortex and also suggest other regions to study the effects of ALS, such as the left caudate and superior and inferior occipital lobes.
Advances in Knowledge.
• In patients with amyotrophic lateral sclerosis (ALS), N-acetyl aspartate (NAA)/choline (Cho) and NAA/creatine (Cr) ratios were significantly lower (P ≤ .01) near the motor cortex and in previously understudied regions, including the left caudate and occipital lobe.
• In the six regions where the mean NAA/Cho ratio was significantly different between patient and control groups, it was 8.2 ± 2.2 (standard deviation) in the control group and 6.7 ± 1.4 in the patient group (23% lower in patients).
• In the eight regions where the mean NAA/Cr ratio was significantly different between patient and control groups, it was 6.1 ± 1.9 in the control group and 5.3 ± 2.3 in the patient group (16% lower in patients).
Implications for Patient Care.
• Echo-planar spectroscopic imaging provides metabolic information from the entire brain, offering the potential to improve the screening process for ALS by not requiring knowledge of the specific location of metabolic dysfunction before imaging.
• Echo-planar spectroscopic imaging will facilitate the development of rigorous testing of objective markers for involvement of upper motor neurons in ALS.
Disclosures of Conflicts of Interest: G.V. No relevant conflicts of interest to disclose. J.H.W. No relevant conflicts of interest to disclose. S.C. No relevant conflicts of interest to disclose. S.W. No relevant conflicts of interest to disclose. S.S. No relevant conflicts of interest to disclose. L.B.E. No relevant conflicts of interest to disclose. L.F.M. Financial activities related to the present article: none to disclose. Financial activities not related to the present article: paid for expert testimony by Post & Schell and Fine, White and Carey; received royalties from Up to Date. Other relationships: none to disclose. M.G. Financial activities related to the present article: none to disclose. Financial activities not related to the present article: holds board membership for International Society for Frontotemporal Dementias and Society of Neurobiology of Language. Other relationships: none to disclose. E.R.M. No relevant conflicts of interest to disclose. A.A.M. No relevant conflicts of interest to disclose. H.P. Financial activities related to the present article: none to disclose. Financial activities not related to the present article: paid for consultancy by ACR Image Metrix. Other relationships: none to disclose.
Received May 23, 2012; revision requested July 2; final revision received October 8; accepted October 12; final version accepted October 31.
Funding: This research was supported by the National Institutes of Health (grants 1R21NS063111, P01-AG032953, and R01EB000822).
Abbreviations:
- ALS
- amyotrophic lateral sclerosis
- Cho
- choline
- Cr
- creatine
- GRE
- gradient echo
- NAA
- N-acetylaspartate
- ROI
- region of interest
References
- 1.Rowland LP, Shneider NA. Amyotrophic lateral sclerosis. N Engl J Med 2001;344(22):1688–1700 [DOI] [PubMed] [Google Scholar]
- 2.Rowland LP. Diagnosis of amyotrophic lateral sclerosis. J Neurol Sci 1998;160(Suppl 1):S6–S24 [DOI] [PubMed] [Google Scholar]
- 3.Brownell B, Oppenheimer DR, Hughes JT. The central nervous system in motor neurone disease. J Neurol Neurosurg Psychiatry 1970;33(3):338–357 [DOI] [PMC free article] [PubMed] [Google Scholar]
- 4.Geser F, Martinez-Lage M, Robinson J, et al. Clinical and pathological continuum of multisystem TDP-43 proteinopathies. Arch Neurol 2009;66(2):180–189 [DOI] [PMC free article] [PubMed] [Google Scholar]
- 5.Graham JM, Papadakis N, Evans J, et al. Diffusion tensor imaging for the assessment of upper motor neuron integrity in ALS. Neurology 2004;63(11):2111–2119 [DOI] [PubMed] [Google Scholar]
- 6.Abrahams S, Goldstein LH, Simmons A, et al. Word retrieval in amyotrophic lateral sclerosis: a functional magnetic resonance imaging study. Brain 2004;127(Pt 7):1507–1517 [DOI] [PubMed] [Google Scholar]
- 7.Kaufmann P, Pullman SL, Shungu DC, et al. Objective tests for upper motor neuron involvement in amyotrophic lateral sclerosis (ALS). Neurology 2004;62(10):1753–1757 [DOI] [PubMed] [Google Scholar]
- 8.Rule RR, Suhy J, Schuff N, Gelinas DF, Miller RG, Weiner MW. Reduced NAA in motor and non-motor brain regions in amyotrophic lateral sclerosis: a cross-sectional and longitudinal study. Amyotroph Lateral Scler Other Motor Neuron Disord 2004;5(3):141–149 [DOI] [PMC free article] [PubMed] [Google Scholar]
- 9.Pohl C, Block W, Karitzky J, et al. Proton magnetic resonance spectroscopy of the motor cortex in 70 patients with amyotrophic lateral sclerosis. Arch Neurol 2001;58(5):729–735 [DOI] [PubMed] [Google Scholar]
- 10.Bradley WG, Bowen BC, Pattany PM, Rotta F. 1H-magnetic resonance spectroscopy in amyotrophic lateral sclerosis. J Neurol Sci 1999;169(1-2):84–86 [DOI] [PubMed] [Google Scholar]
- 11.Block W, Träber F, Flacke S, Jessen F, Pohl C, Schild H. In-vivo proton MR-spectroscopy of the human brain: assessment of N-acetylaspartate (NAA) reduction as a marker for neurodegeneration. Amino Acids 2002;23(1-3):317–323 [DOI] [PubMed] [Google Scholar]
- 12.Bowen BC, Pattany PM, Bradley WG, et al. MR imaging and localized proton spectroscopy of the precentral gyrus in amyotrophic lateral sclerosis. AJNR Am J Neuroradiol 2000;21(4):647–658 [PMC free article] [PubMed] [Google Scholar]
- 13.Chan S, Shungu DC, Douglas-Akinwande A, Lange DJ, Rowland LP. Motor neuron diseases: comparison of single-voxel proton MR spectroscopy of the motor cortex with MR imaging of the brain. Radiology 1999;212(3):763–769 [DOI] [PubMed] [Google Scholar]
- 14.Schuff N, Rooney WD, Miller R, et al. Reanalysis of multislice (1)H MRSI in amyotrophic lateral sclerosis. Magn Reson Med 2001;45(3):513–516 [DOI] [PubMed] [Google Scholar]
- 15.Brown TR, Kincaid BM, Ugurbil K. NMR chemical shift imaging in three dimensions. Proc Natl Acad Sci U S A 1982;79(11):3523–3526 [DOI] [PMC free article] [PubMed] [Google Scholar]
- 16.Pohmann R, von Kienlin M, Haase A. Theoretical evaluation and comparison of fast chemical shift imaging methods. J Magn Reson 1997;129(2):145–160 [DOI] [PubMed] [Google Scholar]
- 17.Ebel A, Soher BJ, Maudsley AA. Assessment of 3D proton MR echo-planar spectroscopic imaging using automated spectral analysis. Magn Reson Med 2001;46(6):1072–1078 [DOI] [PubMed] [Google Scholar]
- 18.Fischer LR, Culver DG, Tennant P, et al. Amyotrophic lateral sclerosis is a distal axonopathy: evidence in mice and man. Exp Neurol 2004;185(2):232–240 [DOI] [PubMed] [Google Scholar]
- 19.Turner MR, Cagnin A, Turkheimer FE, et al. Evidence of widespread cerebral microglial activation in amyotrophic lateral sclerosis: an [11C](R)-PK11195 positron emission tomography study. Neurobiol Dis 2004;15(3):601–609 [DOI] [PubMed] [Google Scholar]
- 20.Boillée S, Vande Velde C, Cleveland DW. ALS: a disease of motor neurons and their nonneuronal neighbors. Neuron 2006;52(1):39–59 [DOI] [PubMed] [Google Scholar]
- 21.Sharma KR, Saigal G, Maudsley AA, Govind V. 1H MRS of basal ganglia and thalamus in amyotrophic lateral sclerosis. NMR Biomed 2011;24(10):1270–1276 [DOI] [PMC free article] [PubMed] [Google Scholar]
- 22.Govind V, Sharma KR, Maudsley AA, Arheart KL, Saigal G, Sheriff S. Comprehensive evaluation of corticospinal tract metabolites in amyotrophic lateral sclerosis using whole-brain 1H MR spectroscopy. PLoS ONE 2012;7(4):e35607. [DOI] [PMC free article] [PubMed] [Google Scholar]
- 23.Sach M, Winkler G, Glauche V, et al. Diffusion tensor MRI of early upper motor neuron involvement in amyotrophic lateral sclerosis. Brain 2004;127(Pt 2):340–350 [DOI] [PubMed] [Google Scholar]
- 24.Brooks BR. El Escorial World Federation of Neurology criteria for the diagnosis of amyotrophic lateral sclerosis. Subcommittee on Motor Neuron Diseases/Amyotrophic Lateral Sclerosis of the World Federation of Neurology Research Group on Neuromuscular Diseases and the El Escorial “Clinical limits of amyotrophic lateral sclerosis” workshop contributors. J Neurol Sci 1994;124(Suppl):96–107 [DOI] [PubMed] [Google Scholar]
- 25.Govind V, Gold S, Kaliannan K, et al. Whole-brain proton MR spectroscopic imaging of mild-to-moderate traumatic brain injury and correlation with neuropsychological deficits. J Neurotrauma 2010;27(3):483–496 [DOI] [PMC free article] [PubMed] [Google Scholar]
- 26.Maudsley AA, Darkazanli A, Alger JR, et al. Comprehensive processing, display and analysis for in vivo MR spectroscopic imaging. NMR Biomed 2006;19(4):492–503 [DOI] [PMC free article] [PubMed] [Google Scholar]
- 27.Provencher SW. Automatic quantitation of localized in vivo 1H spectra with LCModel. NMR Biomed 2001;14(4):260–264 [DOI] [PubMed] [Google Scholar]
- 28.Friston KJ, Ashburner JT, Kiebel SJ, Nichols TE, Penny WD. Statistical parametric mapping: the analysis of functional brain images. London, England: Academic Press, 2001 [Google Scholar]
- 29.Ernst T. Quantification and analysis in MR spectroscopy. In: Gillard J, Waldman A, Barker P, eds. Clinical MR neuroimaging: diffusion, perfusion and spectroscopy. Cambridge, England: Cambridge University Press, 2005; 27–37 [Google Scholar]
- 30.Christiansen P, Henriksen O, Stubgaard M, Gideon P, Larsson HB. In vivo quantification of brain metabolites by 1H-MRS using water as an internal standard. Magn Reson Imaging 1993;11(1):107–118 [DOI] [PubMed] [Google Scholar]
- 31.Tzourio-Mazoyer N, Landeau B, Papathanassiou D, et al. Automated anatomical labeling of activations in SPM using a macroscopic anatomical parcellation of the MNI MRI single-subject brain. Neuroimage 2002;15(1):273–289 [DOI] [PubMed] [Google Scholar]
- 32.Geser F, Brandmeir NJ, Kwong LK, et al. Evidence of multisystem disorder in whole-brain map of pathological TDP-43 in amyotrophic lateral sclerosis. Arch Neurol 2008;65(5):636–641 [DOI] [PubMed] [Google Scholar]
- 33.Lowe J. New pathological findings in amyotrophic lateral sclerosis. J Neurol Sci 1994;124(Suppl):38–51 [DOI] [PubMed] [Google Scholar]
- 34.Kalra S, Arnold DL, Cashman NR. Biological markers in the diagnosis and treatment of ALS. J Neurol Sci 1999;165(Suppl 1):S27–S32 [DOI] [PubMed] [Google Scholar]
- 35.Wang S, Poptani H, Woo JH, et al. Amyotrophic lateral sclerosis: diffusion-tensor and chemical shift MR imaging at 3.0 T. Radiology 2006;239(3):831–838 [DOI] [PubMed] [Google Scholar]
- 36.Mitsumoto H, Ulug AM, Pullman SL, et al. Quantitative objective markers for upper and lower motor neuron dysfunction in ALS. Neurology 2007;68(17):1402–1410 [DOI] [PubMed] [Google Scholar]
- 37.Bowser R, Cudkowicz M, Kaddurah-Daouk R. Biomarkers for amyotrophic lateral sclerosis. Expert Rev Mol Diagn 2006;6(3):387–398 [DOI] [PubMed] [Google Scholar]
- 38.Miller BL. A review of chemical issues in 1H NMR spectroscopy: N-acetyl-L-aspartate, creatine and choline. NMR Biomed 1991;4(2):47–52 [DOI] [PubMed] [Google Scholar]
- 39.Benjamini Y, Hochberg Y. Controlling the false discovery rate: a practical and powerful approach to multiple testing. J R Stat Soc Ser A Stat Soc 1995;57(1):289–300 [Google Scholar]