

Abstract
Background
The recent decrease in myeloid leukemias (ML) incidence may be directly attributed to changes in the population-based cancer registries’ 2001 guidelines, which required the capture of only 1 malignancy in the myeloid lineage per person and the simultaneous adoption of myelodysplastic syndrome registration in the United States.
Methods
To address these potential limitations, we constructed 4 claims-based algorithms to assess ML incidence, applied the algorithms to the 1999–2008 Surveillance Epidemiology and End Results (SEER)-Medicare database, and assessed algorithm validity using SEER-registered cases. Each algorithm required 1 or more ML claims and accounted for recommended diagnostic services during the year prior to the first claim: 1+, 2+, 2+blood counts (BC) and 2+BCBM (bone marrow) (ordered by sensitivity).
Results
Each had moderate sensitivities (75% to 94%) and high specificities (above 99.0%), with the 2+BCBM algorithm demonstrating the highest specificity. Based on the 2+BCBM algorithm, SEER registered only 50% of the AML cases and a third of the CML cases. The annual incidence of ML in 2005 was 26 per 100,000 persons 66 years or older, much higher than the 15 per 100,000 reported by SEER using the same sample.
Conclusion
Our findings suggest underreporting of myeloid leukemias in SEER by a magnitude of 50–70%, as well as validate and support the use of the 2+BCBM claims algorithm in identifying ML cases. Moreover, use of this conservative and highly specific algorithm identified a high number of uncaptured ML cases, particularly CML cases.
Keywords: Myeloid leukemias, ML, cancer registries, guidelines, SEER, Medicare, claims-based
INTRODUCTION
Since the mid 1970s, cancer registries have monitored myeloid leukemia (ML) incidence in the United States. According to data from 9 Surveillance, Epidemiology and End Results (SEER) sites, age-adjusted trends in ML incidence decreased from 1975 to 1989, increased from 1990 to 2000, and decreased again after 2000.1 We hypothesize the drop in ML incidence in 2001 is largely attributable to a change in registry protocols and practice patterns favoring use of commercial pathology laboratories, as opposed to underlying changes in patterns of exposure within the general population.
In 2001, SEER issued a guideline stating that “a myeloid malignancy diagnosed after a previous myeloid malignancy would not be recorded as a subsequent primary,” which may have reduced the registration of ML incidence cases and changed the composition of registered cases, particularly if some subtypes are more likely to co-occur with other subtypes. In addition to changing guidelines on the registration of multiple primaries in the myeloid lineage, myelodysplastic syndromes (MDS) became a reportable malignancy to population-based registries for the first time in 2001, the year ICD-O-3 was implemented worldwide. About 30% of MDS cases progress to acute myeloid leukemia (AML),2 and such cases would not be registered with AML under the 2001 guidelines. In 2010, SEER updated their guidelines to allow multiple myeloid primaries, such as when a patient is “originally diagnosed in a chronic (less aggressive) phase and second diagnosis of a blast or acute phase more than 21 days after the chronic diagnosis.” The interpretation of SEER AML evidence over the period 2001 to 2009 is complicated, particularly for trend analysis.
The 2001 guidelines have further implications for capturing cases of chronic myeloid leukemia (CML). Like MDS, CML is often diagnosed in the outpatient setting, which potentially circumvents capture and registration as compared to hospital-based CML diagnoses. Additionally, when CML progresses into a blast phase and patients are hospitalized, approximately two-thirds of cases present as a myeloid leukemia and registrars may have difficulty distinguishing between CML blast phase and AML; yet only 1 of the 2 must be designated as the SEER primary malignancy. These surveillance conditions may lead to underreporting of CML.
The median age of diagnoses of MDS and myeloid leukemias is 65 years or older.1 The fact that MLs primarily affect older individuals and increase with age 3 makes ML incidence particularly well-suited for Medicare claims-based analysis. Claims-based algorithms have been used in prior reports to identify MDS and ML cases;4–6 yet no study has validated these ML algorithms using registry data.3 Given the SEER age-adjusted trends in ML incidence and the potential for ML incident cases to be underreported by population-based cancer registries from 2001 to 2005, we constructed and validated a claims-based algorithm of ML incidence using Medicare administrative data, assessed differential bias between AML and CML reporting, and estimated trends in AML and CML incidence from 2000 to 2005.
METHODS
Data Sources
We conducted a retrospective review of the SEER-Medicare database, 1999 to 2008. The SEER program is a national, population-based cancer registry sponsored by NCI with a catchment area roughly equal to 26% of the US population.7 Of SEER-registered cancer patients who were diagnosed at ages 65 years or older, 93% were matched with Medicare enrollment records and claims as previously described. Medicare is the primary insurer for approximately 97% of the US population 65 years of age or older.7 As an alternative to the traditional fee-for-service (FFS) Medicare, the Medicare Advantage program, Part C, is a managed care benefit that enrolls approximately 11%–14% of older Medicare beneficiaries.8–10 Part C was not included in this study because no claims data are available, due to reimbursement structure. All study procedures were approved by the University of Florida Institutional Review Board.
Study Population
For study inclusion, a beneficiary must have resided in 1 of the 9 SEER regions between 1999 and 2005, enrolled in FFS Medicare due to age for 13 months or more, and not participated in Medicare Advantage. Beneficiaries were excluded if all claims after the 1st year of enrollment were in hospice. The study population included in the current analysis represents a 5% sample of registered and non-registered beneficiaries (n=287,854) and an oversampling of all beneficiaries registered in SEER with ML and other hematologic malignancies (ICD-O-3 codes 9800 to 9989) (n=24,904). The oversampling allows for more in-depth examinations of beneficiaries diagnosed with hematological malignancies.
Claims-Based Algorithms for ML Incidence
A claims-based algorithm was constructed incorporating temporal patterns in the administrative data that correspond to the clinical presentation of ML. A minimalist claims-based algorithm of ML incidence requires 1 or more ML claims (1+ algorithm),4 while more specific algorithms may attempt to remove inaccurate diagnoses by requiring additional information, such as a second claim within a specified period of time 6 or after a delay in time to confirm the indication.5 Algorithms based only on ICD-9-CM diagnosis codes do not account for clinical services required for ML diagnosis, (e.g., blood counts (BC) and bone marrow (BM) biopsy or aspiration.
We compared the sensitivity and specificity of 4 algorithms: 1) The “1+” algorithm requires a single claim with ICD-9-CM diagnosis of ML. 2) The “2+” algorithm requires a second claim between 1 and 12 months after the first or death or hospice enrollment within 3 months of the first claim. This accounts for the censoring of ML patients who were considered terminally ill within 3 months of the first claim. The final 2 algorithms are based on clinical knowledge of diagnostic services required to confirm ML, specifically BC and BM biopsy or aspiration. 3) The “2+BC” algorithm further restricts the 2+ algorithm by requiring a BC during the year prior to the first claim. 4) The “2+BCBM” algorithm further requires both a BC and a BM during the year prior to the first claim. Each of the claims-based algorithms captures only ML cases that are clinically diagnosed (e.g., no post-mortem diagnoses) and are not dependent on the use of any particular treatment (e.g., blood transfusions).
Statistical Methods
To assess the validity of the claims-based algorithms, SEER registration was used as the gold standard, with ML cases defined by ICD-O-3 histology codes (Table 1). Sensitivity was defined as the proportion of SEER-registered ML patients who were identified as ML cases by the claims-based algorithm. Specificity was defined as the proportion of individuals not registered in SEER who were not identified as an ML case by the claims-based algorithm. To avoid misclassification of prevalent ML cases as incident ML cases, all patients with claims for ML, unspecified leukemia (ICD-9-CM 208) or unspecified anemia (ICD-9-CM 285.9) in year 1999 or in their first year of Medicare enrollment were excluded from the analysis.
Table 1.
Acute and Chronic Myeloid Leukemias
| ICD-9-CM Codesa | ICD-O-3 Codes by WHO and FAB classification |
|---|---|
| Acute Myeloid Leukemias (AMLs) | |
| Acute myeloid leukemia w/recurrent genetic abnormalities | |
| 207.0 | 9840 Acute erythroid leukemia, M6 |
| 9865 Acute myeloid leukemia (AML) w/ t(6;9)(p23;q34)b | |
| 9866 Acute promyelocytic leukemia (APL), M3 | |
| 9869 AML w/ inv(3)(q21q26.2) or t(3;3)(q21;q26.2) b | |
| 9871 AML w/ eosinophilia, M4Eo | |
| 9896 AML w/ t(8;21)(q22;q22) b | |
| 9897 AML w/ 11q23 abnormalities b | |
| 9911 Acute megakaryocytic leukemia (AMKL) w/ t(1;22)(p13;q13) b | |
| Acute myeloid leukemia w/multilineage dysplasiac | |
| 9895 AML w/multilineage dysplasia b | |
| Acute myeloid leukemia & myelodysplastic syndrome, therapy-related | |
| 9920 Therapy-related AML b | |
| Acute myeloid leukemia, not otherwise specified | |
| 205.0 or 205.2 | 9861 AML |
| 9867 Acute myelomonocytic leukemia (AMML), M4 | |
| 9870 Acute basophilic leukemia (ABL) b | |
| 9872 Acute myeloblastic leukemia, M0 | |
| 9873 AML w/o maturation, M1 | |
| 9874 AML w/ maturation, M2 | |
| 9880 Acute eosinophilic leukemia (AEL) b | |
| 206.0 or 206.2 | 9891 Acute monocytic leukemia (AMoL), M5 |
| 9898 Myeloid leukemia w/ Down syndrome b | |
| 207.2 | 9910 AMKL, M7 |
| 9931 Acute panmyelosis with myelofibrosis | |
| Myeloid sarcoma | |
| 205.3 | 9930 Myeloid sarcoma |
| Chronic Myeloid Leukemias (CMLs) | |
| Chronic myeloproliferative neoplasms (MPN) | |
| 205.1 | 9863 Chronic myeloid leukemia (CML) |
| 9875 CML, BCR/ ABL positive b | |
| 9963 Chronic neutrophilic leukemia (CNL) b | |
| 9964 Chronic eosinophilic leukemia (CEL)/hypereosinophilic b | |
| Myelodysplastic/ myeloproliferative neoplasms (MDN/MPN) | |
| 9876 Atypical CML, BCR/ ABL negative b | |
| 206.1 | 9945 Chronic myelomonocytic leukemia (CMML) |
| 9946 Juvenile myelomonocytic leukemia (JMML) b | |
ICD-9 codes for other or unspecified myeloid leukemias are not shown. Acute biphenotypic leukemia (ICD-O-3 9805) is not included as a myeloid leukemia, because it potentially represents a distinct disease entity and was not included in WHO or FAB classification systems.
Eight AML codes and 4 CML codes did not appear in the 2000 registry sample either due to their introduction after January 1, 2000 or their absence among older adults.
AML with multilineage dysplasia was introduced as ICD-O-3 code in 2001, listed as a subgroup of AML in the 2002 WHO classification system, and removed in 2008.
Additionally, we applied the 4 algorithms to estimate incidence of ML, AML, and CML among older adults. Each trend represents the number of incident cases per year per 100,000 beneficiaries in SEER regions and was compared to the trends in SEER incidence for the same population of older adults. The study population contains all registered ML cases and only 5% of other cancer and unregistered beneficiaries in SEER regions, therefore, we applied sampling weights to adjust for the oversampling. We applied a second set of sampling weights created to adjust for differences in the age distribution between 2000 and 2005 using the 2005 age distribution as the standard.
RESULTS
Demographic characteristics of Medicare beneficiaries residing in SEER regions are described in Table 2 for 3 groups defined by SEER registration: 1) those registered in SEER as ML cases (coded by ICD-O-3 codes 9800 to 9989); 2) those registered in SEER with other hematological malignancies, such as MDS and lymphocytic leukemias (ICD-O-3 9800 to 9989); and 3) those not registered in SEER with ML. Persons in the Not Registered group may have been registered in SEER with hematological malignancies prior to 1999 or for other cancers. Consistent with previous reports, ML patients were older and more likely to be male and White as compared to those not registered. Across the 3 groups, 12–24% of beneficiaries had claims for ML or unspecified leukemia or anemia in 1999 or in their first year of Medicare enrollment; these individuals were considered prevalent cases and excluded from the validation analysis.
Table 2.
Demographic Characteristics and Myeloid Leukemia Claims Among Medicare Beneficiaries by SEER Registration Status, 1999–2005
| Beneficiary Characteristics | SEER Registereda
|
Not Registered (n=287,854) n (%) | |
|---|---|---|---|
| Myeloid Leukemia (n=6,013) n (%) | Other Hematologic Malignancy (n=18,891) N (%) | ||
| Age (years) in January 2001 [median (interquartile range)] | 76 (70–81) | 76 (70–82) | 73 (67–80) |
|
| |||
| Gender | |||
| Male | 3,246 (54) | 9,979 (53) | 115,182 (40) |
| Female | 2,767 (46) | 8,912 (47) | 172,672 (60) |
|
| |||
| Race/Ethnicity | |||
| White | 5,365 (89) | 17,069 (91) | 244,724 (84) |
| Black | 288 (5) | 977 (5) | 18,050 (7) |
| Other | 93 (1) | 204 (1) | 6,254 (2) |
| Asian | 176 (3) | 350 (2) | 11,367 (4) |
| Hispanic | 73(1) | 216 (1) | 5,866 (2) |
| North American Native | <11 (<0.4b) | 38 (<1) | 1,010 (<1) |
| Unknown | <11 (<0.4b) | 37 (<1) | 583 (<1) |
|
| |||
| Claims for myeloid leukemia or unspecified leukemia or anemia within 1st data year c | 1,305 (22) | 4,594 (24) | 34,747 (12) |
Other hematologic malignancies coded within the ICD-O-3 histology codes 9800 to 9989 largely involve the myeloid lineage (e.g., myeloid dysplastic syndrome); however, this range also includes a few lymphoid malignancies. Persons in the Not Registered group may be registered as incident cases for hematological malignancies prior to 1999 or for other cancers.
Percentages less than 0.4% are suppressed to protect patient anonymity.
NOTE: P values represent group comparisons on weighted t-tests.
A person with myeloid leukemia claims within the first year of claim data may be a prevalent case; therefore must be removed from the validation analysis and incidence estimation.
After removing the prevalent cases (Table 3), 333 (7%) of the remaining 4,708 SEER-registered ML cases lacked claims for ML between 2000 and 2005. Among these cases, 231 (69%) had a claim for unspecified leukemia or anemia (ICD-9-CM 208 and 285.9) between 2000 and 2005, and an additional 14 (4%) had claims for ML between 2006 and 2008, which is outside the study period. The SEER-registered ML incident cases were separated in AML and CML categories based on their initial diagnosis, to assess differential bias in the underreporting of ML. The proportion with no ML claims was greater among the registered CML cases than AML cases (11% compared to 6%, P < 0.01).
Table 3.
Four Medicare Claims-Based Algorithms for Classifying SEER-Registered Myeloid Leukemia Cases in 2000–2005
| Claims-based Algorithms | SEER Registereda
|
Not Registered (n= 253,107) n (%) | |||
|---|---|---|---|---|---|
| All ML (n=4,708) n (%) | AML (n=3,365) n (%) | CML (n=1,343) n (%) | Other Hematologic Malignancies (n=14,297) n (%) | ||
| No ML claims | 333 (7) | 187 (6) | 146 (+11) | 11,589 (81) | 252,632 (100) |
| 1 or more ML claims (1+) | 4,375 (93) | 3,178 (94) | 1,197 (89) | 2,708 (19) | 475 (<1) |
| & a second ML claim 1 to 12 months after 1st claim or death or hospice entry within 3 months (2+) | 4,266 (91) | 3,140 (93) | 1,120 (83) | 2,047 (14) | 147 (<1) |
| & a blood count (BC) within 12 months before 1st claim (2+BC) | 4,260 (90) | 3,137 (93) | 1,117 (83) | 2,041 (14) | 143 (<1) |
| & a bone marrow (BM) biopsy within 12 months before 1st claim (2+BCBM) b | 4,190 (89) | 3,123 (93) | 1,061 (79) | 1,921 (13) | 107 (<1) |
| 2+BCBM using only CML claims | 1,551 (33) | 546 (16) | 1,005 (75) | 606 (4) | 44 (<1) |
| 2+BCBM using only AML claims | 3,414 (73) | 3,088 (92) | 326 (24) | 1515 (11) | 65 (<1) |
Persons registered with ML were separated into AML and CML categories based on first diagnosis. Individuals with Other Hematologic Malignancies were coded with a non-myeloid malignant disease using an ICD-O-3 code between 9800 and 9989. The validation samples (All ML, AML, CML and Other Hematologic Malignancies) excluded persons with claims for ML or unspecified leukemia or anemia within 1st data year (i.e., prevalent cases). Persons in the Not Registered group may have been registered for a hematological malignancy prior to 1999 or for other cancers.
For the ML 2+BCBM algorithm, sensitivity is 89.00% (4,190/4,708) and specificity is 99.96% ((253,107-107)/253,107). Sensitivities for the 2+BCBM AML and CML algorithms are 92% (3,088/3,365) and 75% (1,061/1,343), respectively.
In Table 3, the sensitivities of the 4 claims-based algorithms are presented in the first column. Sensitivity was highest for the 1+ algorithm (93%). Requiring a second claim for AML within 1 to 12 months after the first claim or death or hospice entry within 3 months of the first claim (i.e., the 2+ algorithm) reduced the sensitivity to 91%. Further requiring a BC claim within the year and before the first claim had little effect on sensitivity (90%); however, requiring a BM biopsy reduced the sensitivity to 89%. The specificity is 100% minus the percentages in the last column and was above 99% for all algorithms.
The most conservative algorithm (2+BCBM) identified 107 ML cases among patients who were not registered. The 2+BCBM algorithm identified 1,921 additional ML cases among patients registered with other hematological malignancies (e.g., myelodysplastic syndrome). In summary, SEER registered about half of the ML cases (51%; 4,190 / (4,190+ 1,921 + 107×20)) as defined by the 2+BCBM algorithm, which is a conservative estimate.
Sensitivities for the 2+BCBM AML and CML algorithms were 92% (3,088/3,365) and 75% (1,061/1,343), respectively. The difference between sensitivities was largely attributable to the frequent absence of 2 ML claims for CML cases (−17% compared to −7%) and the reduced use of BM biopsy within the year prior to diagnosis (−4% compared 0%). Applying the same sampling weight adjustment as before, SEER registered half of the AML cases (50%; 3,088 / (3,088 + 326+1,515+65×20)), but only a third of the CML cases (33%; 1,005/ (1005 + 546 + 606 + 44×20) as defined by the 2+BCBM algorithm. Based on 2+BCBM algorithm, 546 CML incident cases (18%) were SEER registered with AML and 326 AML cases (5%) were SEER registered with CML.
Figure 1 illustrates the trend over time in ML incident rates estimated using 3 claims-based algorithms and SEER registry data with age adjustment. For the year 2005, ML incidence was estimated to be 70 per 100,000 persons based on the 1+ algorithm and 26 based on the more conservative 2+BCBM algorithm. Using the same sample, SEER-based ML incidence ranged from 15 to 18 cases per 100,000 over this period. The incident rates were lower in 2000 due to the removal of all 1999 prevalent cases. Compared to the 1+ algorithm estimates, requiring a second claim halved the number of incident cases. The 2+BC algorithm results are not shown, because they were nearly identical to the 2+ results. The difference between the 1+ algorithm and the 2+ algorithm was lower in 2004, potentially related to the increased use of diagnostic services recommended by International Working Group (IWG) 2003 AML guidelines.11,12
Figure 1.

Age-adjusted temporal trends in myeloid leukemia incident rates based on three claims-based algorithm and on SEER registry evidence, 2000–2005
Figure 2 illustrates trends in AML and CML incidence based on the 2+BCBM algorithm and SEER registry data. In 2005, the number of AML incident cases was 19 per 100,000 based on the 2+BCBM algorithm, substantially higher than the 11 per 100,000 based on SEER. Likewise, the number of CML incident cases was 11 per 100,000 based on the 2+BCBM and 5 per 100,000 based on SEER.
Figure 2.
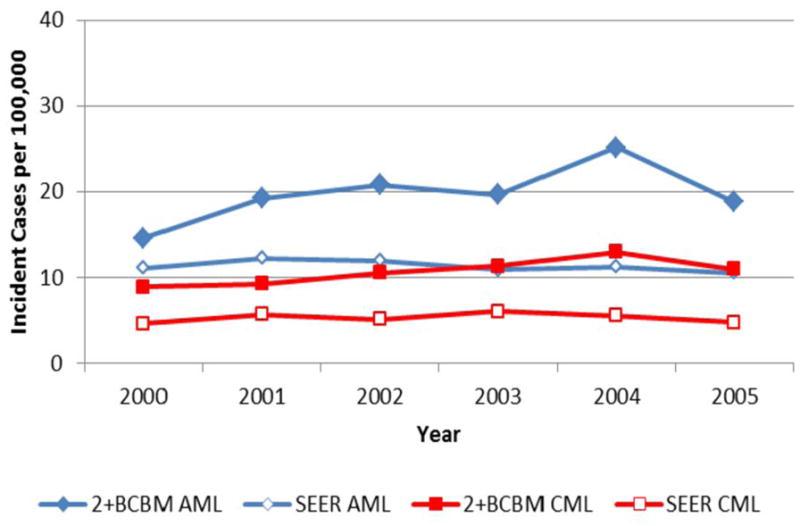
Age-adjusted temporal trends in acute and chronic myeloid leukemia incident rates based on the most conservative claims-based algorithm and on SEER registry evidence, 2000–2005
DISCUSSION
Given the potential for ML cases to be uncaptured by population-based cancer registries, we sought to develop and validate a Medicare claims-based algorithm for the identification of ML and estimate incidence in individuals ages 65 years and older.3,13 The results of this validation study demonstrate that claims-based algorithms of ML incidence are moderately sensitive and highly specific. The 1+ algorithm has reduced specificity and may overestimate incidence and obscure patterns identified by more definitive algorithms. In comparison, the more rigorous 2+BCBM algorithm showed the highest specificity, which is of critical importance if this tool is to be used as a basis for large scale extrapolations and investigations of ML treatment patterns. Therefore, our work validates and supports the use of the 2+BCBM claims algorithm in identifying ML cases.
This is the first study to assess the validity of claims-based algorithms in leukemia; however, previous studies have applied claims-based measures. Three studies did not disclose specific ICD-9-CM or ICD-O-3 codes for identified AML cases in the SEER database. 14–16 Three additional studies included ICD-9-CM codes for myeloid (205.XX) and monocytic (206.XX) leukemia; however, the use of this range of codes encompassed acute and chronic diagnoses, thereby potentially misrepresenting CML cases as AML cases.5,6,17 Two studies required 2 or more claims of AML, 5,6 but only 1 required AML claims more than 30 days apart and did not limit the difference to less than 1 year or correct for terminal diagnoses and hospice (i.e., the 2+BCBM algorithm).5
The 2+BCBM algorithm may be separately applied to all ML claims, AML claims and CML claims; however, these algorithms provided overlapping results. Among the 2,201 cases identified by the 2+BCBM algorithm using only CML claims, nearly half of the cases (991; 45%) were independently identified by the 2+BCBM algorithm using only AML claims. This overlap has 6 possible interpretations: (1) CML cases were being coded as AML for reimbursement; (2) CML cases that progressed to the blast phase were miscoded as AML; (3) AML cases were initially thought to be CML cases until results of cytogenetic and molecular testing became available; (5) the process to rule-out CML took over 1 month, rendering 2 claims 1 month apart; or (6) clerical inaccuracies were made in ICD-9-CM coding. Due to SEER guidelines prohibiting multiple primaries involving the myeloid lineage from 2001 to 2005, it was not possible to test between these interpretations. By and large these clinical interpretations favored the CML diagnosis; therefore, future work may first identify the CML cases and remove them prior to applying the AML 2+BCBM algorithm. This hierarchal approach agrees with 2001 SEER guidelines that prohibit AML registration after CML registration.
The primary results showing that SEER registered only half of the AML cases and a third of the CML cases may be under-estimates, because these results are based on a conservative claims-based algorithm that requires BM biopsy, as recommended by 2000 NCCN guidelines. Furthermore, SEER did not require biopsy confirmation for registration and may have included cases that would be excluded upon biopsy.
Absence of SEER registration may be over-stated. Among the 4,994 cases identified by the 2+BCBM algorithm using only AML claims, over a third of the cases (37%; 1841) were SEER registered as another hematological malignancy, such as MDS. Therefore, these AML patients were captured in SEER, but with a different disease. Consequently, data from SEER between 2001 and 2005 may not accurately reflect the true incidence of AML between 2001 and 2005.
The implications of these findings expand beyond Medicare and suggest specific changes in the registry system. When analyzing the uncaptured ML cases, we found that many of these cases linked to individuals already registered in SEER for another cancer. This gap in the registry system may be resolved by requiring ML registration regardless of other cancer diagnoses, which is partially addressed in the updated 2010 coding rules.18 However, a more difficult gap to address is registry reliance on inpatient surveillance for ML incidence.13,19,20 In particular, patients with CML and other chronic myeloid malignancies, like MDS and myeloproliferative neoplasms, are often diagnosed and managed in the outpatient setting and may be missed by surveillance systems relying on hospital registration. We have recently demonstrated the bias of cancer registration in MDS towards a more advanced disease stage by comparing the clinical characteristics of captured MDS patients with uncaptured MDS patients.21 The evidence of bias against outpatient registration suggests that the CML cases in SEER may favor moderately advanced CML cases (e.g., acceleration phase, transfusion requiring) and exclude higher grade cases (e.g., blast phase, immediate outpatient referral to hospice) and lower grade CML cases (e.g., asymptomatic patients).
A primary limitation of claims-based algorithms is the reliance on ICD-9 codes. The ICD-9 codes generated by the treating physician at the time of billing are assumed to be the physician’s impression of the diagnosis rather than a confirmed pathologic diagnosis. A small proportion of the SEER-registered cases did not have claims with ML codes and ML patients may not have consented to undergo BM biopsy. The imprecise coding of ML as unspecified leukemia or anemia and ML treatment without confirmatory BM biopsy suggests that claims-based algorithms may miss ML cases (i.e., poor sensitivity). Additionally, no claims algorithm can measure incidence in the first 12 months of Medicare enrollment because of the lack of data prior to enrollment to rule out ML prevalence. Claims-based algorithms are also limited to insured populations and excluded persons enrolled in managed care organizations due to the absence of claims (e.g., Medicare advantage).
In summary, we evaluated 4 claims-based algorithms for sensitivity and specificity using the SEER-Medicare database, which included registered ML patients as gold-standard comparators. Our findings validate and support the use of the 2+BCBM claims algorithm in identifying ML cases and indicate that SEER registered half of AML cases and a third of CML cases. Moreover, use of this conservative and highly specific algorithm identified a high number of uncaptured ML cases. From a policy perspective, our results call for the commitment of more resources for centralized cancer registries so that they may improve ML case ascertainment. More accurate data would empower policy makers with ability to properly allocate limited health care resources.
Acknowledgments
Funding support for this research was provided by the NIH Infrastructure grant, Developing Information Infrastructure Focused on Cancer Comparative Effectiveness Research (RC2-CA148332; PI: Fenstermacher); and Dr. Craig’s NCI Career Development Award (K25 -CA122176). The authors thank the staff in Dr. Craig’s lab at Lee H. Moffitt Cancer Center & Research Institute for their contributions to the research and creation of this paper: Riddhi Patel (research assistance) and Carol Templeton (copy editing).
Footnotes
AUTHORS’ DISCLOSURE OF POTENTIAL CONFLICTS OF INTEREST
The authors declare no competing financial interests.
AUTHOR CONTRIBUTIONS
B.M.C. and designed the concept, analyzed data, interpreted the data, and wrote and approved the manuscript. C.R.C. designed the concept, interpreted the data, and wrote and approved the manuscript. D.E.R. and A.F.L. wrote and approved the manuscript.
References
- 1.Surveillance Research Program. National Cancer Institute; [Accessed April 11, 2011]. Fast Stats: An interactive tool for access to SEER cancer statistics. (Accessed at http://www.seer.cancer.gov/faststats/) [Google Scholar]
- 2.Greenberg P, Cox C, LeBeau MM, Fenaux P, Morel P, Sanz G, et al. International scoring system for evaluating prognosis in myelodysplastic syndromes. Blood. 1997;89:2079–88. [PubMed] [Google Scholar]
- 3.Ma X, Does M, Raza A, Mayne ST. Myelodysplastic syndromes: incidence and survival in the United States. Cancer. 2007;109:1536–42. doi: 10.1002/cncr.22570. [DOI] [PubMed] [Google Scholar]
- 4.Goldberg SL, Chen E, Corral M, Guo A, Mody-Patel N, Pecora AL, et al. Incidence and clinical complications of myelodysplastic syndromes among United States medicare beneficiaries. J Clin Oncol. 2010;28:2847–52. doi: 10.1200/JCO.2009.25.2395. [DOI] [PubMed] [Google Scholar]
- 5.Gruschkus SK, Lairson D, Dunn JK, Risser J, Du XL. Use of white blood cell growth factors and risk of acute myeloid leukemia or myelodysplastic syndrome among elderly patients with non-Hodgkin lymphoma. Cancer. 2010 doi: 10.1002/cncr.25525. [DOI] [PMC free article] [PubMed] [Google Scholar]
- 6.Hershman D, Neugut AI, Jacobson JS, Wang J, Tsai WY, McBride R, et al. Acute myeloid leukemia or myelodysplastic syndrome following use of granulocyte colony-stimulating factors during breast cancer adjuvant chemotherapy. J Natl Cancer Inst. 2007;99:196–205. doi: 10.1093/jnci/djk028. [DOI] [PubMed] [Google Scholar]
- 7.Warren JL, Klabunde CN, Schrag D, Bach PB, Riley GF. Overview of the SEER-Medicare data: content, research applications, and generalizability to the United States elderly population. Med Care. 2002;40:IV-3–18. doi: 10.1097/01.MLR.0000020942.47004.03. [DOI] [PubMed] [Google Scholar]
- 8.Foundation THJKF. Medicare+Choice Fact Sheet. 2003. [Google Scholar]
- 9.Foundation THJKF. Medicare Advantage FactSheet. 2004. [Google Scholar]
- 10.Foundation THJKF. Medicare Advantage Factsheet. 2005. [Google Scholar]
- 11.Cheson BD, Bennett JM, Kopecky KJ, Buchner T, Willman CL, Estey EH, et al. Revised recommendations of the international working group for diagnosis, standardization of response criteria, treatment outcomes, and reporting standards for therapeutic trials in acute myeloid leukemia. J Clin Oncol. 2003;21:4642–9. doi: 10.1200/JCO.2003.04.036. [DOI] [PubMed] [Google Scholar]
- 12.Smith M, Barnett M, Bassan R, Gatta G, Tondini C, Kern W. Adult acute myeloid leukaemia. Crit Rev Oncol/Hematol. 2004;50:197–221. doi: 10.1016/j.critrevonc.2003.11.002. [DOI] [PubMed] [Google Scholar]
- 13.Rollison DE, Howlader N, Smith MT, Strom SS, Merritt WD, Ries LA, et al. Epidemiology of myelodysplastic syndromes and chronic myeloproliferative disorders in the United States, 2001–2004, using data from the NAACCR and SEER programs. Blood. 2008;112:45–52. doi: 10.1182/blood-2008-01-134858. [DOI] [PubMed] [Google Scholar]
- 14.Martin MG, Welch JS, Luo J, Ellis MJ, Graubert TA, Walter MJ. Therapy related acute myeloid leukemia in breast cancer survivors, a population-based study. Breast Cancer Res Treat. 2009;118:593–8. doi: 10.1007/s10549-009-0376-3. [DOI] [PMC free article] [PubMed] [Google Scholar]
- 15.Ojha RP, Fischbach LA, Zhou Y, Felini MJ, Singh KP, Thertulien R. Acute myeloid leukemia incidence following radiation therapy for localized or locally advanced prostate adenocarcinoma. Cancer Epidemiol. 34:274–8. doi: 10.1016/j.canep.2010.04.003. [DOI] [PubMed] [Google Scholar]
- 16.Pulte D, Gondos A, Brenner H. Improvements in survival of adults diagnosed with acute myeloblastic leukemia in the early 21st century. Haematologica. 2008;93:594–600. doi: 10.3324/haematol.12304. [DOI] [PubMed] [Google Scholar]
- 17.Patt DA, Duan Z, Fang S, Hortobagyi GN, Giordano SH. Acute myeloid leukemia after adjuvant breast cancer therapy in older women: understanding risk. J Clin Oncol. 2007;25:3871–6. doi: 10.1200/JCO.2007.12.0832. [DOI] [PubMed] [Google Scholar]
- 18.Johnson C, Adamo M, Peace S, Percy-Laurry Ae. Hematopoietic and Lymphoid Neoplasm Case Reportability and Coding Manual. Bethesda, MD: National Cancer Institute; 2010. p. 119. Version 16. [Google Scholar]
- 19.Aul C, Giagounidis A, Germing U. Epidemiological features of myelodysplastic syndromes: Results from regional cancer surveys and hospital-based statistics. Int J Hematol. 2001;73:405–10. doi: 10.1007/BF02994001. [DOI] [PubMed] [Google Scholar]
- 20.De Roos AJ, Deeg HJ, Onstad L, Kopecky KJ, Bowles EJ, Yong M, et al. Incidence of myelodysplastic syndromes within a nonprofit healthcare system in western Washington state, 2005–2006. Am J Hematol. 2010 doi: 10.1002/ajh.21828. [DOI] [PubMed] [Google Scholar]
- 21.Craig BM, Rollison DE, List AF, Cogle CR. Diagnostic Testing, Treatment, Cost of Care, and Survival among Registered and Non-registered Patients with Myelodysplastic Syndromes. Leukemia Research; In press. [DOI] [PMC free article] [PubMed] [Google Scholar]