Abstract
The central nucleus of the amygdala (CEA) and lateral bed nucleus of stria terminalis (BST) are highly interconnected limbic forebrain regions that share similar connectivity with other brain regions that coordinate behavioral and physiological responses to internal and environmental stressors. Their similar connectivity is frequently referred to when describing the CEA and lateral BST together as a unified “central extended amygdala”. However, the CEA and BST reportedly play distinct roles in behavioral and physiological responses associated with fear, anxiety, and social defeat, presumably due to differences in connectivity. To identify common and unique sources of input to the CEA and lateral BST, we performed dual retrograde tracing. Fluorogold and cholera toxin β were iontophoresed into the medial CEA (CEAm) and the anterior ventrolateral BST (BSTvl) of adult male rats. The anatomical distribution of tracer-labeled neurons was mapped throughout the brain. Regions with overlapping populations of CEAm- and BSTvl-projecting neurons were further examined for the presence of double-labeled neurons. Although most regions with input to the mCEA also projected to the BSTvl, and vice versa, cortical and sensory system-related regions projected more robustly to the CEAm, while motor system-related regions primarily innervated the BSTvl. The incidence of double-labeled neurons with collateralized axonal inputs to the CEAm and BSTvl was relatively small (~2 to 13%) and varied across regions, suggesting regional differences in the degree of coordinated CEAm and BSTvl input. The demonstrated similarities and differences in inputs to CEAm and BSTvl provide new anatomical insights into the functional organization of these limbic forebrain regions.
Keywords: Limbic system, Extended amygdala, Axon collateralization, Dual retrograde tracing
Introduction
The central nucleus of the amygdala (CEA) and lateral bed nucleus of stria terminalis (BST) are highly interconnected limbic forebrain regions that form the crux of the integrative functional unit often referred to as the central extended amygdala (de Olmos and Heimer 1999). The original concept of the extended amygdala as proposed by de Olmos and Heimer was based upon observations that extended amygdala structures share similar cytoarchitectural and histochemical characteristics (Alheid and Heimer 1988; de Olmos and Heimer 1999). According to their proposal, the central division of the extended amygdala includes the CEA and the lateral BST, in addition to interposed regions such as the substantia innominata (SI) that bridge the anatomical gap between CEA and lateral BST. De Olmos and Heimer further speculated that “all or most of the central extended amygdala would share similar inputs” (de Olmos and Heimer 1999). Indeed, in addition to robustly innervating each other, the CEA and lateral BST receive inputs from broadly similar brain regions implicated in visceral and somatosensory functions, and send axonal projections to broadly similar regions that maintain homeostasis by modifying behavioral, autonomic, and endocrine outflow (Dong et al. 2001b; Dong and Swanson 2003, 2004). Results from many studies indicate that CEA lesions often produce experimental results that are quite similar to results obtained after lateral BST lesions (Tanimoto et al. 2003; Deyama et al. 2007; Nakagawa et al. 2005; Zardetto-Smith et al. 1994). On the other hand, the concept of the central extended amygdala has been challenged by results from behavioral studies that suggest a dissociation of CEA and BST functions (Walker and Davis 1997; Walker et al. 2009; Walker et al. 2003; Jasnow et al. 2004; Funk et al. 2006; Fendt et al. 2003). For example, the CEA and lateral BST have been reported to play unique roles in mediating behavioral processes associated with fear, anxiety (Walker et al. 2003; Walker and Davis 1997; Fendt et al. 2003), social defeat (Jasnow et al. 2004), social interaction (Cecchi et al. 2002) and ethanol self-administration (Funk et al. 2006).
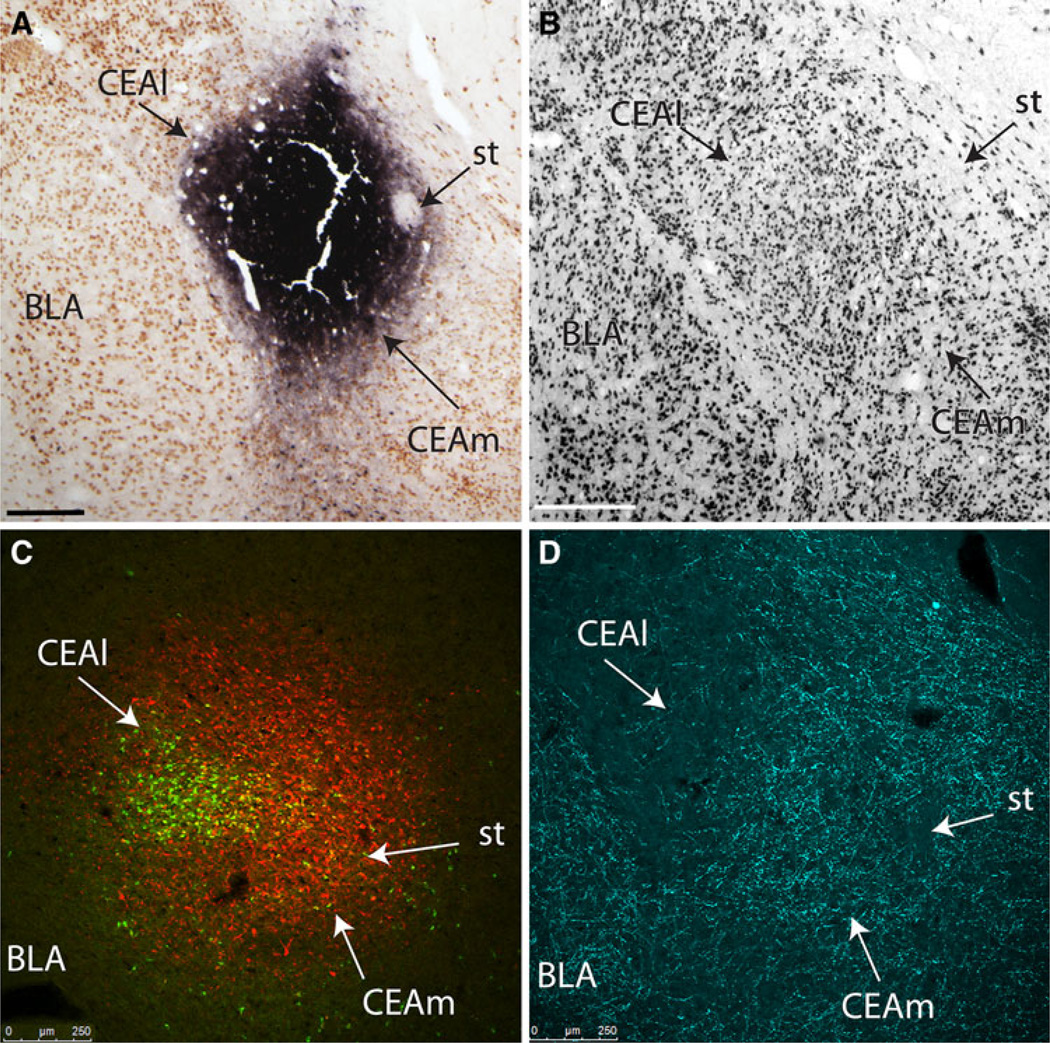
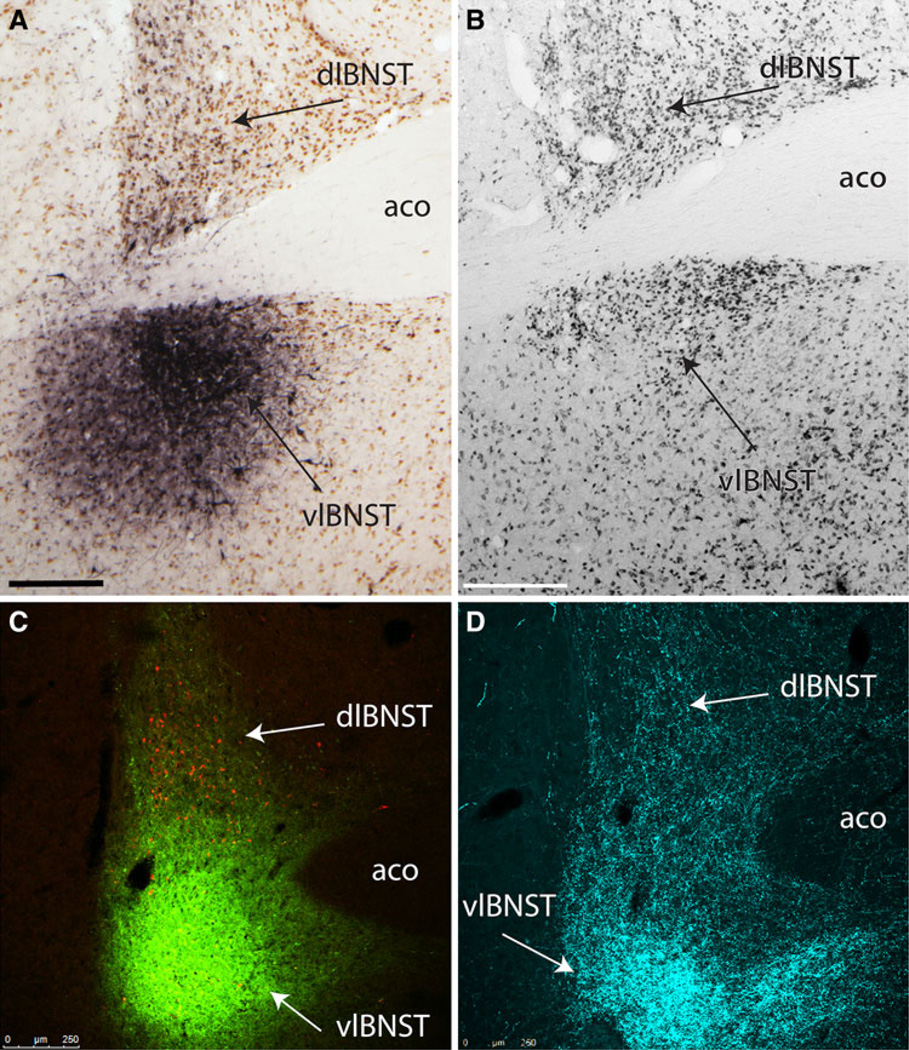
The apparent similarities and differences in CEA- and lateral BST-mediated functions may be due, at least in part, to similarities and differences in the connectivity of subregions within each structure. Evidence from retrograde tracing studies indicates that major subdivisions of the lateral BST are interconnected with specific CEA subdivisions that share similar inputs from defined subsets of diencephalic, pontine, and medullary regions (Sun et al. 1991). For example, dopaminergic inputs are most heavily concentrated in the lateral CEA (CEAl) and the dorsolateral BST (BSTdl), while noradrenergic (NA) inputs primarily target the medial CEA (CEAm) and ventrolateral BST (BSTvl; distribution of NA fibers shown in Figs. 1d, 2d) (Freedman and Cassell 1994). Thus, even within the “central extended amygdala”, afferent inputs to the CEAl and BSTdl differ to some extent from inputs to the CEAm and BSTvl.
Fig. 1.
Iontophoresis of FG or CTB retrograde tracer into the CEAm. Medial is to the right. a In case 10-9, CTB iontophoresis produced a highly localized, dense tracer deposit centered within the CEAm, although robust additional retrograde labeling also is present within the CEAl (CTB immunoperoxidase labeling is black, NeuN immunoperoxidase labeling is brown). b NeuN immunoperoxidase labeling reveals distinct cytoarchitectural boundaries of the CEA and its subnuclei (similar rostrocaudal level as in panel a). c In case 09-110, FG iontophoresis produced a spherical tracer delivery site centered within the CEAm (red immunofluorescence), although a larger sphere of tracer diffusion is seen to extend into the CEAl, where retrogradely labeled BST-projecting neurons (green) are clustered. d DBH immunofluorescently labeled fibers (cyan) are moderately dense within the CEAm, but much more sparse within the CEAl (similar rostrocaudal level as in panel c, slightly more rostral to the levels shown in panels a and b). Scale bars 250 µm
Fig. 2.
Iontophoresis of FG or CTB retrograde tracer into the BSTvl. Medial is to the right. a In case 10-9, FG iontophoresis produced a spherical deposit centered close to the lateral border of the BSTvl (FG immunoperoxidase labeling is black, NeuN immunoperoxidase labeling is brown). b NeuN immunoperoxidase labeling reveals distinct cytoarchitectural boundaries of the BST and its subnuclei (note the fusiform subnucleus is more lightly NeuN-positive compared to other BST subnuclei; similar rostrocaudal level to that shown in panel a). c In case 09-110, CTB iontophoresis produced a dense tracer deposit (green immunofluorescence) in the BSTvl, overlapping with FG-positive CEAm-projecting neurons (yellow). Additional FG-positive neurons are present within the BSTdl (red). d DBH immunofluorescently labeled fibers (cyan) form a dense terminal field within the BSTvl, with more moderate labeling observed within the BSTdl (similar rostrocaudal level to that shown in panel c). Scale bars 250 µm
Central afferents to the BSTvl in rats have recently been described (Shin et al. 2008). Based on its inputs, the BSTvl appears to integrate signals that impact emotional and motivational states such as pain, pleasure, hunger, thirst, and sickness (Gaykema et al. 2007; Harris and Aston-Jones 2007; Geerling and Loewy 2006; Gauriau and Bernard 2002; Ciccocioppo et al. 2003). Generally, in addition to inputs from the CEAm and other amygdala subregions, the BSTvl receives inputs from the hypothalamus, caudal medulla [including particularly robust input from NA neurons within the caudal nucleus of the solitary tract (NTS) and ventrolateral medulla (VLM)], thalamus, insular cortex, and infralimbic cortex. While most of these regions have also been described as innervating the CEA, the extent to which projections to the BSTvl and CEA arise from the same subregions and, potentially, from the same neurons has been largely unexamined. To date, only the VLM, medial prefrontal cortex, and insular cortex have been reported to contain individual neurons with collateralized axonal inputs to both the CEA and BST (Ciriello et al. 1994; Reynolds and Zahm 2005). However neither study specifically examined inputs to the CEAm and BSTvl, and there has been little experimental effort to discriminate between inputs that target the CEAm versus the CEAl.
The present study used iontophoretic delivery of two different retrograde neural tracers into the CEAm and BSTvl in order to examine the central distribution and potential overlap of neurons that provide axonal inputs to these specific subregions of the central extended amygdala. We hypothesized that brain regions with relatively large numbers of collateralized inputs to both the CEAm and BSTvl may provide an anatomical substrate for coordinating CEA and lateral BST outflow, while areas with few collateralized inputs may contribute to the unique functions of these two regions.
Materials and methods
Animals
Adult male Sprague–Dawley rats (250–300 g BW; Harlan Laboratories, Indianapolis, IN, USA) were individually housed in stainless steel hanging cages in a controlled environment (20–22°C, 12:12 h light:dark cycle; lights off at 1900 h) with ad libitum access to water and pelleted chow (Purina 5001). Experimental protocols were approved by the University of Pittsburgh Institutional Animal Care and Use Committee, and were carried out in accordance with the National Institutes of Health Guide for the Care and Use of Laboratory Animals, with efforts to minimize both the number of animals used and their potential discomfort.
Iontophoretic tracer delivery
Rats were anesthetized by halothane or isoflurane inhalation (Halocarbon Laboratories, River Edge, NJ; 1–3% in oxygen) and oriented into a Kopf stereotaxic device in the flat skull position. Pulled glass pipette tips (~20 µm outer tip diameter) were attached to the arm of the stereotax. A solution of 1% cholera toxin subunit B (CTB; List Biological Labs, Campbell, CA, USA) in 0.1 M phosphate buffer (pH 6.0) or a 1–2% solution of Fluorogold (FG; Fluorochrome, Denver, CO, USA) in 0.1 M cacodylic acid was backfilled through the pipette tip using negative pressure, then a wire connected to a current source (Stoelting) was inserted into the tracer solution. During the descent of the glass pipette into the brain, a −0.5 µA retaining current was used to minimize molecular diffusion of tracer from the pipette tip. CTB was unilaterally iontophoresed into the BSTvl (from bregma: −0.3 posterior, +2.8 lateral, −7.0 ventral; 10° angle) or CEAm (from bregma: −2.1 posterior, +3.9 lateral, −7.8 ventral) using a 7 s on/off pulsed current of +5 µA for 15 min. Afterward, FG was iontophoresed in the corresponding ipsilateral CEAm or BSTvl using the same pulsed current for 5 min. These iontophoretic parameters were based on the results of pilot studies to produce comparably sized tracer delivery sites. After the second tracer was delivered, the pipette was withdrawn and the skin closed with stainless steel clips. Rats were injected subcutaneously with 0.5 ml of a mild analgesic (Ketofen) and were returned to their cages after regaining consciousness and full mobility.
One to two weeks after tracer iontophoresis, rats were anesthetized with an overdose of sodium pentobarbital (Nembutal, 100 mg/kg BW, ip) and then transcardially perfused with 0.15 M NaCl followed by 500 ml of 4% paraformaldehyde. Brains were postfixed in situ overnight at 4°C then removed from the skull and cryoprotected in 20% sucrose solution before sectioning. Brains were sectioned coronally (35 µm) using a freezing microtome. Sections were collected sequentially into six adjacent sets and stored in cryopreservant (Watson et al. 1986) at −20°C for later immunocytochemical processing.
Immunocytochemistry
Two sets of tissue sections from each rat (each set containing sections spaced 210 µm apart) were used for single immunoperoxidase localization of FG and CTB to reveal tracer delivery sites and the distribution of afferent inputs to those sites. For this purpose, tissue sections were incubated overnight in buffer (0.1 M sodium phosphate, pH 7.4) containing 0.3% Triton X-100, 1% normal donkey serum, and either rabbit anti-FG (1:30,000; Millipore, Temecular, CA, USA) or goat anti-CTB (1:50,000, List Biological Labs, Campbell, CA, USA) antisera. Biotinylated secondary antisera (donkey anti-rabbit or donkey antigoat IgG; Jackson Immunochemicals, West Grove, PA, USA) were used at a dilution of 1:500. FG or CTB single immunoperoxidase labeling was revealed using Vectastatin ABC Elite reagents (Vector Laboratories, Burlingame, CA, USA) followed by a diaminobenzidine (DAB)-hydrogen peroxidase reaction to produce a brown immunoprecipitate in the cytoplasm of labeled neurons. In selected cases, additional series of tissue sections were processed for dual immunoperoxidase labeling of either FG or CTB together with the neuronal marker NeuN in order to better define tissue cytoarchitecture. In these cases, FG or CTB immunoperoxidase labeling was revealed by using nickel sulfate in the DAB solution to produce a black immunoprecipitate, followed by a second brown DAB immunoperoxidase reaction after incubating tissue sections in mouse anti-NeuN (1:5,000, Millipore, Temecula, CA, USA) and biotinylated donkey anti-mouse IgG (1:500; Jackson Immunochemicals, West Grove, PA, USA), as described above.
A third set of tissue sections from selected cases with well-placed tracer delivery sites into both the CEAm and the BSTvl was processed for dual immunofluorescent localization of both CTB and FG to identify double-labeled neurons. Tissue sections were incubated for 48–72 h at 4°C in a cocktail of primary antisera at 10 times the concentration used for immunoperoxidase (i.e., FG, 1:3,000; CTB, 1:5,000). Sections were then rinsed in buffer and incubated overnight (at 4°C) in a cocktail of fluorescently tagged secondary antisera [Cy3-conjugated donkey anti-rabbit IgG (1:500) and Cy2-conjugated donkey anti-goat IgG (1:300); both from Jackson Immunochemicals]. Fluorescent labeling of dopamine-beta hydroxylase (DBH) shown in Figs. 1c and 2c was performed following a similar protocol on non-experimental rat brain sections using mouse anti-DBH (1:6,000; Millipore, Billerica, MA, USA) and Cy3-conjugated donkey anti-mouse IgG (1:300; Jackson Immunochemicals).
Immunoperoxidase- or immunofluorescence-labeled tissue sections were rinsed in buffer and mounted onto Superfrost Plus microscope slides (Fisher Scientific), allowed to dry overnight, dehydrated and defatted in graded ethanols and xylene, and coverslipped using Cytoseal 60 (VWR).
BST cytoarchitecture and iontophoresis delivery site analysis
The parcellation and nomenclature of the BST was first described in 1989 by Ju and colleagues based on cyto- and chemoarchitectonic studies of the BST and its surrounding region (Ju and Swanson 1989; Ju et al. 1989). Later anterograde tracing studies using discrete injections of PHA-L into each subnucleus led to an updated parcellation and nomenclature (Dong and Swanson 2006a). In our study, we attempted to iontophoretically target retrograde tracer to the fusiform subnucleus, which receives particularly dense NA input. However, retrograde tracer iontophoresis in the present study produced larger tracer delivery sites compared to those achieved using PHA-L, and so we describe these delivery sites as encompassing the BSTvl. We refer to the BSTvl as including the fusiform subnucleus and subcommissural part of the anterolateral subnucleus, as described in the Swanson atlas (Swanson 2004). In reference to Paxinos and Watson’s atlas, this generally corresponds to the fusiform subnucleus and subcommissural parts of the intermediate, posterior, and ventral subnuclei of the BST’s lateral division (Paxinos and Watson 2007). Shin and colleagues (Shin et al. 2008) used Ju and colleague’s 1989 nomenclature (Ju and Swanson 1989; Ju et al. 1989) in their report; thus, their retrograde tracer delivery sites were described as targeted to the fusiform nucleus but diffusing into the anterodorsal and subcommissural subnuclei (comparable to the subcommissural part of the anterolateral subnucleus as defined by Dong and Swanson), the dorsomedial subnucleus, and the parastrial nucleus (part of the preoptic hypothalamus adjacent to the BST). By comparison, the iontophoretic delivery sites in the present study were similarly targeted within the BSTvl, but avoided diffusion into the dorsomedial subnucleus and parastrial nucleus.
Data plotting and quantitative analysis
One selected case with the most accurate CEAm and BSTvl tracer delivery sites was used to fully document the distribution of retrogradely labeled neurons throughout the rostrocaudal extent of the brain. The distribution of CTB- and FG-positive retrogradely labeled neurons was plotted at 409 magnification using a Nikon light microscope connected to a computerized data acquisition system (StereoInvestigator; MBF Bioscience). Plots were made using two adjacent tissue series separately stained for FG and CTB. First, the distribution of FG-labeled neurons was plotted from one set of sections spaced by 420 µm. Plots of FG-labeled neurons were then matched and aligned to sections from the adjacent CTB-labeled tissue series. CTB-labeled neurons were plotted directly onto the initial FG plots with the digital markers for FG labeling hidden from view to prevent bias while plotting the location of CTB-positive neurons. The composite plots of FG- and CTB-labeled neurons were then overlaid onto corresponding Swanson atlas figures (Swanson 2004) using Adobe Illustrator software.
In the selected plotting case and in two additional cases with the most accurate CEAm and BSTvl tracer delivery sites (see “Results”), brain regions with overlapping distributions of retrogradely labeled neurons were further analyzed in dual immunofluorescence-labeled sections to reveal double-labeled neurons. Labeling was visualized and digitally photographed using an Olympus photomicroscope with a 209 objective and filters to visualize Cy2 and Cy3 fluorescence. Counts of single- and double-labeled neurons within each region of interest were derived from images viewed on a computer screen using Adobe Photoshop software, while visualizing retrogradely labeled neurons within red and green color channels. The number of sections through each region that were photographed and used for cell counting, and the approximate bregma levels of quantified sections, are reported in Table 1. Within each afferent brain region, the percentage of tracer-labeled neurons with collateralized projections was calculated as [collateralized/collateralized + (CEAm-only and/or BSTvl-only)] × 100. Retrograde labeling was subjected to quantitative analysis only in regions which contained dense overlap of CEAm- and BSTvl-projecting neurons.
Table 1.
Counts of single- and double-tracer-labeled neurons across brain regions after iontophoretic delivery of tracers to the CEAm and BSTvl
| Region | Bregma levels | Number of sections |
mCEA only |
vlBNST only |
Collaterals | Coll. % of mCEA |
Coll. % of vlBNST |
Coll. % of total |
|---|---|---|---|---|---|---|---|---|
| Brainstem | ||||||||
| NTS | −14.36 to −13.44 | 5 | 31 ± 10 | 121 ± 2 | 15 ± 5 | 33 ± 4 | 11 ± 4 | 9 ± 3 |
| VLM | −14.36 to −13.44 | 5 | 6 ± 4 | 25 ± 11 | 2 ± 1 | 21 ± 11 | 17 ± 9 | 11 ± 6 |
| Pons | ||||||||
| CLR | −6.85 to −6.50 | 3 | 28 ± 9 | 34 ± 6 | 1 ± 1 | 4 ± 2 | 3 ± 2 | 2 ± 1 |
| DR | −7.90 to −6.65 | 4 | 78 ± 21 | 58 ± 5 | 7 ± 1 | 12 ± 6 | 11 ± 1 | 6 ± 2 |
| PBle | −9.50 to −8.85 | 3 | 249 ± 56 | 81 ± 19 | 49 ± 16 | 16 ± 2 | 39 ± 12 | 12 ± 3 |
| PBlv | −9.80 to −9.50 | 2 | 72 ± 8 | 23 ± 5 | 6 ± 1 | 8 ± 1 | 22 ± 4 | 6 ± 1 |
| PBm | −9.80 to −9.50 | 2 | 133 ± 25 | 39 ± 7 | 6 ± 1 | 4 ± 1 | 13 ± 3 | 3 ± 1 |
| PBw | −9.80 to −9.50 | 2 | 23 ± 3 | 9 ± 2 | 3 ± 1 | 10 ± 2 | 25 ± 10 | 8 ± 2 |
| Forebrain | ||||||||
| AI | −1.08 to +0.45 | 6 | 836 ± 194 | 70 ± 32 | 32 ± 14 | 3 ± 1 | 31 ± 1 | 3 ± 1 |
| BLAp | −4.45 to −3.90 | 3 | 563 ± 117 | 262 ± 47 | 125 ± 38 | 18 ± 2 | 32 ± 6 | 13 ± 2 |
| BMA | −2.45 to −2.00 | 3 | 791 ± 287 | 327 ± 105 | 86 ± 47 | 8 ± 2 | 18 ± 5 | 6 ± 2 |
| ILA | +2.15 to +2.80 | 3 | 87 ± 32 | 120 ± 40 | 9 ± 5 | 8 ± 3 | 6 ± 3 | 3±2 |
| IPAC | −0.83 to +0.45 | 6 | 203 ± 65 | 238 ± 56 | 24 ± 8 | 11 ± 1 | 13 ± 6 | 5 ± 1 |
| PSTN | −4.20 to −3.90 | 3 | 123 ± 51 | 126 ± 15 | 10 ± 4 | 7 ± 2 | 8 ± 3 | 4 ± 2 |
| PVT | −4.20 to −1.08 | 14 | 559 ± 101 | 588 ± 29 | 58 ± 17 | 9 ± 1 | 9 ± 2 | 5 ± 1 |
| cPVT | −4.20 to −3.50 | 5 | 369 ± 54 | 212 ± 13 | 33 ± 8 | 8 ± 1 | 13 ± 2 | 5 ± 1 |
| mPVT | −3.25 to −2.00 | 4 | 146 ± 28 | 141 ± 5 | 16 ± 3 | 10 ± 0 | 10 ± 1 | 5±0 |
| rPVT | −1.90 to −1.08 | 5 | 190 ± 48 | 376 ± 21 | 25 ± 9 | 11 ± 2 | 6 ± 2 | 4 ± 2 |
| TR | −4.45 to −3.90 | 3 | 660 ± 86 | 171 ± 54 | 21 ± 9 | 3 ± 1 | 10 ± 1 | 2 ± 1 |
Retrogradely labeled neurons were counted in regions that contained overlapping distributions of CEAm- and BSTvl-projecting neurons. For each case (n = 3), the number of sections through each region that were used for cell counting is indicated. Within each brain region, the total number of retrogradely labeled neurons identified as CEAm-projecting, BSTvl-projecting, or collateralized (i.e., double-labeled) are indicated (mean ± SE). The final two columns indicate collateralized neurons within each brain region expressed as a percentage of all neurons projecting to the CEAm, to the BSTvl, or to either region
Neuroanatomical regions and nomenclature were defined using Swanson’s rat brain atlas (Swanson 2004). For each quantified brain region, statistical comparisons of the number of neurons projecting to the CEAm or BSTvl were performed using Student’s t test. Rostrocaudal distribution of retrograde labeling within the NTS and para-ventricular thalamus (PVT) was analyzed using two-way ANOVA with rostrocaudal level and tracer target site (CEAm or BSTvl) as independent variables. Differences were considered significant when P < 0.05.
Results
Iontophoretic tracer delivery sites
Three rats (cases 09-133, 09-110, and 10-9) with dual iontophoretic delivery sites that were most accurately targeted and restricted to the CEAm and BSTvl were selected for quantitative analysis of retrograde labeling. In cases 09-110 and 09-133, FG was iontophoresed into the CEAm (see Fig. 1c) and CTB was iontophoresed into the BSTvl (see Fig. 2c). In case 10-9, the tracers delivered into each target were switched (see Figs. 1a, 2a). Retrograde labeling patterns were consistent across these three cases, although the actual numbers of retrogradely labeled neurons varied (Table 1). Different patterns of retrograde labeling resulted from tracer delivery sites that “missed” the CEAm and BSTvl, and were instead centered in closely adjacent regions. Those findings are presented at the end of the results section.
Of the three selected cases with the most accurate tracer delivery sites, case 09-133 consistently had the largest number of retrogradely labeled neurons across quantified brain regions. This representative case was used to digitally plot the distribution of tracer-labeled neurons projecting to the CEAm and BSTvl (see Figs. 3–12).
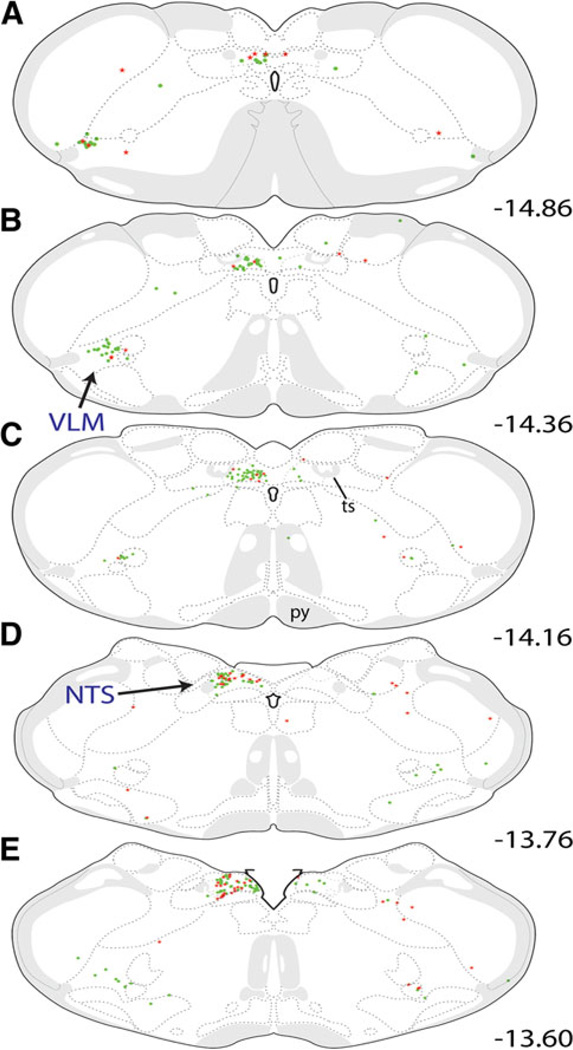
Fig. 3.
Distribution maps of retrogradely labeled neurons within the caudal medulla. CEAm- and BSTvl-projecting neurons were located throughout the caudal NTS and VLM, but were most prevalent between bregma levels −14.86 and −13.60 (a–e). The number of BSTvl-projecting NTS neurons (green circles) peaked at the mid-AP level (c; bregma level −14.16) while CEAm-projecting NTS neurons (red stars) were most prevalent at a slightly more rostral level (e; see Fig. 4 for rostrocaudal quantitative data). Within the VLM, the distribution of BSTvl-projecting neurons did not appear to differ across rostrocaudal levels. CEAm-projecting VLM neurons were relatively scarce whereas BSTvl-projecting VLM neurons were more common. See Table 1 for quantification of overall NTS and VLM retrograde labeling and the incidence of double-labeled neurons with collateralized projections to both regions
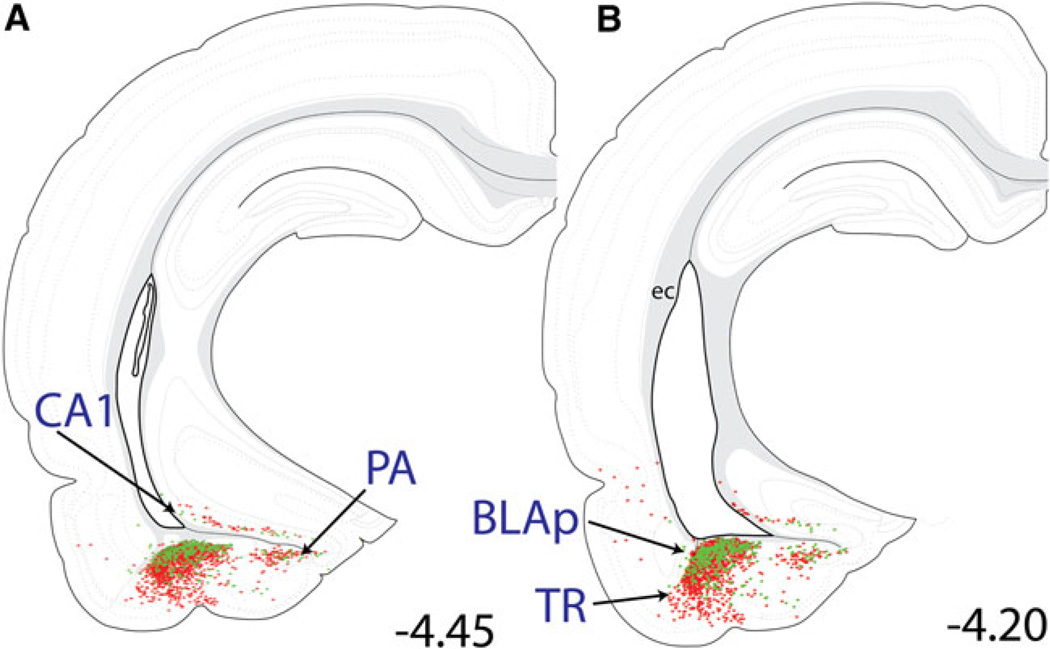
Fig. 12.
Distribution maps of retrogradely labeled neurons within the temporal cortex/posterior amygdala. large numbers of retrogradely labeled neurons were present within the BLAp and PA of the amygdala, TR of the cortex, and CA1 region of the ventral hippocampus. large numbers of CEAm-projecting neurons (red stars) were located within both the BLAp and TR, while the BLAp contained predominantly BSTvl-projecting neurons (green circles). Smaller numbers of CEAm- and BSTvl-projecting neurons were present within the PA and CA1 region. See Table 1 for quantification of overall BLAp retrograde labeling, and the incidence of double-labeled BLAp neurons with collateralized projections to both the CEAm and BSTvl
In general, the large majority of brain regions that contained CEAm-projecting neurons also contained BSTvl-projecting neurons, and vice versa. However, and as described in more detail in the following sections, some regions projected primarily to the CEAm with comparably less input to the BSTvl (e.g., insular cortex). Some regions displayed the opposite pattern, with relatively more input to the BSTvl compared to the CEAm (e.g., NTS), while some brain regions projected equivalently to both the CEAm and the BSTvl (e.g., PVT). Across all the regions in which retrograde labeling was quantified, double-labeled neurons with axonal projections to both the CEAm and the BSTvl accounted for as little as 2% to as much as 13% of the total population of tracer-labeled neurons (Table 1). The distribution of retrograde labeling is plotted in Figs. 3–10, in which red stars represent individual CEAm-projecting neurons, and green circles represent BSTvl-projecting neurons.
Fig. 10.
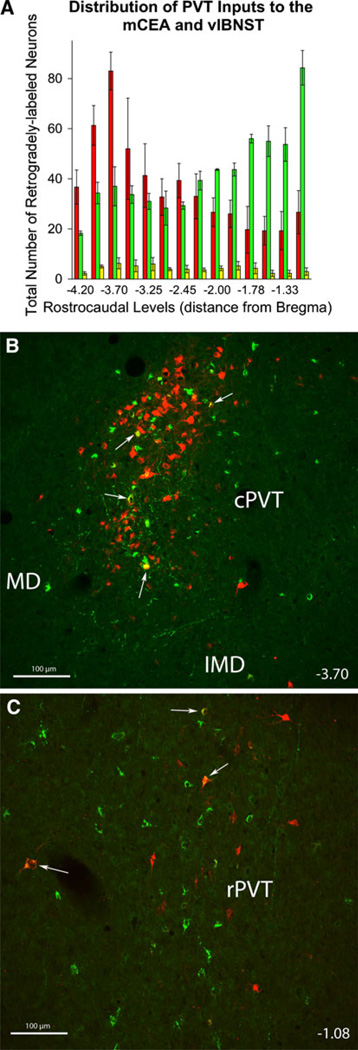
Rostrocaudal distribution of retrogradely labeled neurons within the PVT. a larger numbers of CEAm-projecting neurons (red) were located within the cPVT (−4.20 to −3.50), while larger numbers of BSTvl-projecting neurons (green) were located within the rPVT (−1.90 to −1.08). Similar numbers of CEAm- and BSTvl-projecting neurons were present in the mPVT (−3.25 to −2.00). Double-labeled neurons with collateralized axonal projections to both the CEAm and BSTvl (yellow) were distributed relatively evenly across rostrocaudal levels (see also Table 1). b Confocal z-stack image image of retrogradely labeled neurons within the cPVT in case 09-133 (bregma level −3.70). FG-positive CEAm-projecting neurons (red) were significantly more prevalent than CTB-positive BSTvl-projecting neurons (green) within the cPVT (b). Double-labeled neurons are identified by white arrows. c Confocal z-stack image of retrogradely labeled neurons within the rPVT in the same case (09-133; bregma level −1.08). CTB-positive BSTvl-projecting neurons (green) were significantly more prevalent than FG-positive CEAm-projecting neurons (red) within the rPVT. Double-labeled neurons are identified by white arrows. Scale bars for b and c = 200 µm
Medulla
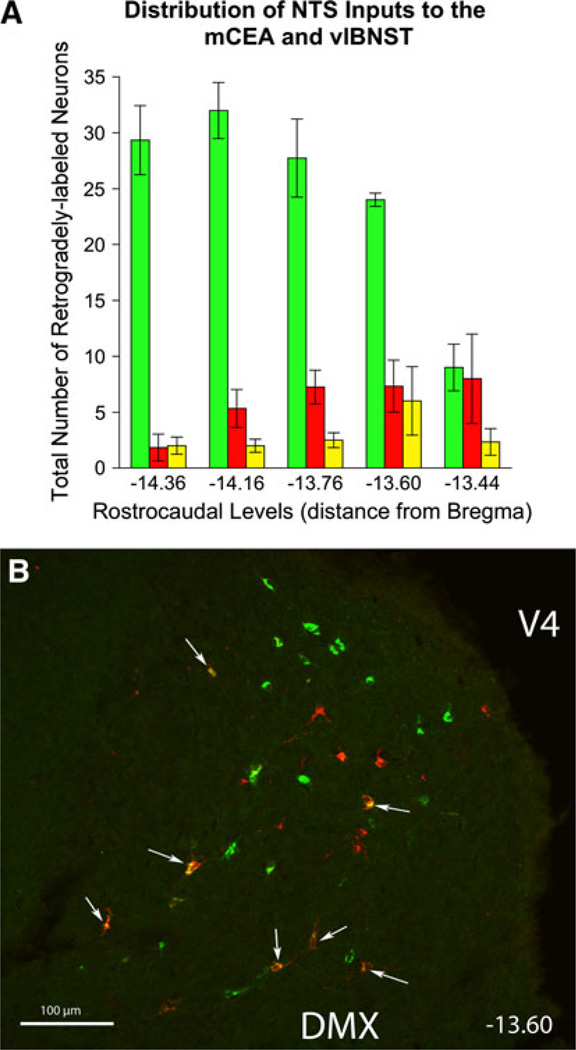
Retrogradely labeled neurons in the medulla were located primarily within the caudal, visceral portion of the NTS and the caudal VLM ipsilateral to the tracer delivery sites. Significantly more NTS neurons projected to the BSTvl compared to the number of NTS neurons projecting to the CEAm (136 ± 6 vs. 46 ± 15 neurons; P = 0.005). Rostrocaudal analysis of retrograde labeling patterns revealed a different distribution of BSTvl- versus CEAm-projecting NTS neurons (Figs. 3, 4). Two-way ANOVA revealed a significant effect of both tracer target site [F(1, 29) = 90.39, P < 0.001] and rostrocaudal NTS level [F(4, 29) = 4.26, P < 0.05] on the number of retrogradely labeled NTS neurons, as well as a significant interaction between tracer target site and rostrocaudal level [F(4, 29) = 6.17, P < 0.01]. At levels caudal to the area postrema (AP), the NTS contained relatively few CEAm-projecting neurons (red stars in Fig. 3a, b). The number of CEAm-projecting NTS neurons increased at more rostral levels, reaching a peak just rostral to the AP (Figs. 3e, 4). Conversely, the number of BSTvl-projecting NTS neurons reached a peak at the mid-AP level (green circles, Figs. 3c, 4). NTS neurons with collateralized projections to both the CEAm and BSTvl were most prevalent in sections just rostral to the AP (Fig. 4). Approximately 9% of all tracer-labeled NTS neurons were double-labeled (Table 1). Overall, 33 ± 4% of all CEAm-projecting NTS neurons collateralized to also provide input to the BSTvl, whereas only 11 ± 4% of all BSTvl-projecting NTS neurons collateralized to innervate the CEAm (Table 1).
Fig. 4.
Rostrocaudal distribution of retrogradely labeled NTS neurons. a The number of BSTvl-projecting neurons (green) peaked at the mid-AP section level (−14.16 mm from bregma), while smaller numbers of CEAm-projecting neurons (red) were distributed somewhat more rostrally, similar to the peak distribution of double-labeled neurons (yellow). b Confocal z-stack image of the retrograde labeling within the NTS in case 09-133 (bregma level −13.60, see Fig. 3e). FG-positive CEAm-projecting neurons are red; CTB-positive BSTvl-projecting neurons are green. White arrows point out several double-labeled neurons whose axons project to both the CEAm and BSTvl. Scale bars 250 µm
Retrogradely labeled VLM neurons were present at the same rostrocaudal levels as retrogradely labeled NTS neurons (Fig. 3). Quantification of labeling within the VLM revealed a nonsignificant trend towards a greater number of BSTvl- versus CEAm-projecting neurons (25 ±11 vs. 8 ± 4 neurons; P = 0.63). VLM neurons projecting to the CEAm or BSTvl were distributed uniformly across rostrocaudal levels, and moderate numbers of double-labeled neurons with collateralized projections to both the CEAm and BSTvl were observed (Table 1). Approximately 11% of all tracer-labeled VLM neurons were double-labeled, similar to proportions of double-labeled neurons within the NTS (Table 1).
Pons
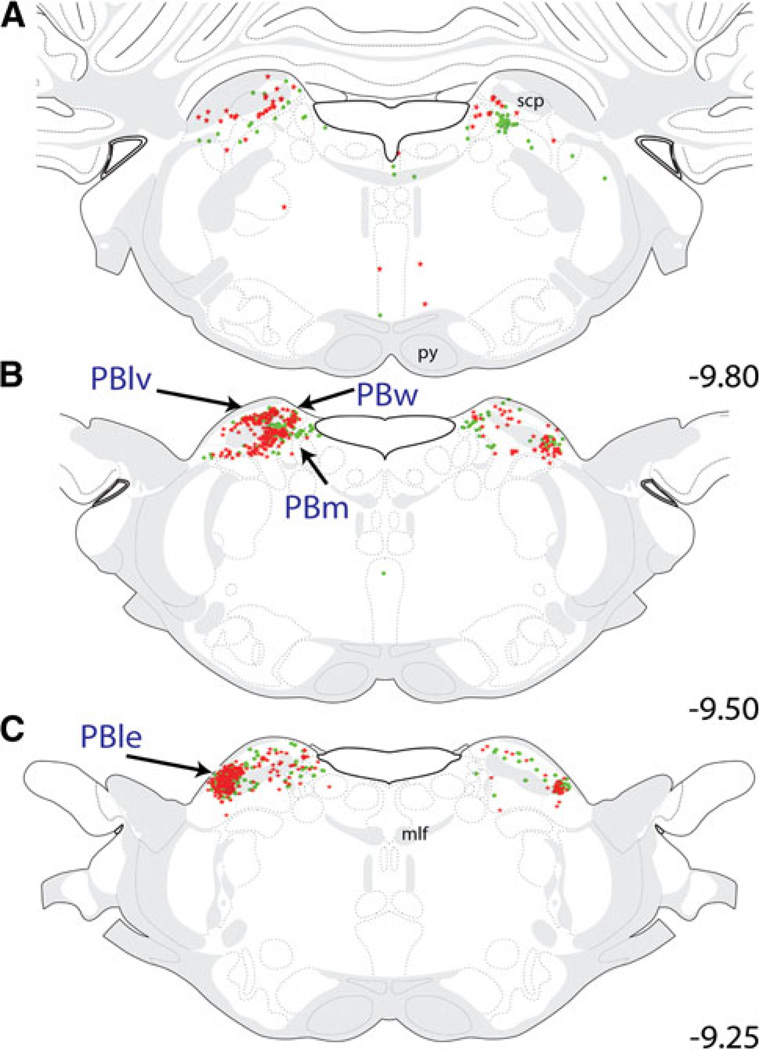
Pontine input to the CEAm and BSTvl was predominantly confined to the parabrachial nucleus (PB; Fig. 5). The locus coeruleus contained a small number of CEAm- and BSTvl-projecting neurons (i.e., 1–3 neurons per section, data not shown). Retrogradely labeled neurons were distributed bilaterally within several PB subnuclei, although a strong ipsilateral predominance of labeling was evident (Fig. 5). At the caudal end of the PB (Fig. 5a, b), retrograde labeling within the PB was heavily concentrated within the ventral lateral (PBlv), medial (PBm), and waist subnuclei (PBw). Within these subnuclei, CEAm-projecting neurons significantly outnumbered BSTvl-projecting neurons (PBlv = 79 ± 9 vs. 29 ± 6 neurons; P = 0.01; PBm = 139 ± 25 vs. 45 ± 7 neurons; P = 0.02; PBw = 25 ± 4 vs. 11 ± 1 neurons; P = 0.04). Relatively few (i.e., approximately 6 ± 1, 3 ± 1, and 8 ± 2%) of all tracer-labeled neurons within the PBlv, PBm, and PBw were double-labeled (Table 1). More rostral levels of the PB (Fig. 5c) contained larger numbers of CEAm- and BSTvl-projecting neurons that were primarily localized within the external lateral PB subnucleus (PBle; see Fig. 13a), with fewer retrogradely labeled neurons present within the PBlv, PBm, and PBw. Quantification revealed a nonsignificant trend towards larger numbers of PBle neurons projecting to the CEAm versus the BSTvl (298 ± 72 vs. 130 ± 9 neurons; P = 0.08). In contrast to other PB subnuclei, many of the retrogradely labeled PBle neurons collateralized to innervate both the CEAm and BSTvl: approximately 12 ± 3% of all tracer-labeled PBle neurons were double-labeled (Table 1). When double-labeled neurons were excluded, significantly more single-labeled PBle neurons projected to the CEAm compared to the number that projected to the BSTvl (Table 1; P < 0.05).
Fig. 5.
Distribution maps of retrogradely labeled pontine neurons, which were primarily located in the PB between bregma levels −9.80 and −9.25. Generally, CEAm-projecting PB neurons (red stars) were more prevalent than BSTvl-projecting PB neurons (green circles). At caudal levels (a and b), the majority of retrograde labeling was observed in the PBlv, PBw, and PBm. At more rostral levels (c), large numbers of retrogradely labeled neurons were located bilaterally within the PBle. See Table 1 for quantification of overall PB subnuclear retrograde labeling and the incidence of double-labeled neurons with collateralized projections to both the CEAm and BSTvl
Fig. 13.
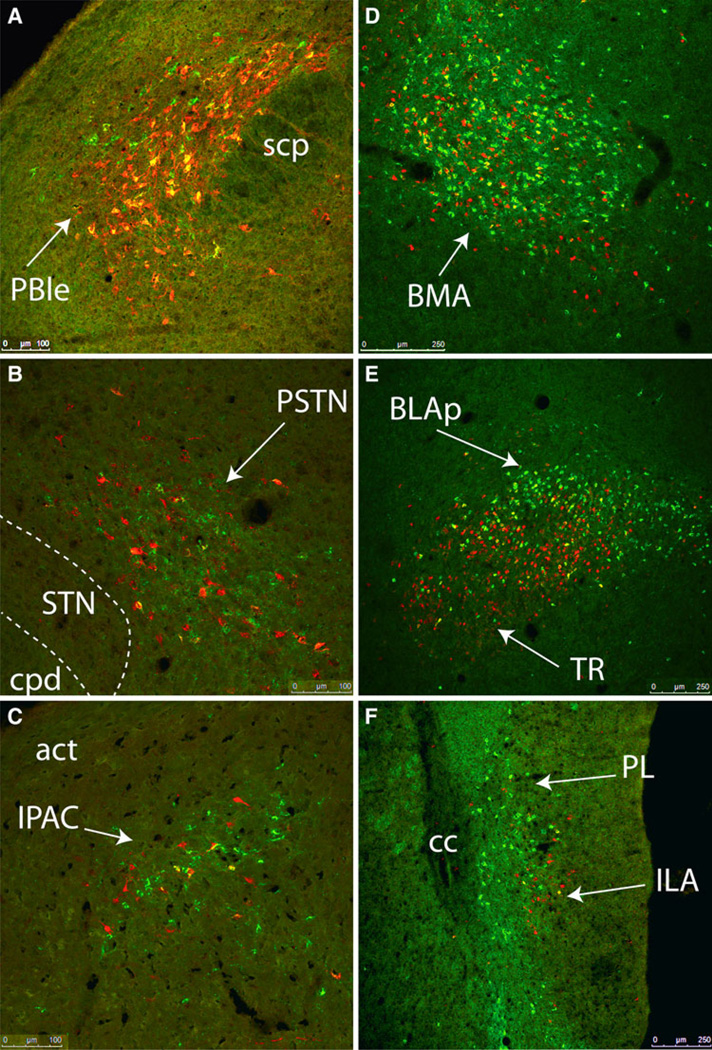
Confocal z-stack images of selected brain regions containing large numbers of CEAm- and BSTvl-projecting neurons and a relatively high incidence of double-labeling: PBle (a, compare to Fig. 5c), BMA (d, compare to Fig. 8b), and BLAp (e, compare to Fig. 12b). Conversely, despite the presence of large numbers of retrogradely labeled neurons projecting to the CEAm or BSTvl, relatively few double-labeled neurons were observed within the PSTN (b, compare to Fig. 7e), IPAC (c, compare to Fig. 9b), or Ila (f, compare to Fig. 11d). See Table 1 for quantitative data. Scale bars 100 µm in a–c, 250 µm for d–f
Midbrain
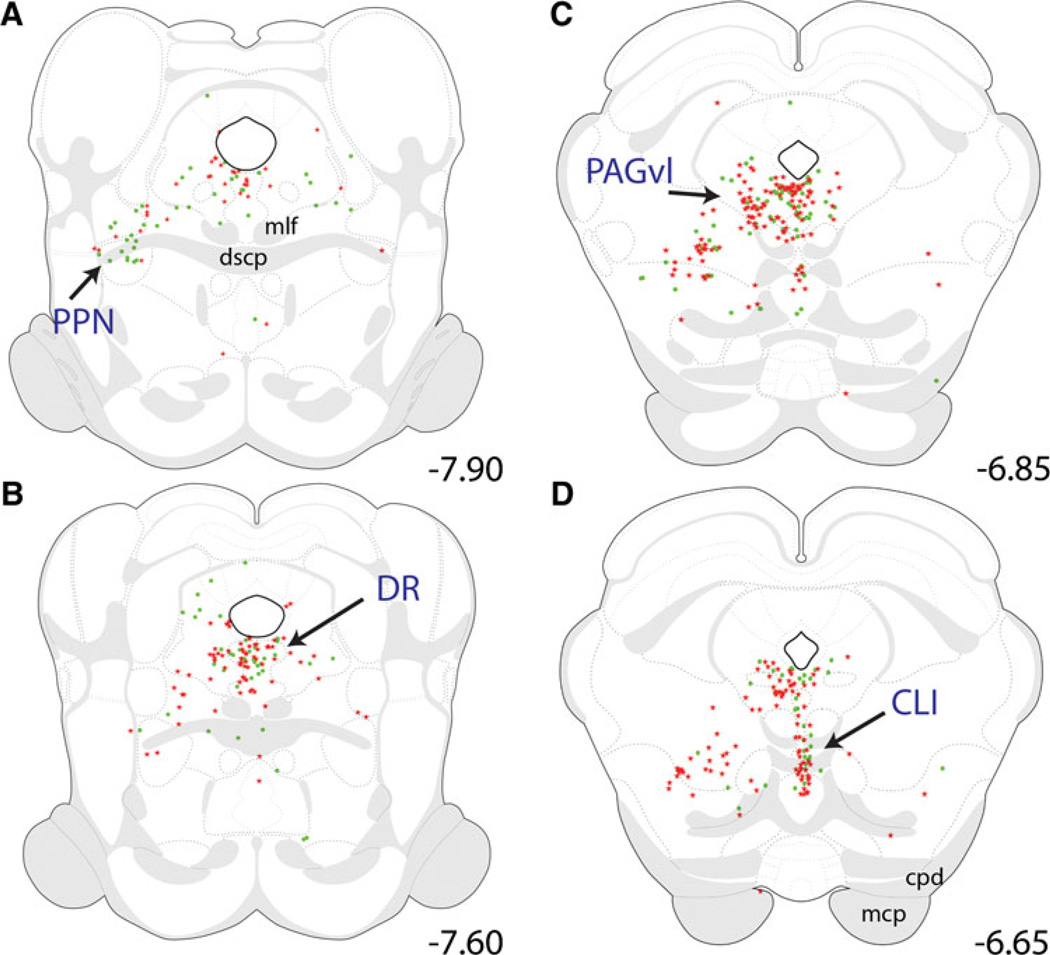
Within the caudal midbrain (Fig. 6a – c), CEAm- and BSTvl-projecting neurons were distributed ventral to the central aqueduct, within the pedunculopontine nucleus (PPN), dorsal raphé (DR), and ventral lateral periaqu-eductal gray (PAGvl). Within the DR, there was no significant difference between the numbers of CEAm- and BSTvl-projecting neurons (77 ± 20 vs. 65 ± 6 neurons; P = 0.61), and relatively few tracer-labeled DR neurons (7 ± 1 neurons, 6 ± 2% of total) had collateralized projections to both the CEAm and BSTvl (Table 1). In more rostral midbrain sections, retrograde labeling extended ventrally to include the central linear raphé (CLI; Fig. 6c, d). There was no significant difference between the number of CEAm- and BSTvl-projecting CLI neurons (29 ± 9 vs. 35 ± 6 neurons; P = 0.62), and there was very little collateralization of individual CLI neurons to both the CEAm and BSTvl (Table 1).
Fig. 6.
Distribution maps of retrogradely labeled neurons within the caudal midbrain. Retrogradely labeled neurons were located within the PPN, DR, PAGvl, and CLI from bregma levels −7.90 to −6.65. a Within the PPN, most retrogradely labeled neurons were BSTvl-projecting (green circles) preferentially located near the rostral end of the PPN. At more rostral levels (b and c), large numbers of retrogradely labeled neurons occupied the region just ventral to the cerebral aqueduct, which includes the DR along the midline and the PAGvl more laterally. Further rostral (d), retrograde labeling extended ventrally along the midline to include neurons within the CLI. Within the DR and CLI, similar numbers of neurons were CEAm-projecting (red stars) and BSTvl-projecting. See Table 1 for quantification of overall PB retrograde labeling within the DR and CLI, and the incidence of double-labeled neurons with collateralized projections to both the CEAm and BSTvl
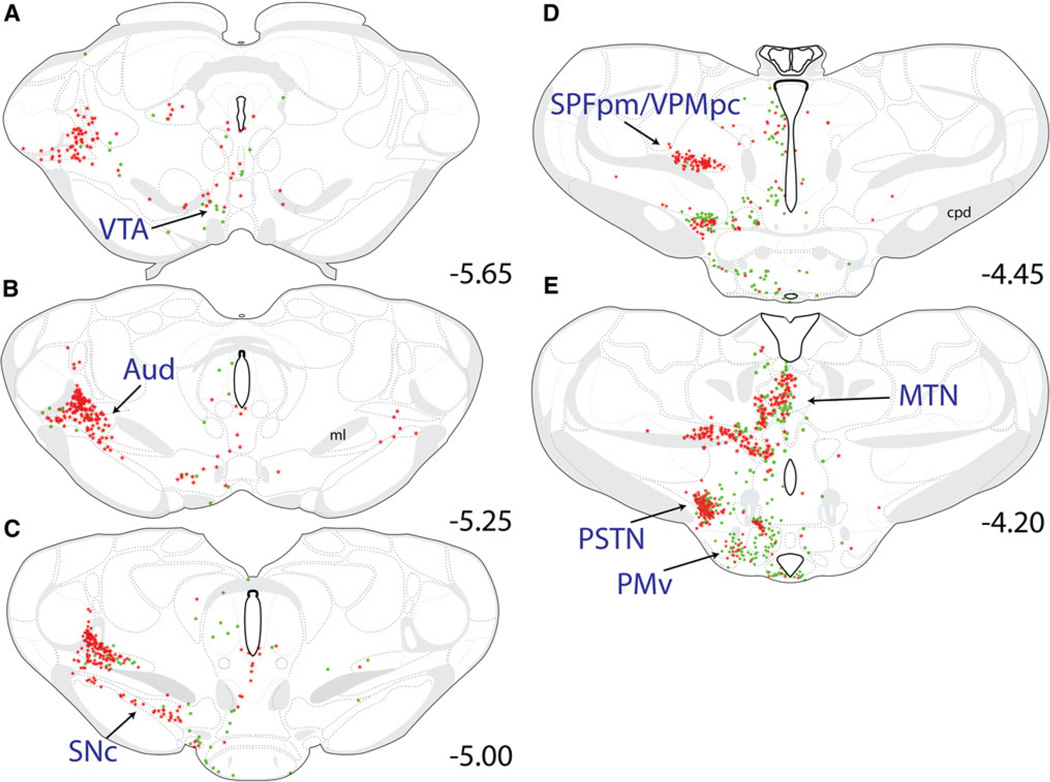
Rostral to the midbrain CLI, CEAm- and/or BSTvl-projecting neurons were located within the ventral tegmental area (VTA; Fig. 7a, b) and the compact portion of the sub-stantia nigra (SNc; Fig. 7c). Retrograde labeling within the VTA was very sparse and was not quantified. The SNc contained a fair number of CEAm-projecting neurons (not quantified, Fig. 7c), but no BSTvl-projecting neurons.
Fig. 7.
Distribution maps of retrogradely labeled neurons within the rostral midbrain/caudal forebrain. a–c Retrogradely labeled rostral midbrain neurons were located primarily within the SNc and VTA between bregma levels −5.65 and −5.00. Both CEAm-projecting (red stars) and BSTvl-projecting neurons (green circles) were scattered within the VTA (a and b), while only CEAm-projecting neurons were located within the SNc (c). Within the caudal thalamus (a–e), dense clusters of CEAm-projecting neurons were observed within the Aud (a–c), the SPFpm/VPMpc (d), and the MTN (e), with relatively fewer BSTvl-projecting neurons in each region. Within the caudal hypothalamus (c–e), retrogradely labeled neurons were located within the PSTN and PMv. The PMv contained predominantly BSTvl-projecting neurons and fewer CEAm-projecting neurons, whereas the PSTN contained similar numbers of BSTvl- and CEAm-projecting neurons. See Table 1 for quantification of overall PSTN retrograde labeling, and the incidence of double-labeled neurons with collateralized projections to both the CEAm and BSTvl
Thalamus
Projections to the CEAm and BSTvl were found throughout the rostrocaudal extent of the thalamus (Figs. 7–9) with large numbers of retrogradely labeled neurons within more caudally located thalamic nuclei (Fig. 7a – e). In general, thalamic CEAm-projecting neurons were more prevalent than BSTvl-projecting neurons. At caudal levels, many CEAm-projecting and few BSTvl-projecting neurons were present within the auditory thalamus (Aud; Fig. 7a – c). In more rostral sections (Fig. 7d), primarily CEA-projecting neurons were present within the medial parvicellular subparafascicular nucleus (SPFpm) and the parvicellular ventral posteromedial nucleus (VPMpc). Further rostrally, retrogradely labeled neurons extended more medially to join the midline thalamic nuclei group (MTN; Fig. 7e), including the central medial nucleus, intermediodorsal nucleus, and the PVT. CEAm- and BSTvl-projecting neurons were distributed throughout the rostrocaudal extent of the MTN (Figs. 7e–8b), but were most numerous within the PVT. When the PVT was considered as a whole, there was no significant difference between the number of CEAm- versus BSTvl-projecting neurons (618 ± 117 vs. 646 ± 35 neurons; P = 0.83). Two-way ANOVA revealed a significant effect of PVT rostrocaudal level [F(1, 83) = 2.75, P < 0.01] and an interaction between tracer target site and PVT rostrocaudal level [F(13, 83) = 6.45, P < 0.001]. When the PVT was divided into three rostrocaudal segments, there was a clear difference in the distribution of CEAm- versus BSTvl-projecting neurons across the caudal, middle, and rostral thirds of the PVT (cPVT = caudal to bregma level −3.25; mPVT = bregma levels −2.85 through −2.00; rPVT = rostral to bregma level −2.00; Fig. 9). Significantly larger numbers of BSTvl-projecting neurons were located within the rPVT compared to either the mPVT (310 ± 18 vs. 157 ± 7 neurons, P < 0.005) or the cPVT (310 ± 18 vs. 179 ± 12 neurons, P < 0.005). Conversely, the number of CEAm afferents within the cPVT was significantly greater than within the mPVT (320 ± 47 vs. 162 ±31 neurons, P < 0.05), but was not greater compared to the number of CEAm afferents in the rPVT (320 ± 47 vs. 196 ± 19 neurons, P = 0.72). Further analysis of retrograde labeling across the three rostrocaudal PVT levels revealed that the cPVT contained significantly greater numbers of CEAm afferents compared to BSTvl afferents (320 ± 47 vs. 179 ± 12 neurons, P < 0.05), while the rPVT contained a significantly greater number of BSTvl afferents compared to CEAm afferents (310 ± 18 vs. 135 ± 42 neurons, P = 0.02). The numbers of CEAm and BSTvl afferents within the mPVT were not significantly different (162 ± 31 vs. 157 ± 7 neurons, P = 0.87).
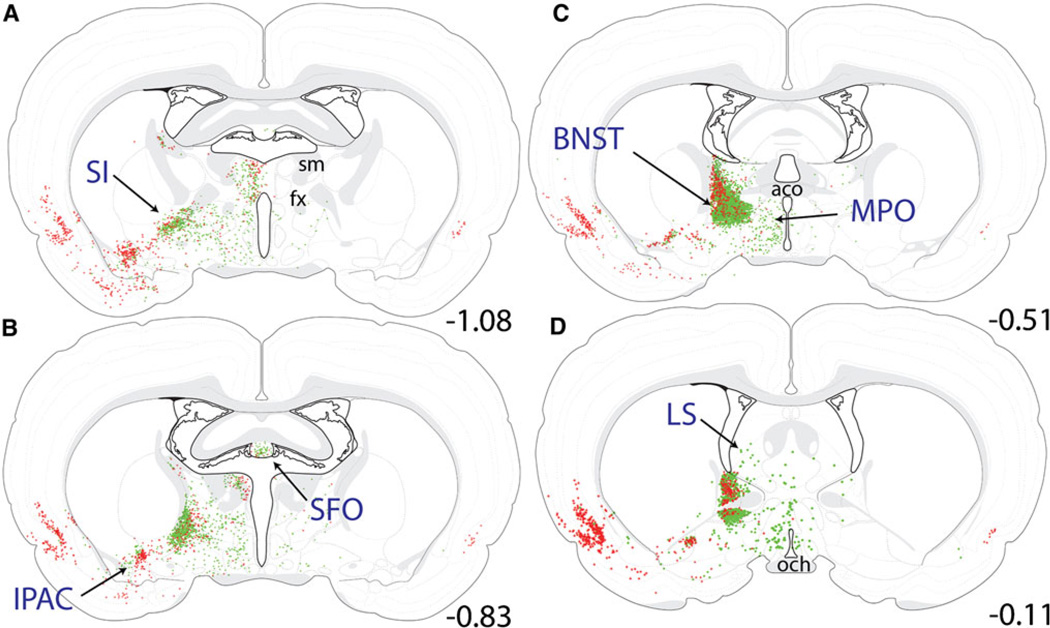
Fig. 9.
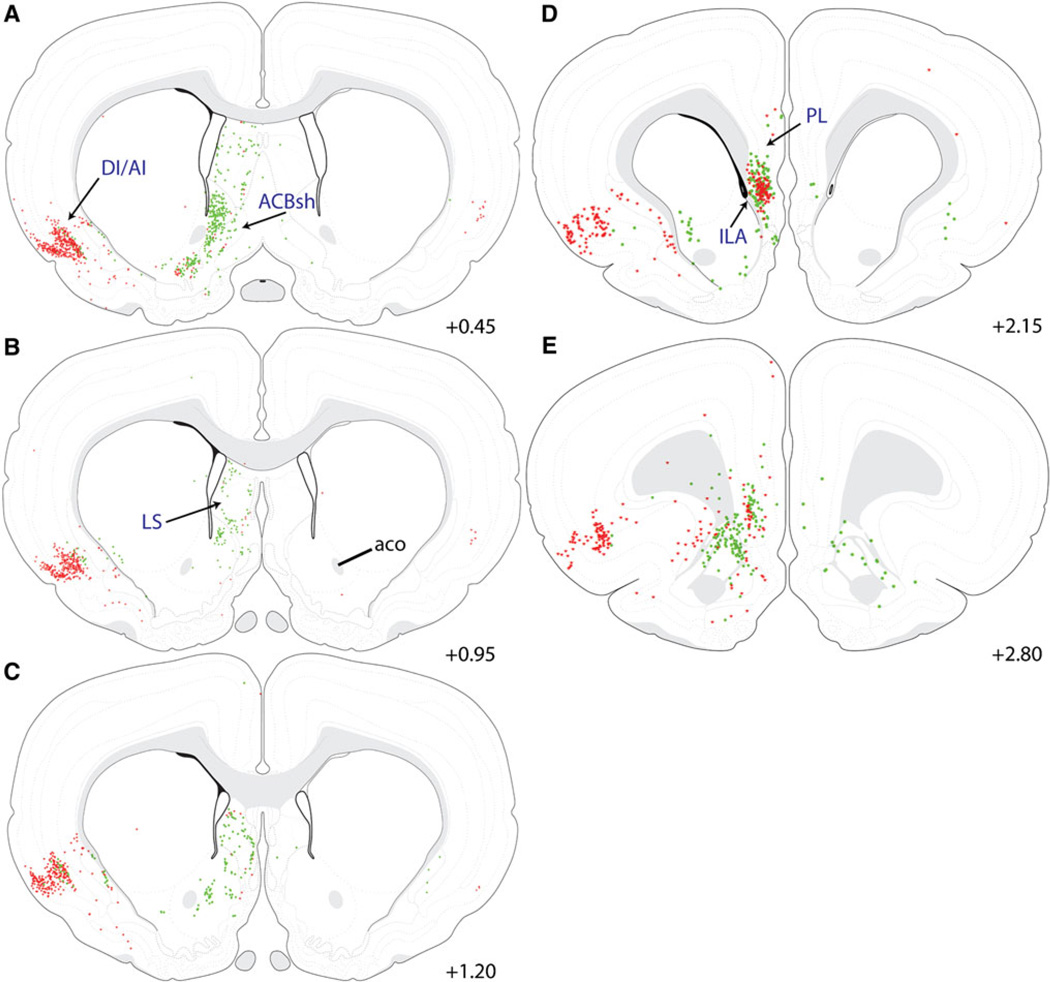
Distribution maps of retrogradely labeled forebrain neurons at the level of the preoptic hypothalamus. Retrogradely labeled neurons were located within the SI, IPAC, BST, SFO, and LS of the basal forebrain; the MPO of the hypothalamus, and the DI/AI region of the cortex. Iontophoretic CTB delivery produced a spherical deposit centered within the BSTvl that retrogradely labeled many neurons within the BSTdl (c, d). CEAm-projecting (red stars) and BSTvl-projecting neurons (green circles) were scattered throughout the SI, but formed a dense cluster within the IPAC (a–d). The SFO (b), MPO (a–d), and LS (d) contained many BSTvl-projecting neurons and fewer CEAm-projecting neurons (retrograde labeling within the more rostral LS is shown in Fig. 9). See Table 1 for quantification of overall AI and IPAC retrograde labeling, and the incidence of double-labeled neurons within each region having collateralized projections to both the CEAm and BSTvl
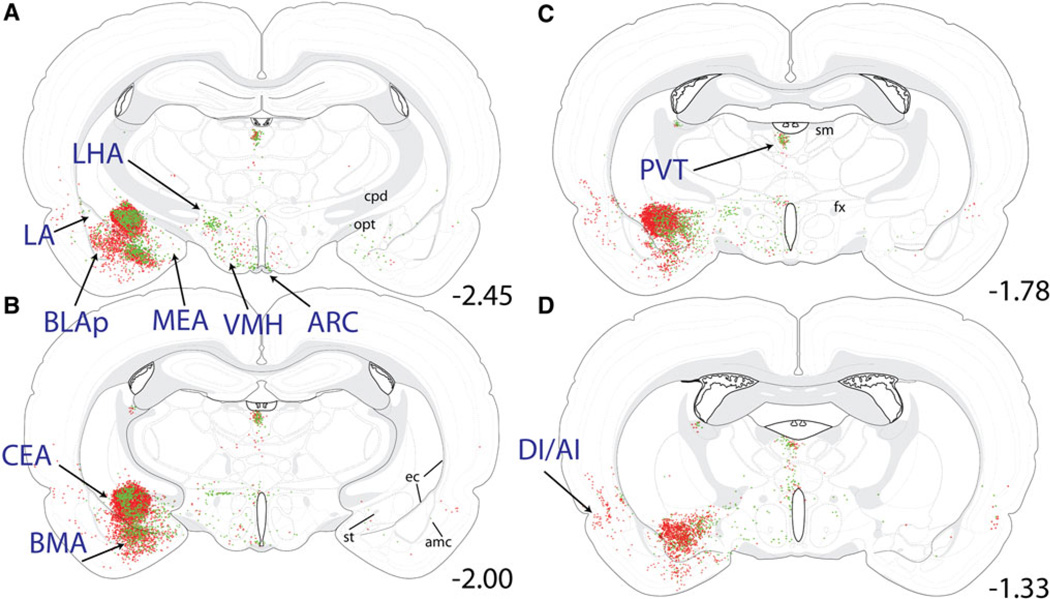
Fig. 8.
Distribution maps of retrogradely labeled forebrain neurons at the level of the tuberal hypothalamus. Retrogradely labeled neurons were located primarily within the CEA, BMA, and BLAp of the amygdala; within the LHA, VMH, and ARC of the hypothalamus; within the PVT of the thalamus; and within the DI/AI region of the cortex. The iontophoretic FG delivery site within the CEA (a–c) labeled large numbers of CEAm-projecting neurons (red stars) whose distribution within the BMA and BLAp overlapped with many BSTvl-projecting neurons (green circles; more caudal sections through the BLAp are shown in Fig. 10). Few retrogradely labeled neurons were located within the la or MEA (a). Within the hypothalamus, BSTvl-projecting neurons were prevalent within the LHA, VMH, and ARC, which contained fewer CEAm-projecting neurons (a–d). Retrogradely labeled thalamic neurons were clustered within the PVT, with smaller numbers of retrogradely labeled neurons scattered ventrally along the midline (a–d; additional retrograde labeling within the more rostral PVT is shown in Fig. 8). The cortical DI/AI contained large numbers of CEAm-projecting neurons and fewer BSTvl-projecting neurons (a–d; additional retrograde labeling within AI/DI is shown in Figs. 8, 9). See Table 1 for quantification of overall AI, PVT, BLAp, and BMA retrograde labeling, and the incidence of double-labeled neurons within each region having collateralized projections to both the CEAm and BSTvl
Hypothalamus
Hypothalamic regions generally contained many BSTvl-projecting neurons and smaller numbers of CEAm-projecting neurons. The hypothalamic distribution of these populations rarely overlapped, and therefore, were plotted (see Figs. 8, 9) but not quantified. The density of BSTvl-projecting neurons in the hypothalamus appeared greatest within the lateral hypothalamic area (LHA; Fig. 8a) and the medial preoptic area (MPO; Fig. 9c). However, one exception to the largely separate hypothalamic distribution of BSTvl- and CEAm-projecting neurons was the parasubthalamic nucleus (PSTN; Fig. 7e, Fig. 13b), which contained similar numbers of CEAm- and BSTvl-projecting neurons (133 ± 54 vs. 136 ± 11 neurons, P = 0.96). Interestingly, despite the dense overlapping distribution of CEAm- and BSTvl-projecting PSTN neurons, relatively few were double-labeled (10 ± 4 neurons, 4 ± 2% of total; Table 1).
Basal forebrain
Within the amygdala, large numbers of CEAm- and BSTvl-projecting neurons were located within the posterior basolateral amygdala (BLAp; Figs. 8a, 12b, 13e) and basomedial amygdala (BMA; Figs. 10a, 13d), while relatively fewer retrogradely labeled neurons were present within the lateral or medial amygdala (Fig. 10a). There was a non-significant trend towards higher numbers of CEAm-versus BSTvl-projecting BLAp neurons (689 ± 155 vs. 388 ± 76 neurons; P = 0.16). Collateralized projections of BLAp neurons to both the CEAm and BSTvl were relatively common. Approximately one-third of BSTvl-projecting neurons and 20% of CEAm-projecting neurons within the BLAp were double labeled (13 ± 2% of total retrogradely labeled neurons, Table 1). In contrast, despite similarly large numbers of CEAm- and BSTvl-projecting neurons within the BMA (877 ± 334 vs. 413 ± 151 neurons; P = 0.27; Table 1), smaller proportions of these neurons were double-labeled as compared to the BLAp (6 ± 2% of total retrogradely labeled neurons, Table 1).
As expected, iontophoresis of retrograde tracer into the CEAm produced abundant retrograde labeling within the BSTvl, and vice versa, as well as retrograde labeling within other regions of the extended amygdala (Figs. 1b, 2b, 8, 9). CEAm-projecting neurons were located throughout the lateral BST, and BSTvl-projecting neurons were found throughout the CEAm and CEAl. Additional CEAm- and BSTvl-projecting neurons were scattered throughout the substantia innominata (SI; Fig. 9a), a region interposed rostrocaudally between the CEA and BST and described as part of the “central extended amygdala” (de Olmos and Heimer 1999). In addition, a dense cluster of CEAm- and BSTvl-projecting neurons was located within a discrete subregion of the SI called the interstitial nucleus of the posterior limb of the anterior commissure (IPAC; Figs. 9b, 13c) (Shammah-lagnado et al. 2001). Quantification of retrogradely labeled IPAC neurons revealed no significant difference between the number of CEAm and BSTvl afferents (227 ± 73 vs. 262 ± 48 neurons; P = 0.71). A moderate proportion of IPAC neurons projected axons to both the CEAm and BSTvl (Table 1). The caudal part of the nucleus accumbens shell (ACBsh), particularly its dorsal medial tip, contained large numbers of BSTvl-projecting neurons but relatively few CEAm-projecting neurons (Fig. 11a).
Fig. 11.
Distribution maps of retrogradely labeled neurons within the rostral forebrain. Retrograde labeling within the basal forebrain was located primarily within the ACBsh and LS, and cortical labeling was located within DI/AI and Ila. The ACBsh and LS contained primarily BSTvl-projecting neurons (green circles), while the DI/AI contained predominantly CEAm-projecting neurons (red stars). Large numbers of both CEAm- and BSTvl-projecting neurons were located within the Ila of the medial prefrontal cortex, whereas retrograde labeling within PL was much more sparse (d). See Table 1 for quantification of overall AI and Ila retrograde labeling, and the incidence of double-labeled neurons within each region having collateralized projections to both the CEAm and BSTvl
Cerebral cortex
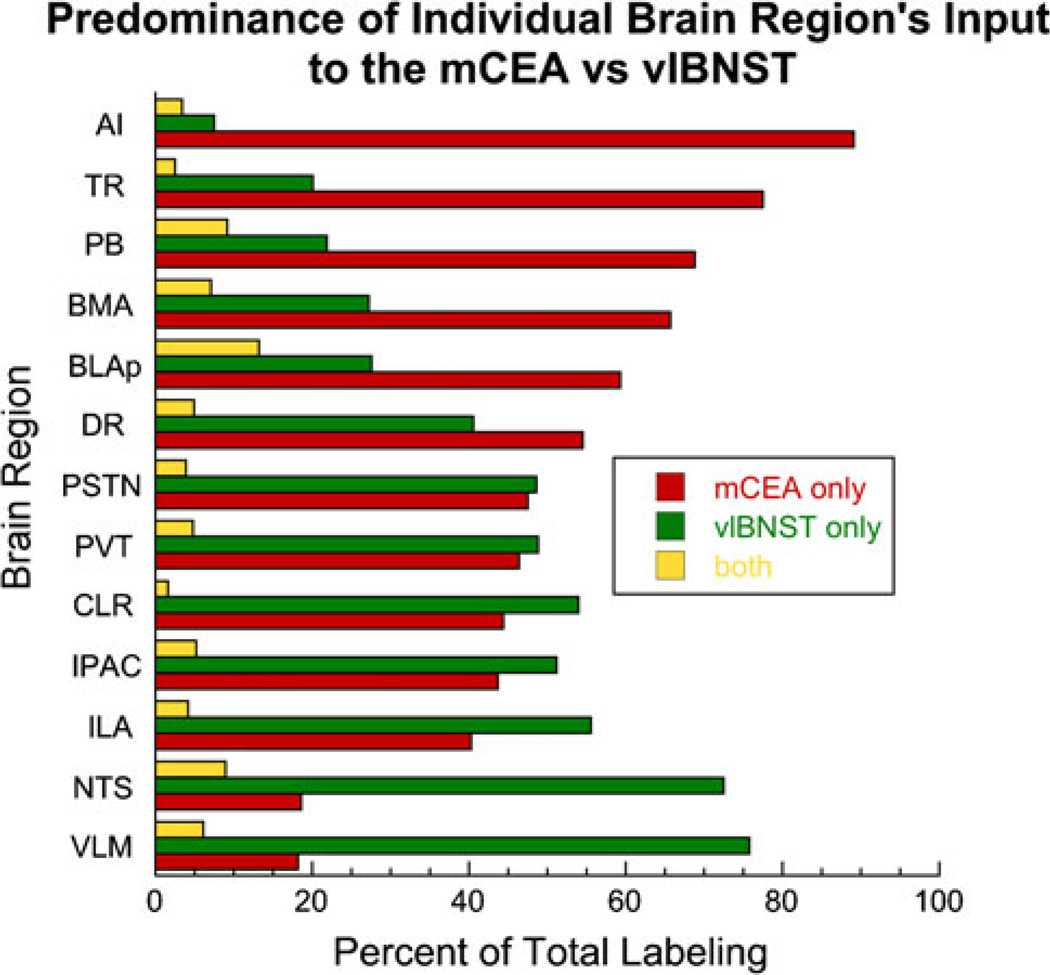
Three major regions of the cerebral cortex contained CEAm- and BSTvl-projecting neurons. The densest cortical input to the CEAm and BSTvl arose from a region situated near the rhinal sulcus, including the agranular and dysgranular insular cortex (AI and DI, respectively; Figs. 8, 9, 11). Within the AI, significantly greater numbers of retrogradely labeled neurons projected to the CEAm versus the BSTvl (868 ± 208 vs. 102 ± 45 neurons; P = 0.02). More than 30% of BSTvl-projecting AI neurons also projected to the CEA (i.e., were double-labeled), whereas double-labeled neurons comprised only 3% of all AI input to the CEAm (Table 1).
A dense overlap of CEAm- and BSTvl-projecting neurons was observed within deep layers of the caudal infralimbic cortex (ILA; Figs. 11d, 13f), with only a few scattered cells observed in the more dorsally situated prelimbic cortex (PL; Figs. 11d, 13f). Quantification of ret-rogradely labeled neurons within the ILA revealed similar numbers of CEAm- and BSTvl-projecting neurons (96 ± 37 vs. 129 ± 43 neurons; P = 0.6). Despite their overlapping distributions, BSTvl- and CEAm-projecting neurons within the ILA rarely collateralized to both the CEAm and BSTvl (3 ± 2% of total retrogradely labeled neurons; Table 1).
Within the ventral cerebral cortex, dense retrograde labeling was located within the postpiriform transition area (TR, sometimes referred to as the amygdala-piriform transition area; Figs. 12b, 13e), with fewer retrogradely labeled neurons scattered throughout the more medially situated posterior amygdala (PA), and also within area CA1 of the ventral hippocampus (Fig. 12a). Quantification of retrogradely labeled TR neurons revealed a significantly greater number of CEAm- versus BSTvl-projecting neurons (682 ± 94 vs. 192 ± 63 neurons; P = 0.01). Relatively few TR neurons collateralized to innervate both the CEAm and BSTvl (2 ± 1% of total retrogradely labeled neurons; Table 1).
Retrograde labeling patterns after tracer iontophoresis into regions adjacent to CEAm and BSTvl
The goal of this study was to target specific subregions of the central extended amygdala, i.e., the BSTvl and the CEAm, for retrograde tracing of their afferent inputs. This clearly is a challenging task, given the relatively small size of each structure. Thus, we sought to determine whether tracer delivery sites that were viewed as “accurately centered” and relatively confined to the BSTvl or CEAm produced retrograde labeling that was distinct from labeling produced by tracer delivery centered in adjacent “incorrect” regions. “Incorrect” tracer delivery sites located adjacent to the BSTvl included the ventral pallidum (VP, lateral to the BST) and the posterior BST (pBST). Iontophoretic delivery of tracer into the VP produced abundant retrograde labeling in the medial subthalamic nucleus (STN), whereas accurate BSTvl iontophoretic delivery produced retrogradely labeled neurons in the adjacent PSTN with no labeling in the STN. Iontophoretic delivery of tracer into the pBST produced dense retrograde labeling within the MEA, whereas MEA labeling was much more sparse after accurate tracer placement in the BSTvl. Tracer delivery into the VP or pBST also produced little or no retrograde labeling within other brain regions that contained labeled neurons after accurate BSTvl tracer delivery, including the NTS, VLM, BLAp, TR, and PSTN.
“Incorrect” tracer delivery sites adjacent to the CEAm included the dorsally situated amygdala-striatal transition area (AStr), the CEAl, and/or the BLA. In contrast to labeling produced by accurate CEAm-targeted sites, iontophoretic delivery of tracer into the BLA produced substantially more retrograde labeling within the pontine locus coeruleus (Asan 1998), and bilateral retrograde labeling of neurons within layer 3 of the nucleus of the lateral olfactory tract, consistent with previous findings (Santiago and Shammah-Lagnado 2004). Tracer delivery into the AStr retrogradely labeled neurons within secondary somatosensory cortex, which does not project to the CEA (Shammah-Lagnado et al. 1999). This cortical region was not labeled in rats with accurate CEAm tracer delivery sites in the present study. Cases in which the center of the iontophoretic delivery site was located within the CEAl rather than the CEAm produced little or no retrograde labeling within the NTS or VLM, in contrast to results following CEAm-centered tracer delivery, and consistent with the preferential distribution of NA fibers within the CEAm as compared to the CEAl (shown in Fig. 1d). NA inputs to the CEA arise primarily from the caudal medulla, and the large majority of NTS and VLM neurons that project to the CEA are NA neurons (Myers and Rinaman 2002).
Discussion
The present report is the first to fully map and compare the anatomical distribution of neurons projecting to the CEA and lateral BST, the two major components of the central extended amygdala. Our results are specifically focused on central neural inputs to CEAm and BSTvl subregions of the central extended amygdala. Although VLM and cortical neurons have been reported to provide collateralized axonal input to the CEA and BST (Roder and Ciriello 1994; Reynolds and Zahm 2005), previous studies did not investigate inputs that specifically target the CEAm and BSTvl. The present study reveals three patterns of retrograde labeling among brain regions that innervate the CEAm and BSTvl: high numbers of CEAm afferents with fewer BSTvl afferents, high numbers of BSTvl afferents with fewer CEAm afferents, or relatively even numbers of CEAm and BSTvl afferents (Fig. 14). Interestingly, neurons with collateralized inputs to both the CEAm and BSTvl exist within most of the CNS regions that project to either target, although the incidence of collateralization varies among regions (Fig. 14). These results generally support De Olmos and Heimer’s proposal that “all or most of the central extended amygdala would share similar inputs” in the sense that the CEAm and BSTvl receive inputs from the same brain regions (de Olmos and Heimer 1999). Indeed, the SNc appears to be the only brain region that provides input to the CEAm but not to the BSTvl. However, our new findings reveal that inputs from cortical and sensory-related regions appear to preferentially target the CEAm, while inputs from motor-related “behavioral control columns” [(Swanson 2000); see following section] appear to preferentially target the BSTvl.
Fig. 14.
Schematic representation of the relative incidence of single-and double-tracer-labeled neurons across brain regions projecting to the CEAm and BSTvl. All regions in which labeling was quantified projected to both the CEAm and BSTvl, although each region contributed varying degrees of input to the CEAm versus the BSTvl. The proportion of double-labeled neurons projecting to both the CEAm and BSTvl was generally similar across brain regions
General principles for the organization of neural inputs to the central extended amygdala
In addition to considering our results as they pertain to the concept of the “central extended amygdala”, another way to interpret these findings arises from Larry Swanson’s descriptive model of how the brain regulates motivated behavior (Swanson 2000). Generally speaking, behaviorally relevant information from widespread regions of the cerebral cortex reaches motor output systems through a triple descending projection to hierarchically organized behavioral control columns, with each column dedicated to the production of a specific category of behavioral output (i.e., social, defensive, reproductive, or exploratory). Each column contains three levels of control that are common to the production of motivated behavioral output. The highestorder level of behavioral control is located within specific subregions of the hypothalamus and other rostral brainstem nuclei. This upper level of control defines an endogenous baseline activity level for specific subsets of brainstem motor pattern initiators and generators in order to regulate the series of movements that are necessary to produce organized behavior by controlling specific sets of brainstem and spinal motor neurons that initiate muscle contraction.
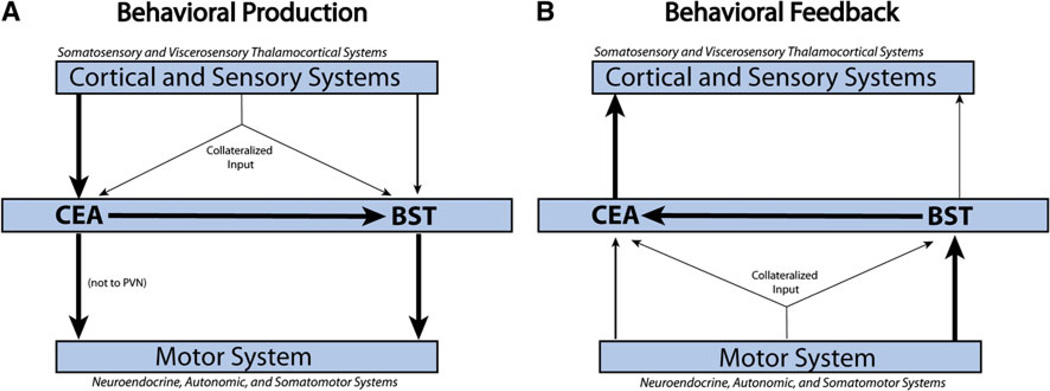
Overall, brain regions that contained larger numbers of neurons projecting to the CEAm versus the BSTvl (Fig. 14) are associated with cortical or sensory systems (e.g., AI, BLAp, BMA, PB, TR, cPVT, Aud, SPFpm/ VPMpc), while brain regions that contained larger numbers of neurons projecting to the BSTvl versus the CEAm include striatal-like regions and areas associated with Swanson’s behavioral control columns (e.g., most of the hypothalamus, NTS, VLM, ACBsh, LS, PPN). When incorporated with anatomical data from the literature detailing CEA and BST efferent projections (Dong et al. 2001b; Dong and Swanson Dong and Swanson 2003, 2004, 2006a, b), these new findings support an organizational hypothesis for two primary pathways through which behaviorally relevant information is processed by the CEA and BST. First, similar to Swanson’s model, we propose that cortical and sensory information necessary for initiating behaviors converges primarily within the CEA, including the CEAm, which then presumably recruits BST neurons that project to effectors in the motor system’s top-down behavioral control columns (see Fig. 15a) (Dong et al. 2001b; Dong and Swanson 2003, 2004; Dong et al. 2000; Swanson 2000). Secondly, we propose that bottom-up feedback about ongoing behavior is initially received and processed primarily by the BST, including the BSTvl, which then relays the information to the CEA in order to modulate ongoing motor outflow (see Fig. 15b). These top-down and bottom-up pathways may represent parallel but separate anatomical circuits within the CEA and BST, or may facilitate a bidirectional flow of information through the same circuit nodes.
Fig. 15.
Structural anatomical model for information processing via CEA and BST circuits, based on published literature and results from the present study [schematic inspired by (Dong et al. 2001a)]. a Cortical and sensory (i.e., thalamic) regions project predominantly to the CEA, with less robust direct input to the lateral BST. The CEA can directly or indirectly (via the BST) send information to hypothalamic and brainstem motor systems that generate neuroendocrine, autonomic, and somatomotor behavioral responses. b Interoceptive feedback from motor systems regarding executed neuroendocrine, autonomic, and somatomotor outflow is received primarily by the lateral BST, with additional direct and relayed feedback to the CEA. The CEA is proposed to relay this feedback to the cortex and sensory thalamus. Thus, the CEA and BST are proposed to serve as an interface between cortical and motor systems. Bifurcating arrows represent collateralized projections from individual neurons that target both the CEA and BST, although these were minor compared to separate direct projections
In contrast to the “central extended amygdala” concept, Larry Swanson has noted that the network architecture of the CEA and BST shares many similarities to basal ganglia striatopallidal loop networks (Swanson 2000). He has suggested that the CEA is a caudal extension of the striatum and the BST is a rostral extension of the pallidum that together form a caudorostral striatopallidal circuit that is specially differentiated to regulate autonomic, neuroendocrine, and somatomotor output (Swanson 2000). Our results demonstrating differences in the organization of inputs to the CEAm and BSTvl lend supporting evidence for a striatopallidal-like organization of the CEAm and BSTvl. However, whereas motor feedback to the globus pallidus and ventral pallidum arises from brain regions involved in somatomotor control such as the STN, SNr, and the PPN (DeVito et al. 1980), the pallidal-like BSTvl receives more robust direct input from regions involved in somatomotor and visceromotor control, including the hypothalamus and pontine and medullary regions that receive and process visceral sensory inputs. Thus, the BSTvl (and the CEAm, to a lesser extent) receives moment-to-moment feedback about the physiological consequences of behavior, including autonomic and endocrine adjustments, consistent with evidence that changes in visceral and endocrine outflow can occur with little or no ongoing control by cortical structures. Given this abundant feedback, the CEA and BST are well-positioned to adjust somatomotor, autonomic, and neuroendocrine outflow as necessary to support ongoing and anticipated behavioral responses.
Collateralized inputs to the CEAm and BSTvl
Individual neurons with collateralized axonal inputs to the CEAm and BSTvl were observed in nearly every brain region that contained retrogradely labeled neurons, although the incidence of collateralized projection neurons differed among regions. The largest proportions of retrogradely labeled neurons that were double-labeled were found within the lPBN, BLAp, and NTS (Fig. 14), suggesting that information transfer from these regions to the CEAm and BSTvl is more highly coordinated as compared to inputs from other brain regions. Previous work has demonstrated that BLA-driven neural responses within the CEA and BST are temporally synchronized in order to simultaneously activate target neurons within the brainstem, providing evidence for cooperative output of the extended amygdala (Nagy and Pare 2008). Interestingly, the BLAp, lPBN, and NTS are critical structures for acquisition in aversive learning paradigms (Sakai and Yamamoto 1998; Fendt and Fanselow 1999; Reilly 1999; Fanselow and LeDoux 1999), and the relatively high degree of collateralized input to the CEAm and BSTvl from these regions may contribute to the acquisition of newly learned behaviors through synchronized activity.
The PSTN and ILA stood out as having relatively few collateralized inputs to the CEAm and BSTvl, despite abundant retrograde labeling from both target regions. The PSTN and ILA are strongly implicated in providing descending control over autonomic functions (Goto and Swanson 2004; Ciriello et al. 2008; Hurley et al. 1991; Fisk and Wyss 2000; Heidbreder and Groenewegen 2003). Transneuronal viral tracing of preautonomic circuits has revealed distinct parallel descending projections to specific visceral targets (Sved et al. 2001). The presence of relatively few collateralized inputs from the PSTN and ILA to the CEAm and BSTvl suggests that neurons in these regions may contribute to differential control over autonomic output to different visceral targets.
Rostrocaudal distribution of CEAm- and BSTvl-projecting neurons within the NTS and PVT
Although the NTS and PVT contained overlapping distributions of CEAm- and BSTvl-projecting neurons, rostrocaudal analysis revealed differing distributions of where these neurons were located within each nucleus. Within the NTS, BSTvl-projecting neurons were most prevalent at the level of the area postrema, while the largest number of CEAm-projecting neurons peaked just rostral to the area postrema (Fig. 3a), which also contained the largest number of neurons with collateralized axons to both the CEAm and BSTvl. Because vagal sensory inputs to the NTS terminate in a generally viscerotopic pattern (Kalia and Sullivan 1982; Altschuler et al. 1989), our findings of differing distributions of CEAm- versus BSTvl-projecting NTS neurons suggest differences in the type of viscerosensory feedback that may be relayed to the CEAm versus the BSTvl.
Within the PVT, BSTvl-projecting neurons were significantly more prevalent within the rPVT compared to the cPVT, consistent with a previous qualitative report of the distribution of BSTvl-projecting neurons within the PVT (Shin et al. 2008). Conversely, CEAm-projecting neurons were significantly more prevalent in the cPVT than the rPVT (Fig. 10a). Interestingly, the cPVT also provides dense axonal input to corticotrophin-releasing factor (CRF) neurons of the CEAl and BSTdl (Li and Kirouac 2008). A series of experiments have found that cPVT lesions affect behavioral and endocrine responses to chronic stress (Bhatnagar et al. 2002; Bhatnagar and Dallman 1998; Jaferi et al. 2003; Bhatnagar et al. 2003), while the rPVT appears to play a role in light-induced entrainment of circadian rhythms (Salazar-Juárez et al. 2002). Further investigation of the differential PVT input to the CEAm and BSTvl is needed to understand how these inputs may contribute to unique functions of the two limbic regions.
Medial prefrontal cortical projections to the BSTvl
Lesion studies of the medial prefrontal cortex (mPFC) have revealed contrasting functional roles for the PL versus ILA in regulating the hypothalamic–pituitary–adrenal (HPA) neuroendocrine stress axis, suggesting that the ILA promotes HPA axis activity while the PL suppresses it (Radley et al. 2006). Two recent reports have directed focus on the BST as a relay for PL cortical inhibitory influence over the HPA axis (Radley et al. 2009; Radley and Sawchenko 2011). Within the BSTvl, the fusiform and dorsomedial BST subnuclei contain GABAergic neurons that innervate neuroendocrine neurons within the medial parvocellular subregion of the paraventricular nucleus of the hypothalamus (PVN) (Cullinan et al. 2008; Cullinan et al. 1993). In the present study, however, almost all of the mPFC neurons that project to the BSTvl were located within the ILA, in agreement with a previous retrograde tracing study of BSTvl inputs (Shin et al. 2008) and anterograde tracing studies of neural projections from the ILA and PL (Hurley et al. 1991; Vertes 2004; Chiba et al. 2001; Sesack et al. 1989)
Conclusions
The CEA and lateral BST have been described as constituent parts of an anatomical–functional macrosystem known as the ‘central extended amygdala’ (de Olmos and Heimer 1999). Our new findings challenge this view by revealing the anatomical organization of common and distinct sets of neural inputs to two discrete subregions of this proposed macrosystem, the CEAm and BSTvl. Cortical and sensory systems primarily target the CEAm, while input from behaviorally relevant motor systems and viscerosensory nuclei relaying interoceptive feedback from the body primarily target the BSTvl. Neurons with collateralized axonal inputs to both the CEAm and BSTvl are located within nearly all of the brainstem and forebrain regions that provide axonal input to either structure. The incidence of collateralization varies across brain regions, but is relatively minor compared to the number of neurons that provided distinct input to either the CEAm or BSTvl. Taken together, our new findings suggest an anatomical framework for information processing that may contribute to a better understanding of how CEA and BST circuits participate in organizing complex behavioral responses to cognitive and physiological challenges.
Acknowledgments
We thank Vicki Maldovan and Li Cai for their expert technical assistance in this study. This research was supported by grants from the National Institutes of Health (MH59911 and DK063922). Research supported by NIH grant MH59911 to L.R. and NIH grant DK063922 to M.B.
Abbreviations
- ACBsh
Nucleus accumbens, shell division
- aco
Anterior commissure
- AI
Agranular insular cortex
- amc
Amygdalar capsule
- AP
Area postrema
- AStr
Amygdala-striatal transition area
- Aud
Auditory thalamus
- BLAp
Basolateral amygdalar nucleus, posterior part
- BMA
Basomedial amygdalar nucleus
- BST
Bed nucleus of stria terminalis
- pBST
Posterior subnuclei group of the bed nucleus of stria terminalis
- BSTvl
Ventrolateral subnuclei group of the bed nucleus of stria terminalis
- CA1
Field CA1, Ammon’s horn
- cc
Corpus callosum
- CEA
Central amygdalar nucleus
- CEAm
Central amygdalar nucleus, medial part
- CEAl
Central amygdalar nucleus, lateral part
- CLI
Central linear nucleus raphé
- cpd
Cerebral peduncle
- DI
Dysgranular insular cortex
- DMX
Dorsal motor nucleus of the vagus
- DR
Dorsal nucleus raphé
- dscp
Superior cerebellar peduncle decussation
- ec
External capsule
- fx
Fornix
- ILA
Infralimbic area
- IMD
Intermediodorsal nucleus thalamus
- IPAC
Interstitial nucleus of the posterior limb of the anterior commissure
- LHA
Lateral hypothalamic area
- LS
Lateral septal nucleus
- mcp
Middle cerebellar peduncle
- MD
Mediodorsal nucleus thalamus
- ml
Medial lemniscus
- mlf
Medial longitudinal fascicle
- mPFC
Medial prefrontal cortex
- MPO
Medial preoptic area
- MTN
Midline thalamic nuclei
- NLOT
Nucleus of the lateral olfactory tract
- NTS
Nucleus of the solitary tract
- och
Optic chiasm
- opt
Optic tract
- PA
Posterior amygdalar nucleus
- PAGvl
Periaqueductal gray, ventrolateral division
- PB
Parabrachial nucleus
- PBle
Parabrachial nucleus, external lateral part
- PBlv
Parabrachial nucleus, ventral lateral part
- PBm
Parabrachial nucleus, medial part
- PBw
Parabrachial nucleus, waist part
- PL
Prelimbic area
- PPN
Pedunculopontine nucleus
- PSTN
Parasubthalamic nucleus
- PVN
Paraventricular hypothalamic nucleus
- PVT
Paraventricular thalamic nucleus
- py
Pyramid
- scp
Superior cerebellar peduncle
- SI
Substantia innominata
- sm
Stria medullaris
- SNc
Substantia nigra, compact part
- SNr
Substantia nigra, reticular part
- SPFpm
Subparafascicular nucleus thalamus, parvicellular part, medial division
- st
Stria terminalis
- STN
Subthalamic nucleus
- TR
Postpiriform transition area
- V4
Fourth ventricle
- VLM
Ventrolateral medulla
- VP
Ventral pallidum
- VPMpc
Ventral posteromedial nucleus thalamus, parvicellular part
- VTA
Ventral tegmental area
References
- Alheid G, Heimer L. New perspectives in basal forebrain organization of special relevance for neuropsychiatric disorders: the striatopallidal, amygdaloid, and corticopetal components of substantia innominata. Neuroscience. 1988;1:1–39. doi: 10.1016/0306-4522(88)90217-5. [DOI] [PubMed] [Google Scholar]
- Altschuler SM, Bao X, Bieger D, Hopkins DA, Miselis RR. Viscerotopic representation of the upper alimentary tract in the rat: sensory ganglia and nuclei of the solitary and spinal trigeminal tracts. J Comp Neurol. 1989;283(2):248–268. doi: 10.1002/cne.902830207. [DOI] [PubMed] [Google Scholar]
- Bhatnagar S, Dallman M. Neuroanatomical basis for facilitation of hypothalamic-pituitary-adrenal responses to a novel stressor after chronic stress. Neuroscience. 1998;84(4):1025–1039. doi: 10.1016/s0306-4522(97)00577-0. [DOI] [PubMed] [Google Scholar]
- Bhatnagar S, Huber R, Nowak N, Trotter P. Lesions of the posterior paraventricular thalamus block habituation of hypothalamic-pituitary-adrenal responses to repeated restraint. J Neuroendocrinol. 2002;14(5):403–410. doi: 10.1046/j.0007-1331.2002.00792.x. [DOI] [PubMed] [Google Scholar]
- Bhatnagar S, Huber R, Lazar E, Pych L, Vining C. Chronic stress alters behavior in the conditioned defensive burying test: role of the posterior paraventricular thalamus. Pharmacol Biochem Behav. 2003;76(2):343–349. doi: 10.1016/j.pbb.2003.08.005. [DOI] [PubMed] [Google Scholar]
- Cecchi M, Khoshbouei H, Javors M, Morilak DA. Modulatory effects of norepinephrine in the lateral bed nucleus of the stria terminalis on behavioral and neuroendocrine responses to acute stress. Neuroscience. 2002;112(1):13–21. doi: 10.1016/s0306-4522(02)00062-3. [DOI] [PubMed] [Google Scholar]
- Chiba T, Kayahara T, Nakano K. Efferent projections of infralimbic and prelimbic areas of the medial prefrontal cortex in the Japanese monkey Macaca fuscata . Brain Res. 2001;888(1):83–101. doi: 10.1016/s0006-8993(00)03013-4. [DOI] [PubMed] [Google Scholar]
- Ciccocioppo R, Fedeli A, Economidou D, Policani F, Weiss F, Massi M. The bed nucleus is a neuroanatomical substrate for the anorectic effect of corticotropin-releasing factor and for its reversal by nociceptin/orphanin FQ. J Neurosci. 2003;23(28):9445–9451. doi: 10.1523/JNEUROSCI.23-28-09445.2003. [DOI] [PMC free article] [PubMed] [Google Scholar]
- Ciriello J, Schultz CG, Roder S. Collateral axonal projections from ventrolateral medullary non-catecholaminergic neurons to central nucleus of the amygdala. Brain Res. 1994;663(2):346–351. doi: 10.1016/0006-8993(94)91285-8. [DOI] [PubMed] [Google Scholar]
- Ciriello J, Solano-Flores LP, Rosas-Arellano MP, Kirouac GJ, Babic T. Medullary pathways mediating the parasubthalamic nucleus depressor response. Am J Physiol Regul Integr Comp Physiol. 2008;294(4):R1276–R1284. doi: 10.1152/ajpregu.00437.2007. [DOI] [PubMed] [Google Scholar]
- Cullinan WE, Herman JP, Watson SJ. Ventral subicular interaction with the hypothalamic paraventricular nucleus: evidence for a relay in the bed nucleus of the stria terminalis. J Comp Neurol. 1993;332(1):1–20. doi: 10.1002/cne.903320102. [DOI] [PubMed] [Google Scholar]
- Cullinan W, Ziegler D, Herman J. Functional role of local GABAergic influences on the HPA axis. Brain Struct Funct. 2008;213(1):63–72. doi: 10.1007/s00429-008-0192-2. [DOI] [PubMed] [Google Scholar]
- de Olmos J, Heimer L. The concepts of the ventral striatopallidal system and extended amygdala. Annals of the New York Academy of Sciences (Advancing from the Ventral Striatum to the Extended Amygdala: Implications for Neuropsychiatry and Drug Abuse) 1999;877:1–32. doi: 10.1111/j.1749-6632.1999.tb09258.x. [DOI] [PubMed] [Google Scholar]
- DeVito JL, Anderson ME, Walsh KE. A horseradish peroxidase study of afferent connections of the globus pallidus in Macaca mulatta . Exp Brain Res. 1980;38(1):65–73. doi: 10.1007/BF00237932. [DOI] [PubMed] [Google Scholar]
- Deyama S, Nakagawa T, Kaneko S, Uehara T, Minami M. Involvement of the bed nucleus of the stria terminalis in the negative affective component of visceral and somatic pain in rats. Behav Brain Res. 2007;176:367–371. doi: 10.1016/j.bbr.2006.10.021. [DOI] [PubMed] [Google Scholar]
- Dong HW, Swanson LW. Projections from the rhomboid nucleus of the bed nuclei of the stria terminalis: implications for cerebral hemisphere regulation of ingestive behaviors. J Comp Neurol. 2003;463(4):434–472. doi: 10.1002/cne.10758. [DOI] [PubMed] [Google Scholar]
- Dong HW, Swanson LW. Organization of axonal projections from the anterolateral area of the bed nuclei of the stria terminalis. J Comp Neurol. 2004;468(2):277–298. doi: 10.1002/cne.10949. [DOI] [PubMed] [Google Scholar]
- Dong HW, Swanson LW. Projections from bed nuclei of the stria terminalis, anteromedial area: cerebral hemisphere integration of neuroendocrine, autonomic, and behavioral aspects of energy balance. J Comp Neurol. 2006a;494(1):142–178. doi: 10.1002/cne.20788. [DOI] [PMC free article] [PubMed] [Google Scholar]
- Dong HW, Swanson LW. Projections from bed nuclei of the stria terminalis, dorsomedial nucleus: implications for cerebral hemisphere integration of neuroendocrine, autonomic, and drinking responses. J Comp Neurol. 2006b;494(1):75–107. doi: 10.1002/cne.20790. [DOI] [PMC free article] [PubMed] [Google Scholar]
- Dong HW, Petrovich GD, Swanson LW. Organization of projections from the juxtacapsular nucleus of the BST: a PHAL study in the rat. Brain Res. 2000;859(1):1–14. doi: 10.1016/s0006-8993(99)02246-5. [DOI] [PubMed] [Google Scholar]
- Dong HW, Petrovich GD, Swanson LW. Topography of projections from amygdala to bed nuclei of the stria terminalis. Brain Res Rev. 2001a;38(1–2):192–246. doi: 10.1016/s0165-0173(01)00079-0. [DOI] [PubMed] [Google Scholar]
- Dong HW, Petrovich GD, Watts AG, Swanson LW. Basic organization of projections from the oval and fusiform nuclei of the bed nuclei of the stria terminalis in adult rat brain. J Comp Neurol. 2001b;436(4):430–455. doi: 10.1002/cne.1079. [DOI] [PubMed] [Google Scholar]
- Fanselow MS, LeDoux JE. Why we think plasticity underlying Pavlovian fear conditioning occurs in the basolateral amygdala. Neuron. 1999;23(2):229–232. doi: 10.1016/s0896-6273(00)80775-8. [DOI] [PubMed] [Google Scholar]
- Fendt M, Fanselow MS. The neuroanatomical and neurochemical basis of conditioned fear. Neurosci Biobehav Rev. 1999;23(5):743–760. doi: 10.1016/s0149-7634(99)00016-0. [DOI] [PubMed] [Google Scholar]
- Fendt M, Endres T, Apfelbach R. Temporary inactivation of the bed nucleus of the stria terminalis but not of the amygdala blocks freezing induced by trimethylthiazoline, a component of fox feces. J Neurosci. 2003;23(1):23–28. doi: 10.1523/JNEUROSCI.23-01-00023.2003. [DOI] [PMC free article] [PubMed] [Google Scholar]
- Fisk GD, Wyss JM. Descending projections of infralimbic cortex that mediate stimulation-evoked changes in arterial pressure. Brain Res. 2000;859(1):83–95. doi: 10.1016/s0006-8993(00)01935-1. [DOI] [PubMed] [Google Scholar]
- Freedman LJ, Cassell MD. Distribution of dopaminergic fibers in the central division of the extended amygdala of the rat. Brain Res. 1994;633(1–2):243–252. doi: 10.1016/0006-8993(94)91545-8. [DOI] [PubMed] [Google Scholar]
- Funk CK, O’Dell LE, Crawford EF, Koob GF. Corticotropin-releasing factor within the central nucleus of the amygdala mediates enhanced ethanol self-administration in withdrawn, ethanol-dependent rats. J Neurosci. 2006;26(44):11324–11332. doi: 10.1523/JNEUROSCI.3096-06.2006. [DOI] [PMC free article] [PubMed] [Google Scholar]
- Gauriau C, Bernard J-F. Pain pathways and parabrachial circuits in the rat. Exp Physiol. 2002;87(02):251–258. doi: 10.1113/eph8702357. [DOI] [PubMed] [Google Scholar]
- Gaykema RPA, Chen C–C, Goehler LE. Organization of immune-responsive medullary projections to the bed nucleus of the stria terminalis, central amygdala, and paraventricular nucleus of the hypothalamus: evidence for parallel viscerosensory pathways in the rat brain. Brain Res. 2007;1130:130–145. doi: 10.1016/j.brainres.2006.10.084. [DOI] [PubMed] [Google Scholar]
- Geerling JC, Loewy AD. Aldosterone-sensitive neurons in the nucleus of the solitary tract: bidirectional connections with the central nucleus of the amygdala. J Comp Neurol. 2006;497(4):646–657. doi: 10.1002/cne.21019. [DOI] [PMC free article] [PubMed] [Google Scholar]
- Goto M, Swanson LW. Axonal projections from the parasubthalamic nucleus. J Comp Neurol. 2004;469(4):581–607. doi: 10.1002/cne.11036. [DOI] [PubMed] [Google Scholar]
- Harris GC, Aston-Jones G. Activation in extended amygdala corresponds to altered hedonic processing during protracted morphine withdrawal. Behav Brain Res. 2007;176(2):251–258. doi: 10.1016/j.bbr.2006.10.012. [DOI] [PMC free article] [PubMed] [Google Scholar]
- Heidbreder CA, Groenewegen HJ. The medial prefrontal cortex in the rat: evidence for a dorso-ventral distinction based upon functional and anatomical characteristics. Neurosci Biobehav Rev. 2003;27(6):555–579. doi: 10.1016/j.neubiorev.2003.09.003. [DOI] [PubMed] [Google Scholar]
- Hurley KM, Herbert H, Moga MM, Saper CB. Efferent projections of the infralimbic cortex of the rat. J Comp Neurol. 1991;308(2):249–276. doi: 10.1002/cne.903080210. [DOI] [PubMed] [Google Scholar]
- Jaferi A, Nowak N, Bhatnagar S. Negative feedback functions in chronically stressed rats: role of the posterior paraventricular thalamus. Physiol Behav. 2003;78(3):365–373. doi: 10.1016/s0031-9384(03)00014-3. [DOI] [PubMed] [Google Scholar]
- Jasnow AM, Davis M, Huhman KL. Involvement of central amygdalar and bed nucleus of the stria terminalis corticotropin-releasing factor in behavioral responses to social defeat. Behav Neurosci. 2004;118(5):1052–1061. doi: 10.1037/0735-7044.118.5.1052. [DOI] [PubMed] [Google Scholar]
- Ju G, Swanson LW. Studies on the cellular architecture of the bed nuclei of the stria terminalis in the rat: I. Cytoarchitecture. J Comp Neurol. 1989;280(4):587–602. doi: 10.1002/cne.902800409. [DOI] [PubMed] [Google Scholar]
- Ju G, Swanson LW, Simerly RB. Studies on the cellular architecture of the bed nuclei of the stria terminalis in the rat: II. Chemoarchitecture. J Comp Neurol. 1989;280(4):603–621. doi: 10.1002/cne.902800410. [DOI] [PubMed] [Google Scholar]
- Kalia M, Sullivan JM. Brainstem projections of sensory and motor components of the vagus nerve in the rat. J Comp Neurol. 1982;211(3):248–264. doi: 10.1002/cne.902110304. [DOI] [PubMed] [Google Scholar]
- Li S, Kirouac GJ. Projections from the paraventricular nucleus of the thalamus to the forebrain, with special emphasis on the extended amygdala. J Comp Neurol. 2008;506(2):263–287. doi: 10.1002/cne.21502. [DOI] [PubMed] [Google Scholar]
- Myers EA, Rinaman L. Viscerosensory activation of noradrenergic inputs to the amygdala in rats. Physiol Behav. 2002;77:723–729. doi: 10.1016/s0031-9384(02)00925-3. [DOI] [PubMed] [Google Scholar]
- Nagy FZ, Pare D. Timing of impulses from the central amygdala and bed nucleus of the stria terminalis to the brain stem. J Neurophysiol. 2008;100(6):3429–3436. doi: 10.1152/jn.90936.2008. [DOI] [PMC free article] [PubMed] [Google Scholar]
- Nakagawa T, Yamamoto R, Fujio M, Suzuki Y, Minami M, Satoh M, Kaneko S. Involvement of the bed nucleus of the stria terminalis activated by the central nucleus of the amygdala in the negative affective component of morphine withdrawal in rats. Neuroscience. 2005;134:9–19. doi: 10.1016/j.neuroscience.2005.03.029. [DOI] [PubMed] [Google Scholar]
- Paxinos G, Watson C. The rat brain in stereotaxic coordinates. 6th edn. San Diego: Elsevier Academic Press; 2007. [Google Scholar]
- Radley JJ, Sawchenko PE. A common substrate for prefrontal and hippocampal inhibition of the neuroendocrine stress response. J Neurosci. 2011;31(26):9683–9695. doi: 10.1523/JNEUROSCI.6040-10.2011. [DOI] [PMC free article] [PubMed] [Google Scholar]
- Radley JJ, Arias CM, Sawchenko PE. Regional differentiation of the medial prefrontal cortex in regulating adaptive responses to acute emotional stress. J Neurosci. 2006;26(50):12967–12976. doi: 10.1523/JNEUROSCI.4297-06.2006. [DOI] [PMC free article] [PubMed] [Google Scholar]
- Radley JJ, Gosselink KL, Sawchenko PE. A discrete GABAergic relay mediates medial prefrontal cortical inhibition of the neuroendocrine stress response. J Neurosci. 2009;29(22):7330–7340. doi: 10.1523/JNEUROSCI.5924-08.2009. [DOI] [PMC free article] [PubMed] [Google Scholar]
- Reilly S. The parabrachial nucleus and conditioned taste aversion. Brain Res Bull. 1999;48(3):239–254. doi: 10.1016/s0361-9230(98)00173-7. [DOI] [PubMed] [Google Scholar]
- Reynolds SM, Zahm DS. Specificity in the projections of prefrontal and insular cortex to ventral striatopallidum and the extended amygdala. J Neurosci. 2005;25(50):11757–11767. doi: 10.1523/JNEUROSCI.3432-05.2005. [DOI] [PMC free article] [PubMed] [Google Scholar]
- Roder S, Ciriello J. Collateral axonal projections to limbic structures from ventrolateral medullary A1 noradrenergic neurons. Brain Res. 1994;638(1–2):182–188. doi: 10.1016/0006-8993(94)90648-3. [DOI] [PubMed] [Google Scholar]
- Sakai N, Yamamoto T. Role of the medial and lateral parabrachial nucleus in acquisition and retention of conditioned taste aversion in rats. Behav Brain Res. 1998;93(1–2):63–70. doi: 10.1016/s0166-4328(97)00133-2. [DOI] [PubMed] [Google Scholar]
- Salazar-Jua´rez A, Escobar C, Aguilar-Roblero R. Anterior paraventricular thalamus modulates light-induced phase shifts in circadian rhythmicity in rats. Am J Physiol Regul Integr Comp Physiol. 2002;283(4):R897–R904. doi: 10.1152/ajpregu.00259.2002. [DOI] [PubMed] [Google Scholar]
- Santiago AC, Shammah-Lagnado SJ. Efferent connections of the nucleus of the lateral olfactory tract in the rat. J Comp Neurol. 2004;471(3):314–332. doi: 10.1002/cne.20028. [DOI] [PubMed] [Google Scholar]
- Sesack SR, Deutch AY, Roth RH, Bunney BS. Topographical organization of the efferent projections of the medial prefrontal cortex in the rat: An anterograde tract-tracing study with Phaseolus vulgaris leucoagglutinin. J Comp Neurol. 1989;290(2):213–242. doi: 10.1002/cne.902900205. [DOI] [PubMed] [Google Scholar]
- Shammah-Lagnado SJ, Alheid GF, Heimer L. Afferent connections of the interstitial nucleus of the posterior limb of the anterior commissure and adjacent amygdalostriatal transition area in the rat. Neuroscience. 1999;94(4):1097–1123. doi: 10.1016/s0306-4522(99)90280-4. [DOI] [PubMed] [Google Scholar]
- Shammah-Lagnado SJ, Alheid GF, Heimer L. Striatal and central extended amygdala parts of the interstitial nucleus of the posterior limb of the anterior commissure: evidence from tract-tracing techniques in the rat. J Comp Neurol. 2001;439(1):104–126. doi: 10.1002/cne.1999. [DOI] [PubMed] [Google Scholar]
- Shin J-W, Geerling JC, Loewy AD. Inputs to the ventrolateral bed nucleus of the stria terminalis. J Comp Neurol. 2008;511(5):628–657. doi: 10.1002/cne.21870. [DOI] [PMC free article] [PubMed] [Google Scholar]
- Sun N, Roberts L, Cassell MD. Rat central amygdaloid nucleus projections to the bed nucleus of the stria terminalis. Brain Res Bull. 1991;27(5):651–662. doi: 10.1016/0361-9230(91)90041-h. [DOI] [PubMed] [Google Scholar]
- Sved AF, Cano G, Card JP. Neuroanatomical specificity of the circuits controlling sympathetic outflow to different targets. Clin Exp Pharmacol Physiol. 2001;28(1–2):115–119. doi: 10.1046/j.1440-1681.2001.03403.x. [DOI] [PubMed] [Google Scholar]
- Swanson LW. Cerebral hemisphere regulation of motivated behavior. Brain Res. 2000;886(1–2):113–164. doi: 10.1016/s0006-8993(00)02905-x. [DOI] [PubMed] [Google Scholar]
- Swanson LW. Brain maps: structure of the rat brain. 3rd edn. San Diego: Elsevier; 2004. [Google Scholar]
- Tanimoto S, Nakagawa T, Yamauchi Y, Minami M, Satoh M. Differential contributions of the basolateral and central nuclei of the amygdala in the negative affective component of chemical somatic and visceral pain in rats. Eur J Neurosci. 2003;18(8):2343–2350. doi: 10.1046/j.1460-9568.2003.02952.x. [DOI] [PubMed] [Google Scholar]
- Vertes RP. Differential projections of the infralimbic and prelimbic cortex in the rat. Synapse. 2004;51(1):32–58. doi: 10.1002/syn.10279. [DOI] [PubMed] [Google Scholar]
- Walker DL, Davis M. Double dissociation between the involvement of the bed nucleus of the stria terminalis and the central nucleus of the amygdala in startle increases produced by conditioned versus unconditioned fear. J Neurosci. 1997;17(23):9375–9383. doi: 10.1523/JNEUROSCI.17-23-09375.1997. [DOI] [PMC free article] [PubMed] [Google Scholar]
- Walker DL, Toufexis DJ, Davis M. Role of the bed nucleus of the stria terminalis versus the amygdala in fear, stress, and anxiety. Eur J Pharmacol. 2003;463(1–3):199–216. doi: 10.1016/s0014-2999(03)01282-2. [DOI] [PubMed] [Google Scholar]
- Walker DL, Miles LA, Davis M. Selective participation of the bed nucleus of the stria terminalis and CRF in sustained anxietylike versus phasic fear-like responses. Prog Neuropsychopharmacol Biol Psychiatry. 2009;33(8):1291–1308. doi: 10.1016/j.pnpbp.2009.06.022. [DOI] [PMC free article] [PubMed] [Google Scholar]
- Watson RE, Wiegand SJ, Clough RW, Hoffman GE. Use of cryoprotectant to maintain long-term peptide immunoreactivity and tissue morphology. Peptides. 1986;7(1):155–159. doi: 10.1016/0196-9781(86)90076-8. [DOI] [PubMed] [Google Scholar]
- Zardetto-Smith AM, Beltz TG, Johnson AK. Role of the central nucleus of the amygdala and bed nucleus of the stria terminalis in experimentally-induced salt appetite. Brain Res. 1994;645(1–2):123–134. doi: 10.1016/0006-8993(94)91645-4. [DOI] [PubMed] [Google Scholar]


