Abstract
This paper describes artificial neural network (ANN) based prediction of the response of a fiber optic sensor using evanescent field absorption (EFA). The sensing probe of the sensor is made up a bundle of five PCS fibers to maximize the interaction of evanescent field with the absorbing medium. Different backpropagation algorithms are used to train the multilayer perceptron ANN. The Levenberg-Marquardt algorithm, as well as the other algorithms used in this work successfully predicts the sensor responses.
Keywords: Fiber optic sensor, evanescent field, absorption, artificial neural networks
1. Introduction
Evanescent field absorption (EFA) has been widely employed by some researchers for sensing of chemical and biological parameters over the past two decades [1, 2]. Typical applications include sensing of chemical species such that pH [3,4], concentration [5], humidity [6], gas [7], combustible liquids [8] and as biosensors [9].
EFA sensing mechanism utilized by fiber optic sensors is based on the absorption of the light carried by the evanescent field that coexists in the fiber cladding. In EFA fiber sensors the core is surrounded by an absorptive cladding that consists of a liquid [10, 11] or a sol-gel material [3, 12] that include an absorbing dye, since most chemical materials are not able to absorb the optical power directly. The effect to be sensed can be related to the power change because absorbing dye causes attenuation in the optical power.
In the last decade, ANNs became popular because they have ability to learn, fast real-time operation and ease of implementation features [13-15]. These features made ANNs useful for optical fiber technology especially to extend measurement range [16-18], calibration [19], signal processing [20, 21] and development of intelligent fiber optic sensors [22].
In this work, we have used the output power of an EFA fiber sensor made up a PCS fiber bundle. Then we have used a canonical variable incorporating the sensor's and absorbing dye's parameters to predict the response of the sensor by the aim of ANN because it can produce proper outputs for given inputs without any necessity to mathematical formulations between input and output data.
2. EFA Sensor Measurements
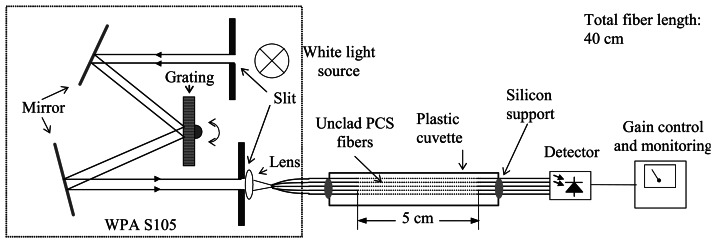
The sensing process based on EFA has been performed by using the arrangement in Figure 1 [23]. The sensor is adopted from a spectrophotometer, WPA S105, in which white light is created by a pre-focusing incandescent lamp and reaches a diffraction grating by reflecting off a mirror. The diffraction grating is attached to a rotating rod and acts as a monochromator to set the wavelength required. Thus, a wavelength selectable sensor is obtained.
Figure 1.
The arrangement for evanescent field absorption sensor [23].
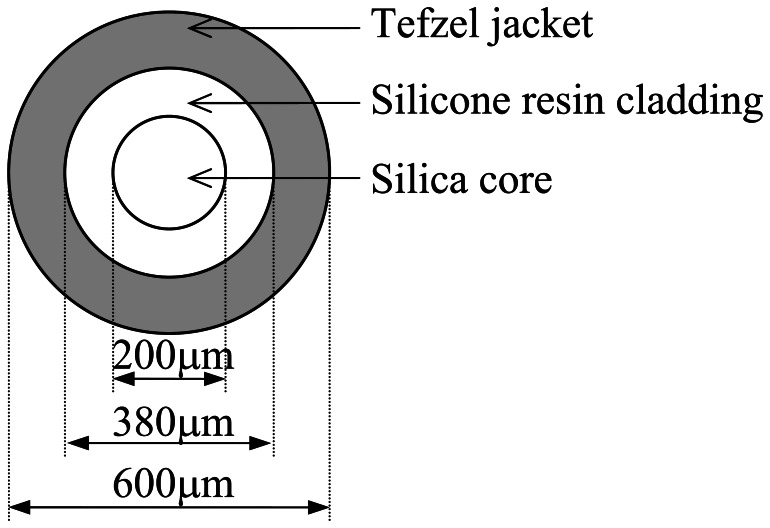
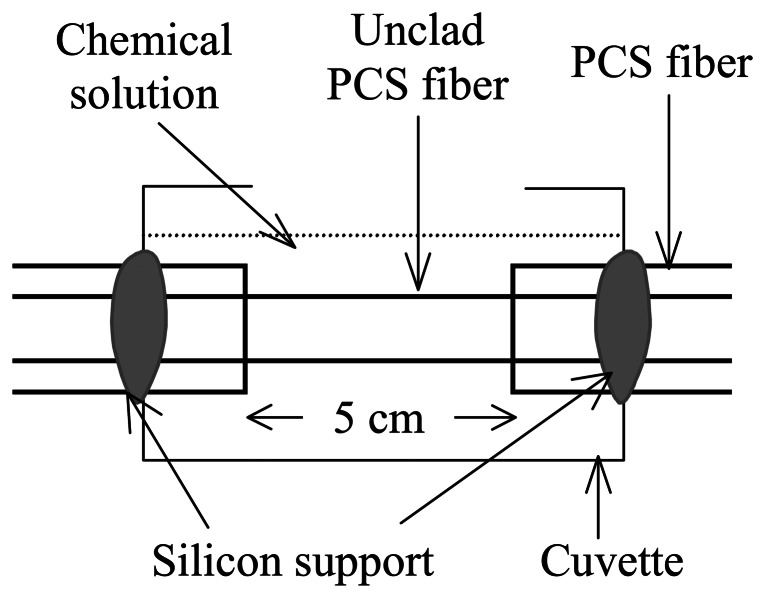
The sensing element was a bundle that consists of five plastic cladding silica (PCS) fibers as shown in Figure 2. The PCS fibers are especially suitable for evanescent field applications in chemical sensing because plastic claddings can easily be removed by mechanically or chemically and replaced by a suitable medium. The use of the bundle for sensing purposes doesn't affect the sensitivity because the input and output power of the sensor will increase a factor of the fiber number in the bundle. However, the bundle not only improves the coupling of the light into the fibers, but also increases the interaction surface, and makes the detection of the light at the bundle output better. The fibers in the bundle are separated at the sensing region to allow the whole of the evanescent field of each fiber in the bundle is accessed by the external solution. In this work, claddings of the PCS fibers in the bundle were mechanically removed in order to maximize the interaction between the evanescent field, which is created by the total internal reflection, and the chemical to be sensed. A fiber in the bundle, forming the sensing region, is shown in Figure 3.
Figure 2.
The PCS fiber in the bundle (PCS200A, Quartz&Silice, France).
Figure 3.
The geometry of the sensing region.
For absorption measurements, Bromophenol Blue (BPB) indicator dye filled into the cuvette was used for absorbing cladding material. BPB is an indicator dye whose color is blue near pH 7 and varies by changing the pH. The monochromator was adjusted at a wavelength of 590 nm since the BPB solution has an absorption peak near this wavelength.
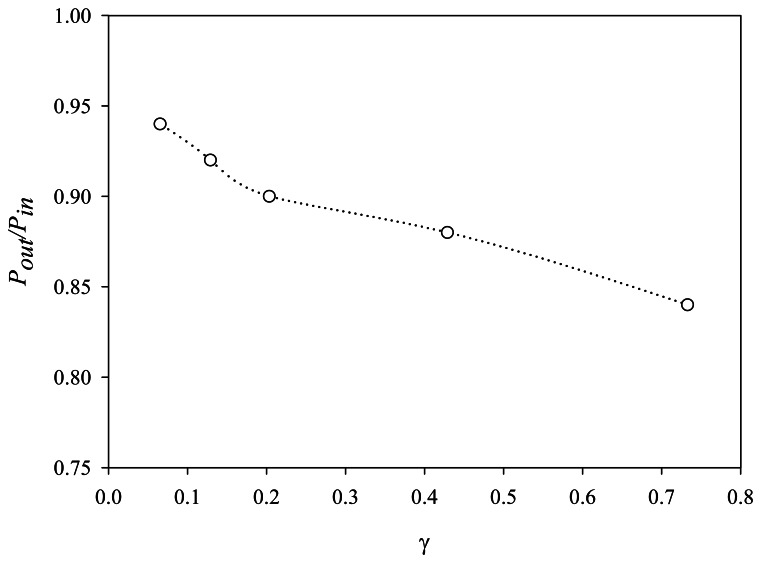
The sensor response (Pout/Pin) has been measured for different BPB concentrations by using the arrangement given in Figure 1 and results are given in Figure 4. In the figure, γ is a canonical variable incorporating the sensor parameters and given by [24, 25],
| (1) |
where α is the bulk absorption coefficient of the chemical solution, l is the interaction length of the light with the chemical solution, and V, the normalized frequency, is a dimensionless waveguide parameter of the fiber.
Figure 4.
The sensor response (Pout/Pin) in terms of γ [23].
The normalized frequency of the fiber is an important parameter for sensitivity purposes in EFA sensors because it plays an important role the amount of the evanescent field. Simply, the smaller the normalized frequency, the more evanescent field the fiber has. Therefore, in order to ensure a detectable interaction between the evanescent field and the indicator dye, the normalized frequency must be as small as possible. This can be achieved by the longer wavelength, the smaller fiber core diameter and the smaller relative refractive-index difference between the core and cladding [24, 25].
3. Artificial Neural Networks (ANNs)
Artificial neural networks (ANNs) are one of the popular branches of artificial intelligence [13-15, 26]. They have very simple neuron-like processing elements (called nodes or artificial neurons) connected to each other by weighting. The weights on each connection can be dynamically adjusted until the desired output is generated for a given input. An artificial neuron model consists of a linear combination followed by an activation function. Different types of activation functions can be utilized for the network; however the common ones, which are sufficient for most applications, are the sigmoidal and hyperbolic tangent functions. In most of the application, hyperbolic tangent transfer function is a better representation compared to sigmoid transfer function.
Amongst the different types of connections for artificial neurons, feed forward neural networks are the most popular and most widely used models in various applications reported in the literature. They are also known as the multilayered perceptron neural networks (MLPNNs). In an MLPNN, neurons of the first layer send their output to the neurons of the second layer, but they do not receive any input back from the neurons of the second layer.
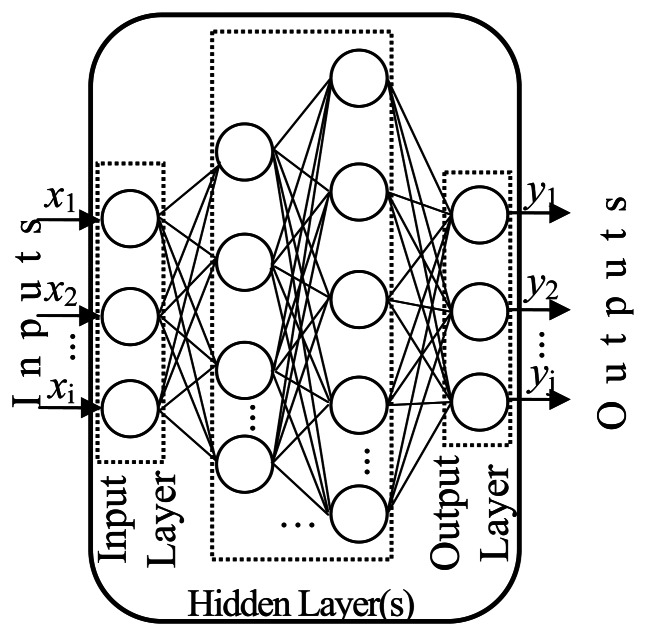
The general structure of an MLPNN is given in Figure 5 and consists of three layers: an input layer, with a number of neurons equal to the number of variables of the problem, an output layer, where the Perceptron response is made available, with a number of neurons equal to the desired number of quantities computed from the inputs, and an intermediate or hidden layer. While an MLPNN consisting of only the input and the output layers provide satisfaction for linear problems, additional intermediate layers are required in order to approximate nonlinear problems. For example, all problems which can be solved by a perceptron can be solved with only a hidden layer, but it is sometimes more efficient to use two (or more) hidden layers.
Figure 5.
General structure of an MLPNN.
The only task of the neurons in the input layer is to distribute the input signal xi to neurons in the hidden layer. Each neuron j in the hidden layer sums up its input signals xi after weighting them with the strengths of the respective connections wji from the input layer and computes its output yj as a function f of the sum, given by
| (2) |
where f can be a simple threshold function such as a sigmoid, or a hyperbolic tangent function. The output of neurons in the output layer is computed in the same manner. Following this calculation, a learning algorithm is used to adjust the strengths of the connections in order to allow a network to achieve a desired overall behavior.
There are many types of learning algorithms in the literature [13-15, 26]. However, it is very difficult to know which training algorithm will be more efficient for a given problem. The algorithms used to train ANNs in this study are Levenberg–Marquardt Backpropagation (LM), Scaled Conjugate Gradient Backpropagation (SCG), Broyden Fletcher Goldfarb Shanno Quasi-Newton Backpropagation (BFGS), Bayesian Regularization Backpropagation (BR), and Conjugate Gradient Backpropagation with Polak-Ribiére updates (CGP).
The LM algorithm is an iterative technique locating a local minimum of a multivariate function that is expressed as the sum of squares of several non-linear, real-valued functions and updates weight and bias values according to Levenberg-Marquardt optimization. The SCG which is a member of the class of conjugate gradient methods is a supervised learning algorithm for feedforward neural networks. The BFGS is one of the most powerful and sophisticated quasi-Newton methods and has the advantage over Newton's method that the second partial derivatives are not needed. The BR algorithm updates the weight and bias values according to LM optimization and minimizes a combination of squared errors and weights, and then determines the correct combination so as to produce a network that generalizes well. The CGP algorithm is a network training function that updates weight and bias values according to the conjugate gradient backpropagation with Polak-Ribiere updates. More details about the ANNs and learning algorithms can be found in the literature [13-15, 26].
4. Application of ANN and Results
An MLPNN consisting of one input, two hidden layers and one output was used to predict the EFA sensor response. The input and output variables of the network are γ and Pout/Pin, respectively and the prediction process can be defined as follows: α is a measurable coefficient for a given solution. l is an adjustable length for a sensor configuration and V can be calculated by using optical fiber parameters and the wavelength of the optical source. Consequently, γ is a known parameter and can be used for the prediction of the sensor response. A training dataset consisted of randomly selected γ vs. Pout/Pin is applied to the network and the network is trained. By using the weights obtained after training, the new responses are then estimated for unseen γ values.
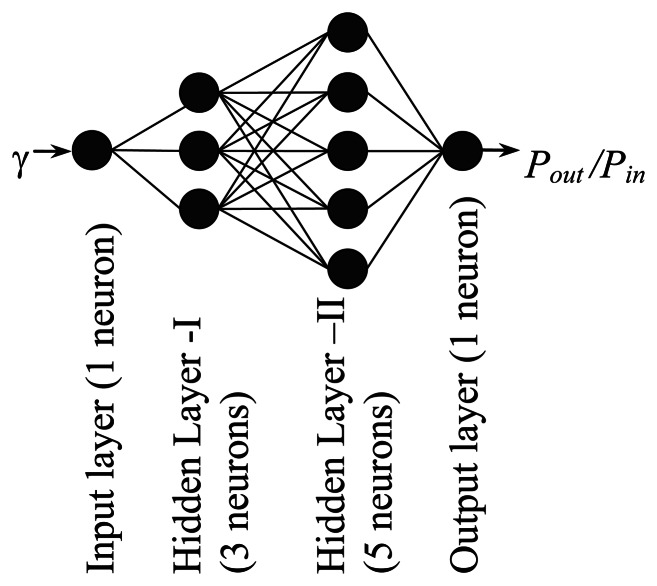
Figure 6 shows an example of the networks, the model with LM algorithm, proposed in this work. The model consists of one neuron in the input layer, three and five neurons in the first and the second hidden layers, respectively, and one neuron in the output layer. Each network is trained with nine dataset normalized between -1 and +1 before the training. A hyperbolic tangent transfer function is used as activation function in hidden layers and a linear one is used in output layer. The performance of the algorithms used in the network is compared in terms of their mean square errors (MSEs). Training times of the all networks used in this work are shorter than three seconds. The network types and resulted MSEs are given in Table 1. Training results given in Table 1 show that the ANN model with the BR algorithm has the best performance with the smallest MSE value although it has the minimum number of the neurons.
Figure 6.
An example of the networks proposed in this work.
Table 1.
The training algorithms, artificial neuron numbers and resulted MSEs.
| Algorith m | Number of Artificial Neurons | MSE | |||
|---|---|---|---|---|---|
|
| |||||
| Input Layer | Hidden Layer - I | Hidden Layer - II | Output Layer | ||
|
| |||||
| LM | 1 | 3 | 5 | 1 | 1.85E-07 |
| SCG | 1 | 2 | 5 | 1 | 9.98E-07 |
| BFGS | 1 | 5 | 4 | 1 | 6.25E-07 |
| BR | 1 | 2 | 2 | 1 | 1.10E-07 |
| CGP | 1 | 4 | 4 | 1 | 3.55E-07 |
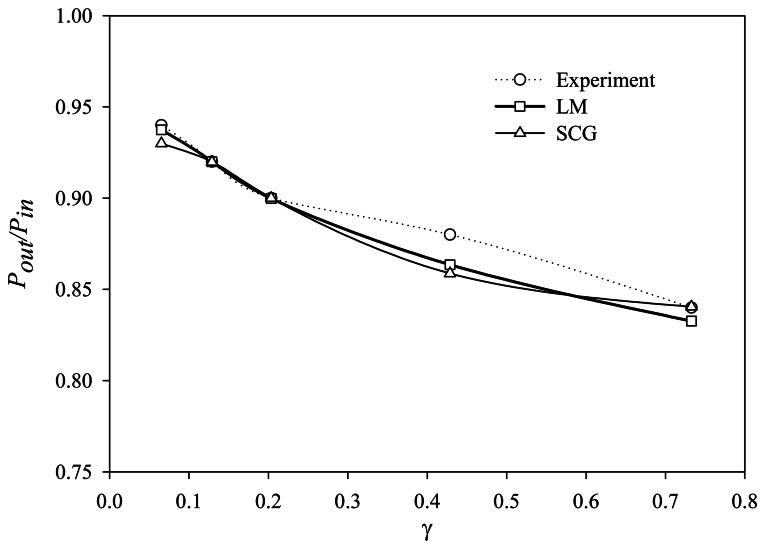
The prediction performances of the ANN models are tested with five experimental points obtained from the sensor described in Section 2. The comparisons of the sensor responses and the network outputs are given in Table 2. It can be seen from the table that the ANN model with the LM algorithm has the smallest MSE value. The best (LM) and the worst (SCG) ANN outputs with respect to MSEs are graphically compared with the experimental results in Figure 7. The figure points out that there is a measurement error at the 0.4288 of γ.
Table 2.
Comparisons of the sensor responses and the network outputs.
| γ | Sensor Response | ANN Model Outputs | ||||
|---|---|---|---|---|---|---|
|
| ||||||
| LM | SCG | BFGS | BR | CGP | ||
| 0.7328 | 0.84 | 0.83269 | 0.84053 | 0.84139 | 0.83967 | 0.84130 |
| 0.4288 | 0.88 | 0.86355 | 0.85874 | 0.87051 | 0.85924 | 0.86277 |
| 0.2035 | 0.90 | 0.89983 | 0.90008 | 0.89909 | 0.90004 | 0.90058 |
| 0.1290 | 0.92 | 0.92003 | 0.91987 | 0.91944 | 0.91996 | 0.92030 |
| 0.0653 | 0.94 | 0.93748 | 0.93000 | 0.92248 | 0.93843 | 0.93089 |
|
| ||||||
| MSE | 0.04389 | 0.07333 | 0.05316 | 0.05762 | 0.05072 | |
Figure 7.
Comparisons of the best and the worst ANN outputs with the sensor responses.
If the percentage errors with respect to the experimental results are calculated for another performance comparison, it can be seen that the models with BR and LM have the smallest maximum percentage, errors being smaller than 2.0 (the maximum errors of the other models are smaller than 2.5).
For the discussion of influence of neuron numbers in the hidden layers on MSE and the sensor response, we trained the networks with the same neuron numbers and the same initial weights by using the model given in Figure 6. The network outputs and resulted MSEs are given in Table 3. As can be seen from the table, the BR algorithm produces improper outputs for these conditions. It can be said that the network parameters such as the neuron numbers, the number of hidden layers, the activation functions and the initial weights are peculiar to the algorithm and a change in one of these parameters can cause important changes at the outputs.
Table 3.
Performance comparisons of the networks for the model given in Figure 6.
| γ | Sensor Response | ANN Model Outputs | ||||
|---|---|---|---|---|---|---|
|
| ||||||
| LM | SCG | BFGS | BR | CGP | ||
| 0.7328 | 0.84 | 0.83269 | 0.83450 | 0.83705 | 0.87837 | 0.83797 |
| 0.4288 | 0.88 | 0.86355 | 0.86220 | 0.85763 | 0.87837 | 0.85642 |
| 0.2035 | 0.90 | 0.89983 | 0.90040 | 0.89922 | 0.87837 | 0.89999 |
| 0.1290 | 0.92 | 0.92003 | 0.91970 | 0.91939 | 0.87837 | 0.91948 |
| 0.0653 | 0.94 | 0.93748 | 0.92560 | 0.92164 | 0.87837 | 0.92300 |
|
| ||||||
| MSE | 0.04389 | 0.0738 | 0.1125 | 0.9929 | 0.1129 | |
5. Conclusions
An artificial neural network approach has been introduced in this paper to predict the response of an evanescent field absorption fiber sensor. Performance comparisons show that all of the neural models used in this work can predict the sensor responses with considerable errors. It is useful to note that, the neural network approaches can tolerate measurement errors. In conclusion, the artificial neural network approaches can play an important role in the design and development of intelligent sensors.
References
- 1.DeGrandpre M.D., Burgess L.W. Long path fiber-optic sensor for evanescent field absorbance measurements. Anal. Chem. 1988;60:2582–2586. [Google Scholar]
- 2.Wolfbeis O.S. Fiber-optic chemical sensors and biosensors. Anal. Chem. 2006;78:3859–3874. doi: 10.1021/ac060490z. [DOI] [PubMed] [Google Scholar]
- 3.Gupta B. D., Sharma D. K. Evanescent wave absorption based fiber optic pH sensor prepared by dye doped sol-gel immobilization technique. Opt. Comm. 1997;140:32–35. [Google Scholar]
- 4.Choudhury P.K., Yoshino T. On the pH response of fiber optic evanescent field absorption sensor having a U-shaped probe: An experimental analysis. Optik-Int. J. Light Electron Opti. 2003;114:13–18. [Google Scholar]
- 5.Lye P.G., Boerkamp M., Ernest A., Lamb D.W. Investigating the sensitivity of PMMA optical fibres for use as an evanescent field absorption sensor in aqueous solutions. J. Phys. 2005;15:262–269. [Google Scholar]
- 6.Khijwania S.K., Srinivasan K.L., Singh J.P. An evanescent-wave optical fiber relative humidity sensor with enhanced sensitivity. Sensors Actuat. B. 2005;104:217–222. [Google Scholar]
- 7.Willer U., Scheel D., Kostjucenko I., Bohling C., Schade W., Faber E. Fiber-optic evanescent-field laser sensor for in-situ gas diagnostics. Spectrochim. Acta A: Mol. Biomol. Spectros. 2002;58:2427–2432. doi: 10.1016/s1386-1425(02)00058-6. [DOI] [PubMed] [Google Scholar]
- 8.Santoyo A.T., Shlyagina M.G., Jimeneza F.J.M., Oyarzabal L.N.R. Determination of the optimal wavelength for temperature independent detection of commercial gasoline with a polymer cladding optical fiber. Opt. Comm. 2007;271:386–390. [Google Scholar]
- 9.Bosch M.E., Sánchez A.J.R., Rojas F.R., Ojeda C.B. Recent Development in Optical Fiber Biosensors. Sensors. 2007;7:797–859. [Google Scholar]
- 10.Wu Y., Deng X., Li F., Zhuang X. Less-mode optic fiber evanescent wave absorbing sensor: Parameter design for high sensitivity liquid detection. Sensors Actuat. B. 2007;122:127–133. [Google Scholar]
- 11.Lee S.T., Kumar R.D., Kumar P.S., Radhakrishnan P., Vallabhan C.P.G., Nampoori V.P.N. Long period gratings in multimode optical fibers: application in chemical sensing. Opt. Comm. 2003;224:237–241. [Google Scholar]
- 12.Cao W., Duan Y. Optical fiber-based evanescent ammonia sensor. Sensors Actuat. B. 2005;110:252–259. [Google Scholar]
- 13.Haykin S. Neural Networks: A Comprehensive Foundation. 2nd. Prentice-Hall; Englewood Cliffs, NJ: 1999. [Google Scholar]
- 14.Kröse B., Smagt P.V.D. An introduction to Neural Networks. The University of Amsterdam; Amsterdam: 1996. [Google Scholar]
- 15.Christodoulou C.G., Georgiopoulos M. Application of Neural Networks in Electromagnetics. Artech House; MA, USA: 2001. [Google Scholar]
- 16.Brook T.E., Taib M. N., Narayanaswamy R. Extending the range of a fibre-optic relative-humidity sensor. Sensors Actuat. B. 1997;39:272–276. [Google Scholar]
- 17.Taib M.N., Andres R., Narayanaswamy R. Extending the response range of an optical fibre pH sensor using an artificial neural network. Anal. Chim. Acta. 1996;330:31–40. [Google Scholar]
- 18.Suah F.B.M., Ahmad M., Taib M.N. Optimisation of the range of an optical fibre pH sensor using feed-forward artificial neural network. Sensors Actuat. B. 2003;90:175–181. [Google Scholar]
- 19.Taib M.N., Narayanaswamy R. Multichannel calibration technique for optical-fibre chemical sensor using artificial neural network. Sensors Actuat. B. 1997;39:365–370. [Google Scholar]
- 20.Yang Q., Butler C. Sensor signal processing using neural networks for a 3-D fibre-optic position sensor. Sensors Actuat. A. 1994;41:102–109. [Google Scholar]
- 21.Tu Y., Huang S. Two kinds of neural network algorithms suitable for fiber optic sensing array signal processing. Opt. Engin. 1996;35:2196–2202. [Google Scholar]
- 22.Borecki M. Intelligent Fiber Optic Sensor for Estimating the Concentration of a Mixture-Design and Working Principle. Sensors. 2007;7:384–399. [Google Scholar]
- 23.Saraçoğlu Ö. G., Özsoy S. Implementation of Evanescent Field Absorption Based pH Sensing using Fiber Optic Bundle. Proc. Elect. Electron. Comp. Engin. Symp. 2000:275–279. in Turkish. [Google Scholar]
- 24.Payne F.P., Hale Z.M. Deviation from Beer's Law in multimode evanescent field sensors. Int. J. Optoelectron. 1993;8:743–748. [Google Scholar]
- 25.Saracoglu O.G., Ozsoy S. Simple equation to estimate the output power of an evanescent field absorption-based fiber sensor. Opt. Engin. 2002;41:598–600. [Google Scholar]
- 26.http://www.mathworks.com/access/helpdesk_r13/help/toolbox/nnet/nnet.html


