Abstract
We have developed a simple, convenient and inexpensive voltammetric method for determining trace Sudan I contamination in chili powder, based on the catalyzed electrochemical reduction of Sudan I at the carbon nanotube modified electrode. Under optimized conditions, the method exhibited acceptable analytical performance in terms of linearity (over the concentration range 6.0×10⁻⁷ to 7.5×10⁻⁵ M, r = 0.9967), detection limit (2.0×10⁻⁷ M) and reproducibility (RSD = 4.6%, n=10, for 2.0×10⁻⁵ M Sudan I).
Keywords: Sudan I, Chili powder, Multi-wall carbon nanotubes, Modified electrodes, Voltammetric determination
1. Introduction
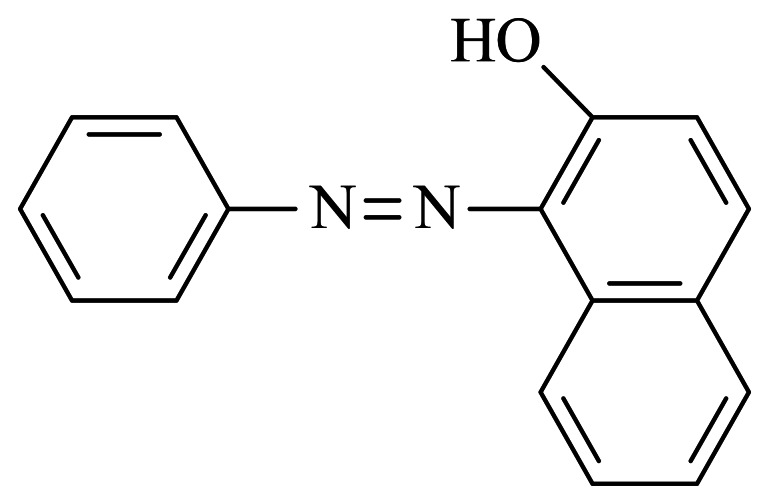
Sudan I (1-phenylazo-2-naphthol, Figure 1), an azocompound, is a non-ionic fat-soluble dye. It is mainly used to color waxes, oils, petrol, solvents and polishes, and was once adopted for coloring foodstuffs, including particular brands of chili and curry powder. However, Sudan dyes were classified as category 3 human carcinogens by the International Agency for Research on Cancer due to their possible mutagenic and carcinogenic effects, and their use in foodstuffs has been banned in many countries to ensure the food safety [1]. Despite many strict regulations, at the regional, national and international levels, forbidding the use of Sudan I as a food additive, incidents still occur now and then in which the dye was found in some brands of chili powder, pepper sauce even KFC's New Orleans roasted chicken wings [2, 3]. For the sake of effective control of the illegal use of Sudan I in foodstuffs prompted by commercial concerns, a diverse array of analytical techniques for the determination of trace Sudan I contamination in foodstuffs, especially in chili-containing foodstuffs, has been rapidly developed.
Figure 1.
Chemical structure of Sudan I.
The most common approaches use advanced separation techniques such as high performance liquid chromatography or capillary electrophoresis, followed by spectrophotometric, optical or mass spectrometric detection [3-13]. These state-of-the-art methodologies show satisfactory analytical results in terms of specificity, sensitivity and reproducibility as well as simultaneous determination of Sudan I-IV dyes, but they also suffer from drawbacks including time-consuming procedures, the need for sophisticated expensive instrumentation, large sample volume needs or bulky waste treatment. Here we proposed a simple electrochemical sensor based on multi-walled carbon nanotubes (MWCNTs) modified glassy carbon electrode (GCE) for trace detection of Sudan I contaminated in chilli food samples.
2. Experimental
2.1. Reagents and apparatus
MWCNTs were kindly provided by the Laboratory of Life Analytical Chemistry, Nanjing University, China. They were synthesized by a catalytic pyrolysis method and then purified with concentrated HNO3[14]. The treatment can cause segmentation and carboxylation of MWCNTs at their terminus. Dihexadecyl hydrogen phosphate (DHP), a hydrophobic surfactant, was purchased from Fluka (Buchs, Switzerland) and used for solubilizing MWCNTs in water to generate a homogeneous and stable suspension.
Sudan I was obtained from Sigma (St. Louis, MO, USA) and dissolved in methanol to prepare a stock solution of 1.0 × 10⁻⁴ M. The working standard solutions of Sudan I were obtained by serial dilution with 0.1 M phosphate buffer solution (PBS, pH 7.0) prior to use. All reagents were at least of analytical grade and used as received without further purification. Double-distilled water was used throughout and a 0.1 M PBS (pH 7.0) served as the supporting electrolyte unless otherwise stated. All electrochemical measurements were performed with a CHI 660A Workstation (CH Instruments, Texas, USA). A conventional three-electrode system, consisting of a working electrode, a Ag/AgCl (saturated KCl) reference electrode and a platinum wire counter electrode, was employed. All the potentials were recorded versus Ag/AgCl. Surface characterization was performed with a JEM-1230 transmission electron microscope (JEOL Instrument, Inc., Japan) at a 100 kV acceleration voltage with a CCD high-resolution camera and a JEM-T300 scanning electron microscope (JEOL Instrument, Inc., Japan) with accelerating voltages of 3–20 kV, respectively.
2.2. Fabrication of MWCNTs modified GCE
MWCNTs (5 mg) and DHP (5 mg) were dispersed into water (5 mL) by ultrasonication for about 20 min to give a stable and homogeneous MWCNT-DHP suspension of 1 mg/mL. Prior to modification, a GCE (3-mm-diameter) was mechanically polished with alumina slurry of different grades to a mirror finish, rinsed and sonicated in water for 3 min. A MWCNTs modified GCE was prepared by first dropping MWCNT-DHP suspension (1 mg/mL, 10 μL) onto the surface of the GCE and then allowing it to dry under an infrared lamp.
2.3. Analytical procedures
A desired volume of Sudan I standard or sample solution was pipetted to a 10 mL electrolytic cell containing 0.1 M PBS (pH 7.0), followed by deaeration with pumping oxygen-free nitrogen for 10 min. An accumulation step was then conducted with stirring of the solution for 3 min at open-circuit. After a quiescent interval of 30 s, linear sweep voltammograms from –0.20 to –1.00 V were recorded. Prior to and after each measurement, the MWCNTs modified GCE was activated by successive cyclic voltammetric sweeps from –0.20 to –1.00 V at 100 mV/s in the electrolyte solution until the voltammograms kept unchangeable to achieve a reproducible electrode surface.
3. Results and Discussion
3.1. Surface characterization of the MWCNTs modified GCE
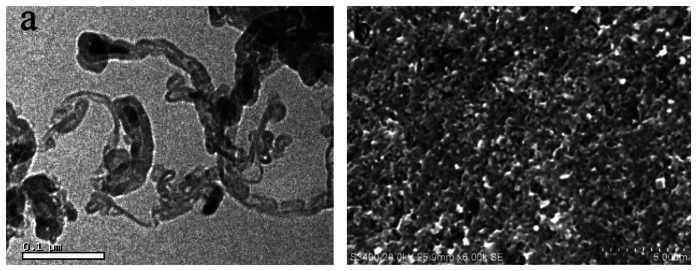
A representative transmission electron microscopy (TEM) image demonstrates that the MWCNTs are cylindrical, with outer diameters around 20 nm and with a length ranging from 0.1 μm to several micrometers, and each MWCNT is mainly folded in shape (Figure 2a).
Figure 2.

TEM image of the MWCNTs (a) and SEM image of the MWCNTs modified GCE (b).
As shown in the typical scanning electron microscopy (SEM) image of the MWCNTs modified GCE, a uniform film of MWCNTs distributing on the GCE surface is enough stable to resist detachment, and the curved MWCNTs are also observable, forming many defects on the electrode surface (Figure 2b).
3.2. Electrochemical behavior of Sudan I at the MWCNTs modified GCE
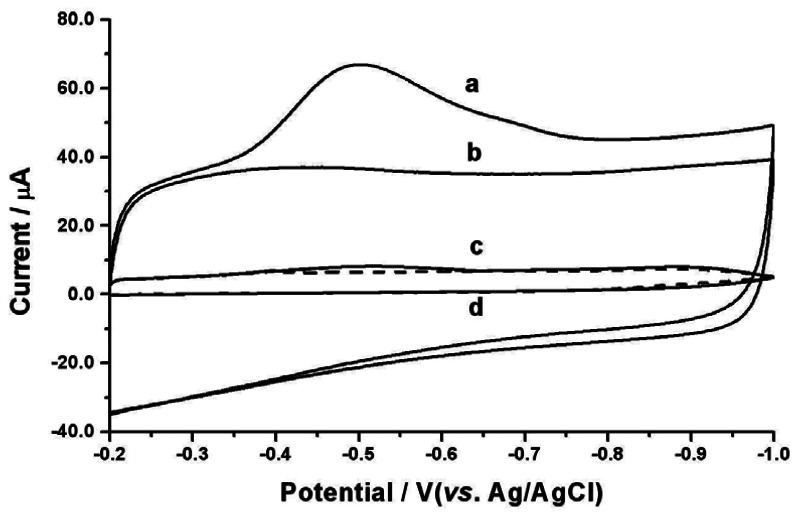
The electrochemical behavior of Sudan I at the MWCNTs modified GCE was examined using cyclic voltammetry within a certain potential window. Figure 3 compares cyclic voltammograms of the MWCNTs modified GCE in 0.1 M PBS (pH 7.0) in the presence (a) and absence (b) of 2.0×10⁻⁵ M Sudan I. No observable redox peaks appear in the blank PBS. Upon addition of 2.0×10⁻⁵ M Sudan I, a well-defined and sensitive reduction peak was observed at the potential of –0.50 V during the first cathodic sweep from –0.20 to –1.00 V, but no corresponding oxidation peak was observed on the reverse scan, suggesting that the electroreduction product could not be oxidized over the potential range in question. The electrode process involves the two-electron and two-proton reduction of the azo group (–N=N–) in Sudan I molecule into the hydrazo compound via the reaction scheme outlined in the following equation. This is generally accepted for the electrochemical reduction mechanism of azo compounds [15, 16]:
Figure 3.
Cyclic voltammograms of the MWCNTs modified GCE (a, b) or the bare GCE (c, d) when placed in 0.1 M PBS (pH 7.0) in the presence (a, c) and absence (b, d) of 2.0×10⁻⁵ M Sudan I. Scan rate: 100 mV/s.
The reduction peak currents of Sudan I decrease gradually during the successive cyclic voltammetric sweeps. After four potential sweeps with a scan rate of 100 mV/s, the peak currents remain practically unchanged. This phenomenon might be caused by the fact that Sudan I or its reduction product is adsorbed onto the surface of the MWCNTs modified GCE leading to inactivation of the electrode surface. In addition, cyclic voltammograms of 2.0×10⁻⁵ M Sudan I at different scan rates (10, 25, 50, 100, 125, or 150 mV/s) were recorded. The reduction peak current (ip) was found to be proportional to the scan rate (v) with a regression equation of ip (μA) = 3.64 + 0.124v (mV/s) (r = 0.9972), providing further evidence that the electrode reaction of Sudan I at the MWCNTs modified GCE is adsorption-controlled.
The voltammetric profile of Sudan I at the bare GCE was also examined within the potential range of –0.20 to –1.00 V. No obvious redox activity was found at the bare GCE in the blank PBS (Figure 3d) or after addition of 2.0×10⁻⁵ M Sudan I (Figure 3c). Therefore, the occurrence of sensitive reduction responses of Sudan I at the MWCNTs modified GCE stems from the unique electrocatalytic properties inherent to MWCNTs [17], especially their better wetting performance due to porous structure of bundle CNTs and their surface electronic structure due to the helicity, low dimensionality and possible topological defects.
Generally, electrochemical methods are preferable in certain analytical cases because of their low cost and simple instrumentation and procedures [18]. However, it is very difficult to achieve high sensitive and selective determination of Sudan I in chili-containing foods with traditional electrochemical techniques, although the polarographic or voltammetric behaviors of azo groups have been well investigated in the literature [19-22].
Carbon nanotubes (CNTs) represent a very important new class of nanomaterials, which can be divided into multi-walled carbon nanotubes (MWCNTs) and single-walled carbon nanotubes (SWCNTs) based on the number of carbon atom layers of the wall of the nanotubes. Since the discovery of CNTs [23], they have attracted tremendous research interest due to their unique structural, mechanical, electronic and chemical properties [24]. CNTs impart strong electrocatalytic activity and minimization of surface fouling onto electrochemical devices [25]. Therefore, they have been exploited as electrode materials for promoting the electron transfer reaction of many electroactive or nonelectroactive analytes in complex sample matrices [26]. In this study, the results show that MWCNTs modified GCEs enhance the reduction peak current of Sudan I as compared to bare GCEs. Therefore, a voltammetric technique is developed for the determination of trace Sudan I contamination in foodstuffs.
3.3. Optimization of experimental variables
3.3.1. Effect of supporting electrolytes
The electrochemical reduction of 2.0×10⁻⁵ M Sudan I in different supporting electrolyte solutions, including pH 5.0–8.0 PBS, pH 2.0–10.0 Britton-Robinson buffer, pH 1.0–5.0 sodium citrate-HCl buffer, pH 4.0–6.0 HAc–NaAc buffer (0.1 M of each buffer), were examined by linear sweep voltammetry. The best reduction response was obtained in pH 7.0 PBS in that the peak shape was well defined with the highest peak current as compared to that in other buffer systems.
Linear sweep voltammetry showed that the reduction peak current of Sudan I in 0.1 M PBS was increased as the pH increased from 5.0 to 7.0 and then leveled off within the pH range from 7.0 to 8.0. Hence, 0.1 M PBS of pH 7.0 was chosen as the supporting electrolyte for the determination of Sudan I. Moreover, the dependence of reduction peak potentials (Epc) of 2.0×10⁻⁵ M Sudan I on pH values was also examined in 0.1 M PBS by linear sweep voltammetry, giving the equation, Epc (V) = –0.126–0.054 pH (r=0.992). The slope of 54 mV/pH implies that identical numbers of electrons and protons are involved in the electrochemical reduction of Sudan I at the MWCNTs modified GCE.
3.3.2. Effect of amount of MWCNT-DHP suspension
The thickness of the MWCNT-DHP film on the GCE surface is determined by the amount of MWCNT-DHP suspension dropped on the GCE surface. The peak current significantly increases with the amount increasing from 0 to 7 μL. As the amount of suspension increased further, the peak current changes very slightly, and when the amount of suspension exceeds 15 μL, the peak current conversely decreases. This is probably attributable to the effects of DHP, compromising the electrochemical performance of the composite film induced by the hydrophobic and insulating actions of DHP. As a result, an appropriate amount for the fabrication of a MWCNTs modified GCE is 10 μL of 1 mg/mL MWCNT-DHP suspension.
3.3.3. Effect of accumulation potential or accumulation time
Accumulation performed prior to voltammetric measurements could exert a certain influence on the electroreduction of Sudan I at the MWCNT-DHP modified GCE. It was found the peak current was practically independent on the accumulation potential within the potential window of 0.40 to –0.40 V. Thus, an open circuit accumulation was performed.
As to the effect of the accumulation time on the reduction peak current, the latter was found to increase greatly within the first 3 min and then level off, suggesting that the Sudan I accumulation process very rapidly achieves the saturation adsorption of Sudan I on MWCNT-DHP film. Therefore, 3-min-accumulation was used to improve sensitivity of the method and shorten the period of analysis.
3.4. Analytical performance
3.4.1. Calibration plot and stability
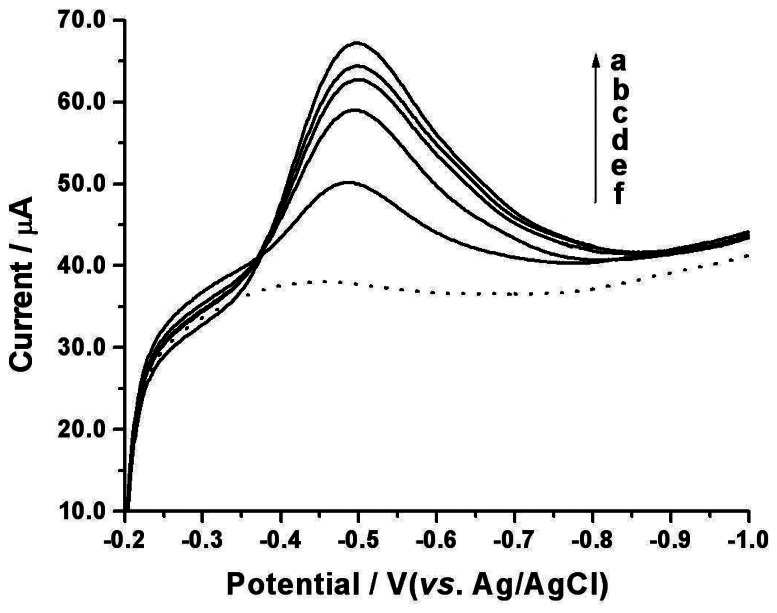
Under the optimized experimental conditions, the linear sweep voltammograms of Sudan I standard solutions with different concentrations at the MWCNTs modified GCE were recorded (Figure 4). The peak current increases linearly with incremental concentration of Sudan I in the range from 6.0×10⁻⁷ to 7.5×10⁻⁵ M, giving a regression equation of ip (μA) = 4.53 + 5.72×10⁵C (M) (r = 0.9967). The detection limit is found to be 2.0×10⁻⁷ M (according to S/N = 3). The relative standard deviation (RSD) of 4.6% for 2.0×10⁻⁵ M Sudan I (n = 10) indicates a good reproducibility.
Figure 4.
Linear sweep voltammograms of Sudan I at the MWCNTs modified GCE in 0.1 M PBS (pH 7.0) containing 5.0×10⁻⁵ (a), 4.0×10⁻⁵ (b), 3.0×10⁻⁵ (c), 2.0×10⁻⁵ (d), 5.0×10⁻⁶ (e), 0 (f) M of Sudan I, respectively. Accumulation time = 3 min. Scan rate: 100 mV/s.
For evaluating the long-term stability of the MWCNTs modified GCE, it was stored in the air and used for monitoring 2.0×10⁻⁵ M Sudan I daily over a period of 4 weeks. The current responses deviated only 6.2%.
3.4.2. Analytical application
Chili powder, purchased from the local market, was further ground and dried before use. A sample (5.0 g) of this powder was introduced into a stoppered flask and extracted three times (20 min each time) under sonication with absolute methanol (30 mL),. The combined extracts were centrifuged at 12,000 rpm to obtain the supernatant which was then filtered through a 0.45 μm cellulose acetate membrane. After the first filtrate was discarded an aliquot of the remaining filtrate was collected followed by appropriate dilution with electrolyte solution to furnish a desired concentration for the sample analysis.
Under the optimized conditions, the prepared test solution was detected at the MWCNTs modified GCE by linear sweep voltammetry, and no observable redox peaks appeared. Because the sample contained no contaminated Sudan I, a recovery experiment was carried out by adding a known amount of Sudan I to a dry chili powder sample, followed by extraction and analysis with the described method. As illustrated in Table 1, the average recoveries (n = 4) varied from 94.5 to 106.0 %, and the related RSD were within the range of 1.86 to 5.43%.
Table 1.
Recovery of determination of Sudan I in chilli powder samples.
| No. | Sudan I added (M) | Average recovered concentration of Sudan I (M) | Recovery (%) | RSD (%) |
|---|---|---|---|---|
| 1 | 7.00×10⁻⁷ | 7.42×10⁻⁷ | 106.0 | 5.43 |
| 2 | 1.00×10⁻⁶ | 9.72×10⁻⁷ | 94.5 | 4.65 |
| 3 | 4.00×10⁻⁶ | 4.18×10⁻⁶ | 104.5 | 2.62 |
| 4 | 8.00×10⁻⁶ | 7.56×10⁻⁶ | 97.2 | 3.28 |
| 5 | 2.00×10⁻⁵ | 1.96×10⁻⁵ | 98.0 | 1.86 |
3.4.3. Interference
A systematic study was carried out to evaluate the interferences of foreign compounds on the determination of Sudan I at the level of 2.0×10⁻⁶ M. As is known, besides its nutrients and vitamin A, B and C, chili contains two classes of ingredients, namely the carotenoid pigments (such as capsanthin, capsorubin, beta-carotene, leaxanthin, violaxanthin, neoxanthin and lutein) and the compound capsaicin (a mixture of 7-vanillylamine derivatives), which are responsible for the red color and pungency of chili, respectively [27]. These species differ greatly from Sudan I in chemical structure and electrochemical characteristics, and no interference from them was found during the detection procedure of chili samples.
The analogues of Sudan I are Sudan II, III and I V, which might conceivably be added to food products as illegal additives. Under the established conditions, the four types of Sudan dyes showed similar electrochemical behaviors, and discriminable reductive peaks appeared at potentials of ∼ –0.50, –0.53, –0.57 and –0.60 V for Sudan I, II, III, I V, respectively. Therefore, this method can be used for separate determinations of different types of Sudan additives if they exist alone. Obviously different types of Sudan additives interfere with each other owing to the overlapping of their responses if they coexist in the chili sample.
4. Conclusions
In this study, a MWCNTs modified GCE was fabricated for examine the voltammetric responses of Sudan I. In contrast with traditional polarography or voltammetry, the enhancement in reduction currents of Sudan I and the elimination of surface fouling at the MWCNTs modified GCE can be attributed to the unique properties of MWCNTs, such as high specific surface area, electronic properties and strong adsorptive ability.
After optimization of the analytical conditions, an electrochemical method was established for the determination of trace Sudan I in chilli powder with minimum instrumentation needs, short analysis time and low cost. The analytical performance of the method was evaluated in terms of linearity, detection limit and reproducibility. Although no samples containing Sudan I were detected in our analytical application, the protocols proved to be suitable for the analysis of trace Sudan I according to the recovery test data, thus confirming the feasibility of the method.
Acknowledgments
This work was supported by Applied Scientific and Technological Research Project of Nantong, Jiangsu, China (Grant No. K2006018) and Natural Scientific Research Project of Education Department of Jiangsu, China (Grant No. 02JKD150004).
References
- 1.Chung K.T. Mutagenicity and carcinogenicity of aromatic amines metabolically produced from azo dyes. J. Environ. Sci. Heal. C. 2000;18:51–74. [Google Scholar]
- 2.Ahlstrom L-H., Sparr Eskilsson C., Bjorklund E. Determination of banned azo dyes in consumer goods. TRAC-Trend Anal. Chem. 2005;24:49–56. [Google Scholar]
- 3.He L., Su Y., Fang B., Shen X., Zeng Z., Liu Y. Determination of Sudan dye residues in eggs by liquid chromatography and gas chromatography–mass spectrometry. Anal. Chim. Acta. 2007;594:139–146. doi: 10.1016/j.aca.2007.05.021. [DOI] [PubMed] [Google Scholar]
- 4.Chen Q., Mou S., Hou X., Riviello J.M., Ni Z.J. Determination of eight synthetic food colorants in drinks by high-performance ion chromatography. J. Chromatogr. A. 1998;827:73–81. doi: 10.1016/s0021-9673(98)00759-6. [DOI] [PubMed] [Google Scholar]
- 5.Calbiani F., Careri M., Elviri L., Mangia A., Pistara L., Zagnoni I. Development and in-house validation of a liquid chromatography–electrospray–tandem mass spectrometry method for the simultaneous determination of Sudan I, Sudan II, Sudan III and Sudan IV in hot chilli products. J. Chromatogr. A. 2004;1042:123–130. doi: 10.1016/j.chroma.2004.05.027. [DOI] [PubMed] [Google Scholar]
- 6.Calbiani F., Careri M., Elviri L., Mangia A., Zagnoni I. Accurate mass measurements for the confirmation of Sudan azo-dyes in hot chilli products by capillary liquid chromatography–electrospray tandem quadrupole orthogonal-acceleration time of flight mass spectrometry. J. Chromatogr. A. 2004;1058:127–135. [PubMed] [Google Scholar]
- 7.Mazzetti M., Fascioli R., Mazzoncini I., Spinelli G., Morelli I., Bertoli A. Determination of 1-phenylazo-2-naphthol (Sudan I) in chilli powder and in chilli-containing food products by GPC clean-up and HPLC with LC/MS confirmation. Food Addit. Contam. 2004;21:935–941. doi: 10.1080/02652030400007252. [DOI] [PubMed] [Google Scholar]
- 8.National Standard of the People's Republic of China. GB/T 19681—2005. Method for the determination of Sudan dyes in foods ––High performance liquid chromatography. 2005 [Google Scholar]
- 9.Puoci F., Garreffa C., Iemma F., Muzzalupo R., Spizzirri U.G., Picci N. Molecularly imprinted solid phase extraction for detection of sudan I in food matrices. Food Chem. 2005;93:349–353. 1033. [Google Scholar]
- 10.Ma M., Luo X., Chen B., Su S., Yao S. Simultaneous determination of water-soluble and fat-soluble synthetic colorants in foodstuff by high-performance liquid chromatography–diode array detection–electrospray mass spectrometry. J. Chromatogr. A. 2006;1130:170–176. doi: 10.1016/j.chroma.2005.11.061. [DOI] [PubMed] [Google Scholar]
- 11.Cornet V., Govaert Y., Moens G., Loco J.V., Degroodt J.M. Development of a Fast Analytical Method for the Determination of Sudan Dyes in Chili- and Curry-Containing Foodstuffs by High-Performance Liquid Chromatography-Photodiode Array Detection. J. Agr. Food Chem. 2006;54:639–644. doi: 10.1021/jf0517391. [DOI] [PubMed] [Google Scholar]
- 12.Wu L.P., Li Y.F., Huang C.Z., Zhang Q. Visual Detection of Sudan Dyes Based on the Plasmon Resonance Light Scattering Signals of Silver Nanoparticles. Anal. Chem. 2006;78:5570–5577. doi: 10.1021/ac0603577. [DOI] [PubMed] [Google Scholar]
- 13.Mejia E., Ding Y., Mora M.F., Garcia D. Determination of banned sudan dyes in chili powder by capillary electrophoresis. Food Chem. 2007;102:1027–1033. [Google Scholar]
- 14.Tsang S.C., Chen Y.K., Harris P.J.F. A simple chemical method of opening and filling carbon nanotubes. Nature. 1994;372:159–162. [Google Scholar]
- 15.Bard A.J. Encyclopedia of electrochemistry of the elements. New York: Marcel Dekker; 1974. p. 174. [Google Scholar]
- 16.Kolthoff I.M., Elving P.J. Treatise on Analytical Chemistry, II. vol. 15. New York: Wiley; 1976. p. 465. [Google Scholar]
- 17.Wu K., Hu S. Deposition of a thin film of carbon nanotubes onto a glassy carbon electrode by electropolymerization. Carbon. 2004;45:3237–3242. [Google Scholar]
- 18.Barek J., Moreira J.C., Zima J. Modern electrochemical methods for monitoring of chemical carcinogens. Sensors. 2005;5:148–158. [Google Scholar]
- 19.Bersier P.M., Bersier J. Polarography and voltammetry of dyes and intermediates. TRAC-Trend Anal. Chem. 1986;5:97–102. [Google Scholar]
- 20.Barek J., Fogg A.G., Moreira J.C., Zanoni M.V.B., Zima J. Polarographic and voltammetric determination of selected triazine-based azo dyes with different reactive groups. Anal. Chim. Acta. 1996;320:31–42. [Google Scholar]
- 21.Zanoni M.V.B., Fogg A.G., Barek J., Zima J. Electrochemical investigations of reactive dyes; cathodic stripping voltammetric determination of anthraquinone-based chlorotriazine dyes at a hanging mercury drop electrode. Anal. Chim. Acta. 1997;349:101–109. [Google Scholar]
- 22.Zanoni M.V.B., Carneiro P.A., Furlan M., Duarte E.S., Guaratini C.C.I., Fogg A.G. Determination of the vinylsulphone azo dye, remazol brilliant orange 3R, by cathodic stripping voltammetry. Anal. Chim. Acta. 1999;385:385–392. [Google Scholar]
- 23.Iijima S. Helical microtubules of graphitic carbon. Nature. 1991;354:56–58. [Google Scholar]
- 24.Baughrman R.H., Zakhidov A.A., Heer W.A. Carbon nanotubes–the route towards applications. Science. 2002;297:787–792. doi: 10.1126/science.1060928. [DOI] [PubMed] [Google Scholar]
- 25.Wang J., Musamech M., Lin Y. Solubilization of carbon nanotubes by nafion toward the preparation of amperometric biosensors. J. Am. Chem. Soc. 2003;125:2408–2409. doi: 10.1021/ja028951v. [DOI] [PubMed] [Google Scholar]
- 26.Musamech M., Wang J., Merkoci A., Lin Y. Low-potential stable NADH detection at carbon-nanotube-modified glassy carbon electrodes. Electrochem. Comm. 2002;4:743–746. [Google Scholar]
- 27.Anu A., Peter K.V. The chemistry of paprika. Capsicumand Eggplant Newsletter. 2000;19:19–22. [Google Scholar]


