

Abstract
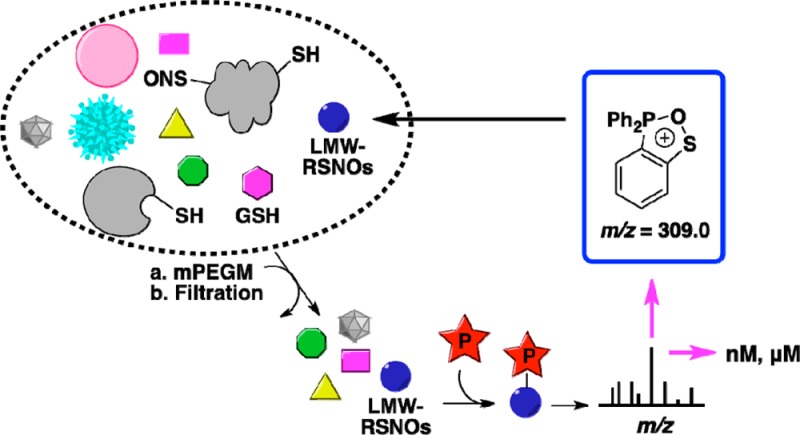
Nitrosothiols (RSNOs) have been proposed as important intermediates in nitric oxide (NO•) metabolism, storage, and transport as well as mediators in numerous NO-signaling pathways. RSNO levels are finely regulated, and dysregulation is associated with the etiology of several pathologies. Current methods for RSNO quantification depend on indirect assays that limit their overall specificity and reliability. Recent developments of phosphine-based chemical probes constitute a promising approach for the direct detection of RSNOs. We report here results from a detailed mechanistic and kinetic study for trapping RSNOs by three distinct phosphine probes, including structural identification of novel intermediates and stability studies under physiological conditions. We further show that a triarylphosphine-thiophenyl ester can be used in the absolute quantification of endogenous GSNO in several cancer cell lines, while retaining the elements of the SNO functional group, using an LC–MS-based assay. Finally, we demonstrate that a common product ion (m/z = 309.0), derived from phosphine–RSNO adducts, can be used for the detection of other low-molecular weight nitrosothiols (LMW-RSNOs) in biological samples. Collectively, these findings establish a platform for the phosphine ligation-based, specific and direct detection of RSNOs in biological samples, a powerful tool for expanding the knowledge of the biology and chemistry of NO•-mediated phenomena.
Introduction
Nitric oxide (NO•) is produced from l-arginine by three nitric oxide synthase isoforms (NOS1, NOS2, NOS3) at low levels as a signaling molecule and at higher concentrations in pathophysiological conditions.1,2 Under aerobic solution conditions NO• generates N2O3, an efficient nitrosating agent which reacts rapidly with nucleophiles such as water to form nitrite, and with glutathione (GSH, γ-Glu-Cys-Gly) to form S-nitrosoglutathione (GSNO) (Figure 1).3−7 Nitrosothiol formation can also take place through diffusion-controlled limits in a radical recombination between NO• and a thiyl radical (RS•) and transition metal-catalyzed pathways.2 Once formed, nitrosothiols can transnitrosate other thiols on peptides and proteins.2,8,9
Figure 1.

Structures of S-nitrosoglutathione (GSNO) and triarylphosphine probes used in this study.
GSNO is the main low-molecular weight nitrosothiol in mammalian cells, and can promote S-nitrosation of proteins that modulate numerous physiological functions.2,10,11 For example, GSNO induces S-nitrosation of proteins regulating responses to tissue hypoxia, thereby promoting angiogenesis and vascular remodeling.12 Importantly, it has been shown to be the key intermediate in the endogenous transnitrosation of both reduced and oxidized thioredoxin, which in turn regulates the activity of caspase 3 through secondary transnitrosation, inhibiting apoptosis.13−15 Other physiological systems are regulated through S-nitrosation by micromolar levels of GSNO (and possibly other low-molecular weight RSNOs) including the nucleus tractus solitarious region of the brainstem.16 GSNO-induced transnitrosation has also been implicated in the etiology of diverse disease states, including asthma, sickle cell disease, pulmonary hypertension, cancer, muscle disorders, and neurodegeneration.17−24
Quantification and elucidation of RSNO behavior in vivo, as well as the development of its full therapeutic potential,25 remain important goals. Presently, no universal direct method exists specifically to identify or quantify RSNOs in cells. Most widely used indirect methods rely on complete removal of the NO• group from RSNO followed by labeling of the nascent thiol via biotin switch, d-switch, derivatizations, AuNP- or phenylmercury-based methods,26−30 or by detecting the liberated NO• (chemiluminescence and Saville assays).31−35 In such methods, indirect labeling of RSNOs is generally accomplished by blocking free thiols, reducing the RSNO with ascorbate, and then derivatizing nascent thiols with a tagged alkylating reagent such as fluorescent- or biotin-tagged-iodoacetamide or similar label.36−38
The specificity and sensitivity of these procedures are therefore dependent on reduction of RSNO by ascorbate and detection of the liberated free thiols.39,40 Difficulty in complete blocking of free thiols and distinguishing unblocked from S-nitrosated thiols represent major limitations of these approaches. The accuracy of such assays has been challenged on the basis of variability in data they generate and has driven a search for alternative detection systems.41−43
Xian and co-workers recently reported that treatment of various organic S-nitrosothiols with derivatized triphenylphosphines yielded a variety of products depending on reaction conditions and the structures of both RSNO and phosphine.42,44−47 In the presence of a properly positioned electrophile on the triphenylphosphine, the azaylide intermediate reacts to form sulfenamides or disulfide-iminophosphoranes, through a Staudinger ligation-type mechanism.48,49 These processes are rich in reaction chemistry, but their application is generally limited to RSNOs derived from N- and C-terminal protected amino acids, and they must be carried out in organic or organic-buffer systems to circumvent limitations in solubility. Additionally, these reactions have generally been carried out under stoichiometric conditions (RSNO/phosphine = 1:2) to minimize undesirable side reactions.
We designed an approach to address these limitations by developing reactions of derivatized triphenylphosphines with GSNO that are capable of detecting SNO at physiological levels and that utilize phosphine probes at concentrations adequate for complete labeling. To accomplish these objectives, we synthesized a panel of phosphine probes containing sulfonate esters and tertiary amine functional groups to facilitate water solubility and aid in mass spectrometric detection (Figure 1) and demonstrated trapping of GSNO under physiologically relevant conditions. We characterized the kinetics of trapping and the applicability of the probes for GSNO detection in aqueous buffer and also determined optimal pH, reagent concentrations, and time required for maximal ligation. Using GSNO labeled with probe 3, triarylphosphine thiophenylester, we developed an integrated high-performance liquid chromatography–mass spectrometric (HPLC–MS/MS)-based method capable in cell extracts of absolute quantification of GSNO while retaining the nitrogen atom and thiol (RS) moiety in a single, stable product. Importantly, discovery of a common ion, m/z = 309.0, during fragmentation of phosphine-mediated ligated products provided a basis for identification of other endogenous low-molecular weight RSNOs in cell lysates. Our results highlight the potential of phosphine-ligation chemistry for discovery, detection, and elucidation of the role of RSNOs in physiological systems.
Experimental Methods
General
Chemical reagents were obtained from commercial sources (Sigma-Aldrich for chemicals, Cambridge Isotope Laboratories for deuterated solvents, Isotec for 13C2,15N-labeled G*SH, Nanocs for mPEG–maleimide) and were used without additional purification. Extraction and silica chromatography solvents were reagent grade. LC–MS and HPLC solvents were HPLC grade. Acetonitrile was distilled for HPLC and LC–MS. Distilled water was obtained in-house and redistilled for HPLC and LC–MS experiments. Vivaspin 3000 MWCO membrane filters were from Sartorius Stedim NA. Unless otherwise stated, all the sample preparations, nitrosothiol preparations, and probe–SNO reactions were carried out in the dark at ambient temperature.
NMR analysis: 1H NMR spectra were recorded on Bruker Avance-600 and Varian Inova-500 instruments at 600.13 and 500.13 MHz, respectively. 13C NMR spectra were recorded on a Varian Inova-500 instrument operating at 125.76 MHz. 31P NMR spectra were recorded on a Varian Inova-500 instrument operating at 202.46 MHz, and 31P chemical shifts are relative to 3% H3PO4 (δ = 0 ppm) contained in a concentric internal capillary (Wilmad). NMR spectra were obtained using Bruker 5 mm TXI cryo-probes and Varian 5 mm PFG-probes held at 22 °C unless otherwise stated.
HPLC Purification of Phosphine–GSNO Reaction Mixture
HPLC was carried out with an Agilent Technologies model 1100 HPLC system equipped with a photodiode array UV detector (Wilmington, DE). Unless specified otherwise, UV absorbance was monitored at 254 nm. HPLC columns and solvent elution systems were as follows: A semipreparative Phenomenex Luna C18 (25 cm × 9.4 mm, 10 μm) column was eluted with a linear gradient of 0.1% formic acid in water (A) and methanol (B) at a flow rate of 2.5 mL/min. Solvent composition was initially at 25% for 5 min, changed from 25% to 60% B over 22 min, and then further to 95% B over 3 min, held for 10 min, followed by returning to 25% B over 2 min for a total run time of 42 min. The column was equilibrated for 10 min before injections. This system was used for isolation of 4a, 4b, 6a, 6b, 7, and 8.
S-Alkylthiophosphonium Adducts
Glutathionyl-diphenyl-2-(((3-sulfopropylthio)carbonyl)phenyl)phosphonium Salt (6a)
To a stirred solution of 1 (200 mg) in Tris-HCl buffer pH 7.4 was added GSNO (50 mg). The reaction mixture was stirred for 1 h at room temperature in the dark and then completely dried and purified by HPLC to isolate 6a (yield 44%). Retention time, tR = 18.8 min. 1H NMR (600 MHz, D2O, δ) 7.98 (m, 2H), 7.65 (m, 6H), 7.57 (m, 4H), 7.45 (m, 1H), 7.37 (m, 1H), 4.18 (t, J = 6.2 Hz, 1H), 3.64 (s, 2H), 3.56 (t, J = 6.5 Hz, 1H), 2.91 (m, 2H), 2.65 (m, 2H), 2.50 (m, 2H), 2.25 (t, J = 6.5, 2H), 2.05–1.95 (m, 2H), 1.45 (m, 2H); 31P NMR (202.46 MHz, D2O, δ) 51.6; HRMS-ESI+ (m/z): [M]+ calcd for C32H37N3O10PS3, 750.1373; found, 750.1379.
Glutathionyl-diphenyl-2-(((3-sulfopropoxy)carbonyl)phenyl)phosphonium Salt (6b)
To a stirred solution of 2 (50 mg) in Tris-HCl buffer pH 7.4 was added GSNO (10 mg). The reaction mixture was stirred for 30 min at room temperature in the dark and then purified by HPLC to isolate 6b (yield =38%). Retention time, tR = 18.4 min. 1H NMR (600 MHz, D2O, δ) 8.08 (m, 2H), 7.68 (m, 6H), 7.54 (m, 4H), 7.50–7.40 (m, 2H), 4.18 (t, J = 6.2 Hz, 1H), 3.84 (m, 2H), 3.71 (s, 2H), 3.62 (t, 7.0, Hz, 1H), 2.95 (m, 2H), 2.40 (m, 2H), 2.31 (t, J = 6.5, 2H), 2.07–1.98 (m, 2H), 1.65 (m, 2H); 31P NMR (202.46 MHz, D2O, δ) 51.9; HRMS-ESI+ (m/z): [M]+ calcd for C32H37N3O11PS2, 734.1607; found, 734.1602.
Formation of 8 via GSNO–Phosphine Probe 2
3-((2-(Diphenylphosphoryl)phenyl)(imino)methoxy)propane-1-sulfonic Acid (8)
To a stirred solution of 2 (100 mg) in Tris-HCl buffer pH 7.4 was added GSNO (20 mg). The reaction mixture was stirred for 30 min at room temperature in the dark and then purified by HPLC to isolate 8 (yield =36%). Retention time, tR = 24.9 min. 1H NMR (600 MHz, CDCl3, δ) 8.32 (m, 1H), 7.82 (m, 1H) 7.71–7.55 (m, 11H), 7.15 (m, 1H) (m, 1H), 5.80 (bs, 1H), 4.30 (t, J = 6.5 Hz, 2H), 2.86 (t, J = 6.5 Hz, 2H), 2.10 (m, J = 6.5, 2H); 13C NMR (125.76, CDCl3, δ) 167.1, 136.8, 135.3, 134.9, 133.9, 133.1, 130.4, 127.3, 126.5, 125.0, 124.1, 66.9, 48.2, 25.2; 31P NMR (202.46 MHz, CDCl3, δ) 39.6; HRMS-ESI+ (m/z): [M + H]+ calcd for C22H23NO5PS, 444.1029; found, 444.1029.
Preparation of Disulfide-Iminophosphorane 9
To a stirred solution of 3 (70 mg, 0.18 mmol) in dry DMSO (4 mL) was added freshly prepared GSNO (30 mg, 0.09 mmol, predissolved in DMSO/H2O, 1:1, 1 mL). The reaction mixture was stirred for 30 min at room temperature in the dark and then completely dried. Disulfide-iminophosphorane 9 was obtained by flash column chromatography with a 2-propanol/H2O gradient and further purified by HPLC (yield = 50 mg, 77%). Retention time, tR = 9.0 min. 1H NMR (500 MHz, D2O, δ) 8.01–7.97 (m, 1H), 7.61–7.50 (m, 5H) 7.45–7.41 (m, 5H), 7.25–7.13 (m, 2H), 6.96–6.92 (m, 1H), 3.93 (m, 2H), 3.86 (s, 1H), 3.70 (s, 1H), 3.65 (d, J = 3.5 Hz, 1H), 3.56 (t, J = 6.5 Hz, 1H), 2.88 (m, 1H), 2.81 (s, 3H), 2.78 (s, 3H), 2.64–2.58 (m, 1H), 2.29–2.23 (m, 2H), 1.93–1.85 (m, 2H); 13C NMR (125.76, D2O, δ) 172.6, 165.9, 132.9, 131.6, 131.5, 130.9, 130.2, 129.0, 64.8, 55.7, 48.9, 47.6, 41.2, 31.0, 25.4, 23.2; 31P NMR (202.46 MHz, D2O, δ) 25.1; HRMS-ESI+ (m/z): [M + H]+ calcd for C32H39N5O7PS2, 700.2023; found, 700.2026; [M + 2H]+2 calcd for C32H40N5O7PS2, 350.6048; found, 350.6044.
Liquid Chromatography–Mass Spectrometry
Liquid chromatography separations were achieved using an Agilent Eclipse XDB-C18 reverse phase column (2.1 mm × 150 mm, 3.5 μm) eluted with a gradient of 0.1% formic acid in water (A) and acetonitrile (B) at 0.3 mL/min at 24 °C. Gradient for GSNO + arylphosphine reaction analyses: The solvent composition was held at 2% B for 2 min, ramped to 98% B over 5 min, and held for 3 min, for a total run time of 10 min.
Kinetics
Calibration plots relating LC–MS peak areas to GSNO concentrations were determined for GSNO standards. For LC–MS analysis, five-point calibration standards were prepared ranging from 0.01 to 5 μM in buffer solution (for reactions with probes 1 and 2: Tris-HCl at pH 7.4; for probe 3: potassium phosphate at pH 7.4 and pH 5.7) and 20 μL injections.
The rate constants for the reaction of phosphine and GSNO at 24 °C were determined under pseudo-first-order kinetics. Phosphine stock solutions (50 mM) were prepared in Tris or phosphate buffers (probes 1 and 2: Tris-HCl at pH 7.4; for probe 3: potassium phosphate at pH 7.4 and pH 5.7 in 20% acetonitrile), with phosphine concentrations ranging from 0.1 to 1 mM. To initiate the reactions, phosphine was dissolved in the appropriate volume of buffer, followed by addition of a corresponding volume of GSNO. Aliquots (20 μL) were removed periodically and analyzed using LC–MS.
ESI-TOF or QTOF Analyses (High-Resolution ESI-MS)
ESI-TOF MS or MS/MS data were collected on an Agilent Technologies (1290 infinity) LC/MSD TOF system (model 1969A) or on an Agilent Technologies (1200) LC-ESI-QTOF system (models 6510 and 6530). Typical operating conditions for ESI-TOF experiments were the following: positive ion mode: gas temperature, 350 °C; gas flow, 10 L/min; nebulizer, 30 psi; capillary voltage (VCap), 3500 V; fragmentor, 90 V. Those for ESI-QTOF were the following: positive ion mode: gas temperature, 335 °C; gas flow, 8L/min; nebulizer, 30 psi; capillary voltage (VCap), 3500 V; fragmentor, 150 V, Skimmer 65 V. Averaged MS spectra were obtained using MassHunter Software (Agilent Technologies) in the 100–1000 MW range.
ESI+-QqQ-MS Analysis (MRM)
An Agilent 1200 capillary HPLC system interfaced to an Agilent Triple Quad LC/MS (model 6430) was used in MRM and precursor-ion analyses. Chromatography was based on an Agilent Eclipse XDB-C18 reverse phase column (1.0 mm × 50 mm, 3.5 μm) eluted with a gradient of 0.1% formic acid in water (A) and acetonitrile (B) at 20 μL/min. The solvent composition was held at 15% B at 0 min and then to 20% over 2 min, followed by a linear increase to 40% B over 8 min, further to 98% B over 2 min, held for 6 min, followed by returning to 15% B over 2 min for a total run time of 20 min. The column was equilibrated for 10 min before injections. Injection volumes were typically 8 μL. With this solvent system, the retention time of disulfide-iminophosphorane, 9, was 9.6 min. The mass spectrometer was operated in the positive ion mode with nitrogen as sheath gas (8 L/min). Electrospray ionization was achieved at a spray voltage of 3.0 kV and a capillary temperature of 250 °C. The mass spectrometer parameters were optimized for maximum response during infusion of standard solutions of 9 (fragmentor; 60 V, collision energy; 7 V).
ESI+-QqQ-MS Analysis (Precursor-Ion Analysis)
Precursor-ion analyses were carried out under conditions the same as those above, selecting m/z = 309.0 as the product ion with a precursor-ion scan window of 100–1000 m/z. For the analysis of 9g, the Agilent Eclipse XDB-C18 reverse phase column (1.0 mm × 50 mm, 3.5 μm) was eluted with 15% acetonitrile in 2 mM ammonium acetate in water with a scan window of 200–1500 m/z.
Preparation of 15N-Labeled 9 and 9a–9i Standards for LC–MS/MS (precursor ion mode)
15N-labeled GSNO (GS15NO) (5 μM, final concentration) was added to a solution of phosphine 3 in phosphate buffer (0.5 mM) held at ambient temperature for 15 min in the dark and then analyzed by LC–MS/MS. The target mass was set to m/z 351.1 for 15N-labeled 9.
Freshly prepared nitrosothiols (1 μM) were added to stirred solutions of phosphine 3 (0.5 mM) in phosphate buffer at pH 5.7. The resulting reaction mixtures were analyzed by LC–MS/MS in precursor ion mode: 9a, 9.0 min, m/z 257.6 (M + 2H)2+; 9b, 11.4 min, m/z 278.6 (M + 2H)2+; 9c, 11.6 min, m/z 285.6 (M + 2H)2+; 9d, 9.7 min, m/z 264.6 (M + 2H)2+; 9e, 8.0 min, m/z 286.1 (M + 2H)2+; 9f, 9.5 min, m/z 322.1 (M + 2H)2+; 9g, 6.8 min, m/z 580.6 (M + 2H)2+; 9h, 12.8 min, m/z 292.6 (M + 2H)2+; 9i, 10.1 min, m/z 271.6 (M + 2H)2+.
Preparation of Cells
Human cell lines were A375 (malignant melanoma), HCT116 (colorectal carcinoma), MCF7 (breast adenocarcinoma), and TK6 (lymphoblasts). Macrophages were from the mouse cell line RAW264.7. HCT116 cells were grown in McCoy’s Medium, MCF7 cells in IMEM; all other cell lines were grown in DMEM. Culture media were supplemented with 10% fetal bovine serum (Atlanta Biochemical), 0.2 mM l-glutamine, 10 U/mL penicillin, and 10 μg/mL streptomycin. All culture reagents were from Lonza unless otherwise stated. Cells were kept at 37 °C in 5% CO2 incubators. Macrophages were activated by treatment with 20 U/mL IFN-γ and 20 ng/mL LPS for 24 h. For analysis of SNOs, cells were washed with ice-cold PBS containing 0.1 mM ethylenediaminetetraacetic acid (EDTA) under protection from light to minimize denitrosation of SNOs. Cells were counted and the wet weights of pellets recorded and frozen at −80 °C until analysis (addition of N-ethyl maleimide (NEM) at the initial washing steps was avoided to keep cells intact until lysis).
Sample Preparation for LC–MS/MS
Samples were first spiked with 500 fmol of isotopically labeled internal standard (13C2,15N-labeled G*SNO) and added with mPEG–maleimide (10 mM) in PBS buffer containing 1 mM EDTA. This was then followed by three freeze/thaw cycles (dry ice to RT) while frequently vortexing to facilitate complete cell lysis. The lysed sample was then kept 15 min at RT to allow complete blocking by mPEG–maleimide. Centrifugation was performed (14k rpm, 10 min at 4 °C) to remove cell debris, followed by filtration using membrane filters 3000 MWCO, (15k rcf, 15 min at 4 °C). The filtrate (low-molecular weight fraction) was then treated with phosphine 3 (3 mM final concentration, prepared by dissolving 4 mg of phosphine in 400 μL of 2:1 acetonitrile/methanol mixture). The resulting clear reaction mixture was then freeze-dried to a final volume of 30 μL; 8 μL of this mixture was injected into the LC–MS/MS. To generate negative controls, the LMW-filtrate was treated with 3 mM DTT (15 min, 24 °C, see the Supporting Information for more experimental details).
Endogenous GSNO Quantification
LC–MS quantitation was performed by MRM, using the internal standard (G*SNO). A method calibration curve for LC–MS/MS was obtained by spiking 500 fmol of 13C2,15N-labeled internal standard (G*SNO) into the reaction between phosphine 3 (5 mM) and GSNO standards (0–10 pmol, in PBS buffer containing 1 mM EDTA) (Supporting Information). Regression analysis of the relative response ratio, calculated from LC–MS/MS peak area ratios corresponding to analytes and internal standards, was then used to calculate the amount of GSNO (in pmoles). This was then multiplied by 3.8 (total volume 30 μL/8 μL injection to MS = 3.8) to obtain the total amount of analyte in the cell lysate. The GSNO concentration was determined by dividing the total amount of analyte (pmol) per million cells by the wet weight per million cells (mg), assuming that the wet weight of cells (10 million) was equal to the weight of water (i.e., mg = μL).
Results and Discussion
Reaction of GSNO with Water-Soluble Probe 1
Toward the development of a biologically useful RSNO probe, ligation in a fully aqueous system was demonstrated using a phosphine sulfonate thioester (probe 1) in Tris-HCl buffer at pH 7.4 (Figure 1). Although two phosphine molecules are stoichiometrically sufficient for the consumption of one molecule of GSNO, we added excess phosphine relative to RSNO to compete with autooxidation in aqueous solutions and for complete labeling in buffers. High-resolution LC–MS (ESI-TOF) analysis of the reaction mixture after 15 min showed a complex mixture comprising phosphoryl amide (7), sulfenamide (5), phosphine oxide (4a), and remaining starting material (probe 1) (Figure 2, A and B). Early in the reaction, we found higher amounts of sulfenamide 5 and amide 7, with decreasing amounts of 5 during the course of the reaction (Figure 2, A and B).
Figure 2.

Reaction between GSNO and phosphine probe 1 (A, B) and 2 (C, D) (in excess, in Tris-HCl, pH 7.4), analyzed by LC–TOF-MS. Upper panel (A and C): time-dependent LC of the reaction intermediates and products (at 254 nm); bottom panel (B and D): time-dependent high-resolution ESI+-MS (EIC; extracted ion chromatogram). Colors: 23 min = black, 45 min = blue, 67 min = green, 89 min = purple, 111 min = yellow, 133 min = pink. Peaks corresponding to 1, 2, 4a, and 4b were excluded on LC–MS trace for clarity. GSNO, 5 μM and 50 μM with phosphine probe (20-fold excess) were used for the LC–MS and LC–UV studies, respectively, (*) indicates the hydrolyzed 2 under our experimental conditions. Monitored/expected masses, 5; m/z = 627.1678/627.1673 [M + H]+, 6a; m/z = 750.1376/750.1373 [M + H]+, 6b; m/z = 734.1602/734.1607 [M + H]+, 7; m/z = 322.0995/322.0991 [M + H]+, 8; m/z = 444.1029/444.1029 [M + H]+. Y-axis represents the relative intensity.
Detailed LC–MS study of the reaction mixture revealed a novel compound, with a mass-to-charge ratio (m/z) of 750.1380, that was absent in previously proposed mechanisms. On the basis of 1H and 31P NMR results and structural similarity to the literature compound50 we assigned the structure to the S-alkylthiophosphonium ion, 6a (Scheme 1A). Mechanistically, the azaylide intermediate corresponds to probe 1 and GSNO, yielding sulfenamide (5) through an intramolecular acyl transfer followed by hydrolysis of the phosphorane intermediate (Scheme 1A). Thus we envisioned two pathways for the fate of the sulfenamide (5) in aqueous conditions. At high concentrations of probe 1, sulfenamide 5 reacts with 1 to yield 6a (path A) or via the thiolate anion to a disulfide (GS-SR1) and phosphorylamide 7 (path B) (Scheme 1A, Figure 2A, and Supporting Information S1). Moreover, 31P NMR kinetic analysis of the reaction between GSNO and probe 1 (1:3) revealed that 6a is the major product in buffered conditions (Supporting Information S2). Stability studies on isolated 6a demonstrated that a quantitative conversion of 6a to GSH and phosphine oxide, 4a, was achieved within 12 h in aqueous conditions (Supporting Information S3). This was consistent with the proposed structure for 6a, i.e. composed of phosphine 1 and GSH. Further, this S-alkylthiophosphonium adduct represents the known intermediate in disulfide reduction by triscarboxyethylphosphine (TCEP), where the S-alkylthiophosphonium intermediate rapidly hydrolyzes to free thiol and phosphine oxide.51−53 Taken together, these experiments revealed (1) the formation of S-alkylthiophosphonium ion 6a, phosphoryl amide 7, GSH, and GS-SR1 in the presence of excess phosphine; (2) the complexity and the instability of the resulting chemical species (sulfenamide and disulfide; GS-SR1); and (3) their cross-reactivity during GSNO trapping in buffer conditions at physiological pH.
Scheme 1. Reaction Pathways Supported by 31P NMR and High-Resolution LC–MS Analysis of Intermediates and Products When GSNO Reacts with (A) Probe 1, (B) Probe 2, and (C) Probe 3 in Buffer Conditions at Physiological pH.

Phosphoryl amide (7), which retains the nitrogen atom of the RSNO, can be detected at levels as low as 100 amol (100 × 10–18 mol) due to its superior ionization in LC–ESI+-MS/MS. Recent reports,54,55 however, indicate that the 7 formed by the reaction of nitroxyl (HNO) with phosphines make it unsuitable as a biomarker for RSNOs.
Moreover, the S-alkylthiophosphonium adduct 6a, due to the possibility of its formation from the reaction between sulfenic acids and phosphines, is also not specific for RSNOs.50 According to our results, probe 1 can be used to detect and quantify RSNOs under physiological conditions by simultaneously considering both 6a, which carries the thiol moiety of RSNO, and 7, which carries the nitrogen atom, with necessary control experiments (disulfides, nitroxyl and sulfenic acids) (Scheme 1A). Further, probe 1 may also be used as a specific reducing agent to convert RSNOs to RSH completely (Scheme 1A; path A).56
Reaction of GSNO with Water-Soluble Probe 2
A similar analysis was performed to detect ligated products arising from the phosphine sulfonate ester (probe 2) and GSNO. At physiological pH, in the presence of excess 2, we observed the expected S-alkylthiophosphonium ion (6b), phosphine oxide (4b), and the remaining starting material (probe 2) (Figure 2, C and D and Supporting Information S4). In a situation similar to the reaction of GSNO with probe 1, an unexpected product appeared. The potential sulfenamide product with expected mass ([M + H]+, m/z = 627.1673) was not detected. Instead, we observed a new LC–MS peak at m/z = 444.1029. On the basis of 1H, 13C, and 31P NMR and MS/MS fragmentation, we propose a stable phosphoryl-benzimidate structure (compound 8) for the new peak (Scheme 1B). We envision that in aqueous systems, the azaylide intermediate arising from phosphine 2 and GSNO undergoes an intramolecular nucleophilic attack from the N atom to the carbonyl carbon to generate an amidophosphonium salt. This is then followed by hydrolysis of the P–N bond to produce a stable phosphoryl-benzimidate 8 (Scheme 1B) and the corresponding S-alkylthiophosphonium adduct (6b) (Supporting Information S5). However, because these reactions were carried out in aqueous buffers, we ruled out the formation of a strained bicyclic oxazaphosphetane intermediate which could undergo an intramolecular aza-Wittig-type reaction to produce 8 (Scheme 1B).57 The HPLC isolated phosphoryl-benzimidate 8 appeared to be stable in aqueous systems. This apparent discrepancy of the intermediate formation (amidophosphonium salt vs phosphorane) in phosphine-thioester (1) and phosphine-ester (2), could be due to the leaving group effect, such that the thiolate is a better leaving group than alkoxide (or amidophosphonium salt) leading to a phosphorane in the case of 1 and GSNO.
To test the selectivity of these phosphine probes (1 and 2) over other biologically relevant glutathione-related species, we carried out reactions with GSH and glutathione disulfide (GSSG). These phosphines appeared to be quite stable toward GSH as indicated by previous reports.47,50 In contrast, under aqueous conditions the reaction of phosphine probes 1 and 2 with GSSG generated the corresponding S-alkylthiophosphonium ions 6a and 6b, which could complicate the RSNO quantification.50
In our LC–MS (ESI-TOF) experiments, the formation of 6a from 1 with GSSG was comparatively low compared to the formation of 6b from 2 (Supporting Information S6). Collectively, these studies revealed that the mild reducing ability of probe 2 could hamper RSNO trapping to a single stable conjugate in biological systems and at physiological conditions. However, the stable phosphoryl-benzimidate 8, which carries the nitrogen atom, and 6b, which carries the thiol moiety of RSNO, can be used simultaneously to detect and quantify RSNOs in physiological conditions.
Reaction of GSNO with Probe 3 in Buffer Conditions
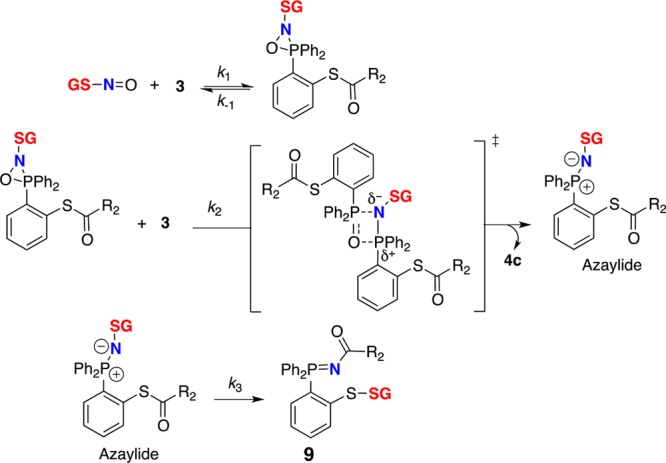
Reaction of probe 3 with GSNO in phosphate buffer (pH 5.7) led to the desired disulfide-iminophosphorane 9 (Scheme 1). Mechanistically, when the sulfur atom is directly bonded to the phenyl ring (probe 3), the resulting azaylide leads to a pseudo-sulfenamide intermediate which is then attacked intramolecularly by the phenylthiolate to yield a disulfide-iminophosphorane (9) (Scheme 1). MS analysis of 9 revealed an abundant doubly charged ion [(M + 2H)2+m/z = 350.6048] and a low abundance pseudomolecular ion [(M + H)+m/z = 700.2023] in phosphate buffer. Ionization of the tertiary-amine-containing disulfide-iminophosphorane 9 in aqueous buffers, relative to that of GSNO, was surprisingly efficient (note the extracted ion chromatogram in Figure 3). When the concentration of probe 3 (1 mM) was 200 times higher than that of GSNO (5 μM), the reaction was typically complete within 15 min at 24 °C. In addition, this chromatogram (Figure 3) illustrates the stability of 9 in the presence of excess phosphine without reduction of the disulfide bond. The only byproduct observed during the reaction was phosphoryl-disulfide 10 (yield <10%), and the corresponding S-alkylthiophosphonium ion was not observed under our experimental conditions (Figure 3 and Supporting Information S6). Furthermore, the HPLC-isolated compound 9 appeared to be quite stable in neutral or alkaline buffer conditions (phosphate or HEPES) for a prolonged period of time; however, the presence of excess phosphine 3 (100-fold) in reaction medium led to the deterioration of the signal (Supporting Information S7).
Figure 3.

Capturing GSNO as disulfide-iminophosphorane (9) by probe 3. Time- and concentration-dependent TOF-MS analysis of the reaction mixture comprising GSNO (5 μM) with probe 3 (50 μM to 1 mM) in phosphate buffer (pH 5.7) at 24 °C. Colors: 2 min = black, 12 min = red, 22 min = blue, 32 min = green. When the concentration of probe 3 (1 mM) is in 200-fold molar excess, the formation of 9 occurs within 15 min with <10% of the phosphoryl-disulfide 10. Peaks corresponding to 3 and 4c were excluded on EIC for clarity. Monitored/expected masses, GSNO: m/z = 337.0810/337.0812/[M + H]+; 9: m/z = 350.6044/350.6048 [M + 2H]2+; 10: m/z = 616.1334/616.1336 [M + H]+. Phosphate buffer at pH 5.7 was used to increase ionization and to aid in detection of GSNO. Y-axis represents the relative intensity.
To confirm further that both the nitrogen atom and the thiol (RS) moiety were maintained in the label of the original RSNO, probe 3 was incubated with 15N-labeled GSNO (GS15NO) and analyzed by LC–MS/MS (Scheme 2). These analyses revealed that both m/z = 572.1 and m/z = 396.1 contained the 15N label and hence the corresponding precursor, disulfide-iminophosphorane 9 (m/z = 351.1), compared to that of unlabeled fragments (Figure 4F).
Scheme 2. 15N Fragments Derived from the Reaction of Probe 3 and GS15NO upon Collision Induced Dissociation (CID) in MS and Possible Resonance Stabilization of m/z = 309.0.

Figure 4.

Disulfide-iminophosphorane 9 is formed in activated macrophage lysate (106 cells) upon treatment with probe 3. (A) LC–MS (TIC; total ion chromatogram) of cell lysate. (B) LC–MS/MS (MRM) of DTT-treated cell lysate (negative control). (C) MRM of cell lysate without treatment with probe 3, analyte corresponds to GSNO. (D) m/z = 350.6 → 309.0, (G) m/z = 350.6 → 487.1, (H) m/z = 350.6 → 571.1, and (E) internal standard (m/z = 352.1 → 309.0) in cell extracts. (F) Product ion spectra of 9, m/z = 350.6 [M + 2H]2+, derived from cell lysate (top), authentic standard (middle), and 15N fragment, m/z = 351.1 [M + 2H]2+, derived from the reaction of probe 3 and GS15NO (bottom). Y-axis represents the relative intensity.
These unique features support the implementation of an LC–MS-based assay for detection and quantitation of GSNO (or RSNOs) using probe 3 as an RSNO trapping agent. In biological systems, however, care must be used to prevent crossover product formation between cellular thiols and disulfide-iminophosphorane, 9, by blocking in advance all free GSH and accessible sulfhydryl groups in cysteine-containing peptides in the sample. Collectively, these results illustrate: (1) the ability of GSNO-derived azaylides to undergo aqueous Staudinger ligations to generate disulfide-iminoposphorane; (2) the ability of probe 3 to trap biological RSNOs under physiological conditions, while retaining the elements of RS and N as a single entity; and (3) favorable ionization of the tertiary-amine-containing product for quantitative analysis.
Kinetic Analysis of GSNO Trapping by Phosphine Probes
Rate constants for the aqueous trapping of GSNO by water-soluble phosphine probes 1, 2, and 3 were determined by LC–MS under pseudo-first-order conditions, i.e. 100-fold excess of phosphine in buffer at room temperature (24 °C) (Table 1).
Table 1. Pseudo-First-Order Rate Constants of Phosphine Probes (1 mM) 1,a2,a and 3,b,c and GSNO (5 μM) in Buffer Conditions.
| phosphine probe | (kobs ± SD) × 10–3 s–1 |
|---|---|
| 1 | 3.3 ± 0.3 |
| 2 | 7.3 ± 0.3 |
| 3 | 5.0 ± 0.4 |
Reactions in Tris-HCl buffer, pH 7.4, 24 °C.
Reactions in phosphate buffer, pH 7.4, 24 °C.
kobs = (2.7 ± 0.2) × 10–3 s–1 in phosphate buffer, pH 5.7.
Observation of pseudo-first-order kinetics for bis-ligation with phosphine probe 3 supports the proposed kinetic model (Scheme 3). Kinetic studies of the Staudinger ligation have shown that the process is second-order with a likely irreversible and rate-limiting first step between arylphosphines and azides.58 The major difference between the Staudinger ligation and phosphine–RSNO ligation is that the three-membered ring intermediate (Scheme 3), corresponding to phosphazide complex in Staudinger ligation, is reacting with another phosphine molecule to produce the azaylide.44 We presume that the three-membered ring intermediate reacts via a four-membered ring transition state to yield the azaylide with loss of phosphine oxide 4c and finally to disulfide-iminophosphorane 9 via an intramolecular rearrangement. Probes 2 and 3 both trap GSNO faster than probe 1 at physiological pH (Table 1 and Supporting Information S8), and this may be due to the differences in electronic properties of the phenyl ring in phosphine substrates. Moreover, the observed rate constants (kobs) are in good agreement with those of reported kinetic studies on the triarylphosphine and a benzyl azide,58 supporting an overall second-order reaction kinetics.
Scheme 3. Proposed Kinetic Model for Capturing GSNO by Probe 3.
A Quantitative Assay for GSNO Detection by Mass Spectrometry
As in other analytical determinations, sample acquisition and preparation represent critical issues, due to possible artifactual generation of RSNO or its degradation.59 In the present studies, at the time of sample preparation cells were washed at 4 °C with PBS containing EDTA while minimizing exposure to light (Supporting Information S9). Metal chelators EDTA or DTPA were included to scavenge adventitious metals, which might catalyze RSNO decomposition.60 Cells were lysed using repeated freeze–thaw cycles (−80 to 24 °C) instead of sonication, which may result in a loss of RSNO due to sulfur–nitrogen bond breaking.61 A PEG-modified maleimide (mPEG–maleimide, 20 kDa) was used for alkylating the free sulfhydryl groups on GSH and proteins. More importantly, due to the recent report that concentration of protein thiols is much higher than that of GSH in mammalian cells,62 this blocking step is required to make thiols unavailable for possible transnitrosation reactions, or for reductions, e.g., Cu(II) to Cu(I), thus minimizing RSNO decomposition. After blocking, ultrafiltration through 3000-molecular-weight cutoff (MWCO) filters was used to remove the higher molecular weight fraction, including proteins, DNA, maleimide-reacted-GSH, and excess alkylating agents, from the lysate.
The filtered lysates, comprising low-molecular weight components, were then treated with probe 3 in the dark at room temperature and were vacuum-concentrated and analyzed by LC–MS in positive ion mode. Compound 9 (m/z = 350.6) showed a clear fragmentation pattern corresponding to disulfide-iminophosphorane (Figure 4F), with the loss of glutamyl (m/z = 130.0), then to the fragment (m/z = 571.1) comprising the cysteinyl-glycine moiety in disulfide-iminoposphorane (m/z = 487.1) and an oxa-thia-phospholanium-like (m/z = 309.0) fragment, which is the most abundant daughter ion, and to the final cysteinyl-glycyl moiety (m/z = 179.1). It should be noted that both the m/z = 571.1 and m/z = 487.1 fragments (Figure 4F) contain the characteristic amino acids of GSH which ensures unbiased MS detection and identification of 9 in biological samples. By using 15N-labeled GS15NO, we further confirmed the identity of the fragments generated in CID (Figure 4F).
Quantification of GSNO was done in multiple reaction monitoring mode (MRM), with the isotopically labeled internal standard (13C2,15N-labeled GSNO; G*SNO), using the following transitions: m/z = 350.6 → 309.0, m/z = 350.6 → 487.1, m/z = 350.6 → 571.1 for analyte 9 derived from GSNO, and m/z = 352.1 → 309, m/z = 352.1 → 490.1, m/z = 352.1 → 574.1 for analyte 9 derived from G*SNO (Figure 4D,E and Supporting Information S10). Calculations were based on the peak areas in the MRM chromatograms to yield the ratio of analyte to internal standard (relative response ratio). Standard curves were constructed from solutions containing 0–10 pmol GSNO and 500 fmol of internal standard (G*SNO), followed by regression analysis of the relative response ratios (Supporting Information S11). In addition, integrated areas of GSNO peaks were corrected for recovery against internal standard peak areas, giving a relative response ratio for each sample, to account for the loss of GSNO during sample preparation.
Figure 4A shows a typical LC–MS/MS chromatogram obtained from the phosphine-treated cell lysate and indicates the quality and sensitivity of the method for the detection of GSNO. Cell lysates treated with DTT (dithiothreitol, which reduces all RSNOs to their free thiols) or phosphine-untreated cells did not lead to m/z = 350.6 → 309.0 formation (Figures 4B,C and Supporting Information S10).
Endogenous GSNO Quantification in Cancer Cells and Macrophages
Numerous studies have documented the production of NO by tumor cells in various types of cancer in vitro and in vivo. This feature has been strongly associated with sustained tumor growth and resistance to drugs and radiotherapy, both of which seem to be mediated, at least in part, by the signaling properties of NO via S-nitrosation and other mechanisms.63−68 Typically, the concentrations of NO (and those of NO metabolites such as GSNO) produced by these cells is in the nanomolar range and therefore difficult to quantify with precision, if at all.
With the above-described approach, involving probe 3, we measured endogenously produced GSNO in several human cancer cell lines (Table 2). Higher levels of GSNO were found in malignant cells of epithelial origin (A375, MCF7, and HCT116) when compared to lymphoblastoid (TK6) cells. In addition to corroborating previous reports suggesting the use of NOS expression and activity as markers of poor prognosis in various cancers,69−73 our procedure provides a specific and sensitive means to detect and quantify GSNO, a molecule of fundamental importance in modulation of cell signaling by NO via S-nitrosation. We found that activation of RAW 264.7 mouse macrophages with LPS and γ-IFN resulted in 3-fold increases in GSNO content compared to that in nonstimulated macrophages (Table 2). Since S-nitrosation has been reported to affect key steps in the activation of macrophages, (e.g., DNA-binding ability of inflammation-related transcription factors),74 these results suggest that increased S-nitrosation may also contribute to macrophage activation. Furthermore, we also observed a linear relationship between cell numbers and endogenous GSNO levels, which was detectable in as few as 105 cells (Supporting Information S12), thus confirming the sensitivity of the assay.
Table 2. Endogenous GSNO Quantification in Different Cancer Cells and Macrophages (n = 6)a.
| cell line | wet weight (mg/106 cells) | GSNO amount (pmol/106 cells) | [GSNO] ± SD (μM) |
|---|---|---|---|
| A375 | 6.0 | 23.7 | 3.9 ± 0.1 |
| HCT116 | 4.1 | 5.6 | 1.4 ± 0.1 |
| MCF7 | 9.7 | 16.8 | 1.7 ± 0.2 |
| TK6 | 2.2 | 2.0 | 0.9 ± 0.1 |
| macrophages (activated)b | 2.9 | 6.1 | 2.2 ± 0.1 |
| macrophages (nonactivated) | 2.2 | 1.2 | 0.7 ± 0.1 |
The GSNO concentration was calculated, assuming wet weight = volume for 106 cells.
Macrophages were activated by treatment with 20 U/mL IFN-γ and 20 ng/mL LPS for 24 h.
Capture of Other Endogenous Low-Molecular Weight S-Nitroso Thiols (LMW-RSNOs)
Based on the fragmentation pattern of disulfide-iminophosphorane 9, with an abundant oxa-thia-phospholanium-like daughter ion at m/z = 309.0 (Figure 4F), we conjectured that any S-nitroso compound could react with probe 3 to give the corresponding disulfide-iminophosphoranes and, upon CID, produce the common product ion m/z = 309.0.
Subsequent precursor-ion analysis of various nitrosothiols confirmed this conjecture and led to the discovery of a set of low-molecular weight S-nitroso thiols (LMW-SNOs) that produced m/z = 309.0, including S-nitrosocysteine (9a), S-nitroso-N-acetyl-cysteine (9b), S-nitrosohomocysteine (9c), S-nitroso-N-acetyl-homocysteine (9d), S-nitrosocysteinylglycine (a breakdown product of GSNO) (9e), S-nitrosocysteinylglutamine (9f), and S-nitrosated-CoA (9g) (Figure 5, Supporting Information S13 and S14). In addition, we found that not only corresponding disulfide-iminophosphoranes but also phosphoryl-thioimidates produced the typical daughter ion at m/z = 309.0, leading to the detection of nitrosated N-acetyl-penicillamine (9h) (a metabolite of the penicillin regularly added to cell culture media) (Figure 5 and Supporting Information). The m/z = 309.0 ion was present in the product ion spectra of all of these species (Supporting Information). In cancer cells, however, we detected GSNO, S-nitrosocysteine (9a less than 5% that of 9), and the metabolite 9h but not the other low-molecular weight S-nitrosothiols, suggesting that they may have been present at levels below the limit of detection.
Figure 5.

(Left) Low-molecular weight nitrosothiols (LMW-RSNOs) that produce common product ion, m/z = 309.0, upon CID. (Right) Capturing LMW-RSNOs, by LC–MS/MS using the common product ion m/z 309.0 in cell lysates: (A) S-nitrosocysteine (9a) m/z = 309.0 → 257.6. (B) S-nitrosated N-acetyl-penicillamine (9h) m/z = 309.0 → 292.6. Y-axis represents the relative intensity.
Conclusions
In summary, we report findings from investigations of the use of phosphines as selective and efficient reagents for the detection and quantification of GSNO and other low-molecular weight nitrosothiols. Reaction kinetics of disulfide-iminophosphorane 9 originating from the reaction of GSNO with phosphine probe 3 reveals that this process occurs at a rate comparable to that of classical Staudinger ligation between a phosphine and an azide. Using an mPEG–maleimide blocking step coupled to an ultrafiltration step, an LC–MS method was developed to measure levels of endogenous GSNO in several cancer cell lines. In addition, we extended the assay for the discovery of other cellular nitrosothiols. Overall, these results demonstrate the utility of this specific phosphine-capture probe to discover other low-molecular weight nitrosothiols in cell lysates, which may ultimately allow for understanding the complex physiological roles of S-nitrosation and implications in cell signaling and homeostasis.
Acknowledgments
This work was supported by the NIH (CA26731) and by the MIT Center for Environmental Health Sciences (ES002109). We acknowledge Agilent Technologies for access to the UHPLC 1290 binary pump, autosampler, degasser, and the triple quadrupole mass spectrometer. U.S. kindly thanks Drs. Charles Knutson, Ujjal Sarkar, Erika Bechtold (MIT), and Brian Smith (The Scripps Research Institute, CA) for helpful discussions.
Supporting Information Available
31P NMR and LC–MS kinetics for probe 1 and 2; 1H 13C and 31P NMR and other analytical data for compounds 1–10; LC–MS analysis of the GSSG reduction by probes 1 and 2; stability studies on 9, method calibration curves and detection limits; product ion spectra for 9–9i; and experimental details for the synthesis of compounds 1–3, 13C2,15N-labeled G*SNO, and other S-nitrosothiols. This material is available free of charge via the Internet at http://pubs.acs.org.
The authors declare no competing financial interest.
Funding Statement
National Institutes of Health, United States
Supplementary Material
References
- Dedon P. C.; Tannenbaum S. R. Arch. Biochem. Biophys. 2004, 423, 12–22. [DOI] [PubMed] [Google Scholar]
- Smith B. C.; Marletta M. A. Curr. Opin. Chem. Biol. 2012, 16, 498–506. [DOI] [PMC free article] [PubMed] [Google Scholar]
- Keszler A.; Zhang Y.; Hogg N. Free Radical Biol. Med. 2010, 48, 55–64. [DOI] [PMC free article] [PubMed] [Google Scholar]
- Keshive M.; Singh S.; Wishnok J. S.; Tannenbaum S. R.; Deen W. M. Chem. Res. Toxicol. 1996, 9, 988–993. [DOI] [PubMed] [Google Scholar]
- Dickinson D. A.; Forman H. J. Biochem. Pharmacol. 2002, 64, 1019–1026. [DOI] [PubMed] [Google Scholar]
- Broniowska K. A.; Hogg N. Antioxid. Redox Signaling 2012, 17, 969–980. [DOI] [PMC free article] [PubMed] [Google Scholar]
- Lim C. H.; Dedon P. C.; Deen W. M. Chem. Res. Toxicol. 2008, 21, 2134–2147. [DOI] [PMC free article] [PubMed] [Google Scholar]
- Hess D. T.; Matsumoto A.; Kim S. O.; Marshall H. E.; Stamler J. S. Nat. Rev. Mol. Cell Biol. 2005, 6, 150–166. [DOI] [PubMed] [Google Scholar]
- Stamler J. S.; Lamas S.; Fang F. C. Cell 2001, 106, 675–683. [DOI] [PubMed] [Google Scholar]
- Filomeni G.; Rotilio G.; Ciriolo M. R. Biochem. Pharmacol. 2002, 64, 1057–1064. [DOI] [PubMed] [Google Scholar]
- Gaston B.; Reilly J.; Drazen J. M.; Fackler J.; Ramdev P.; Arnelle D.; Mullins M. E.; Sugarbaker D. J.; Chee C.; Singel D. J. Proc. Natl. Acad. Sci. U.S.A. 1993, 90, 10957–10961. [DOI] [PMC free article] [PubMed] [Google Scholar]
- Lima B.; Forrester M. T.; Hess D. T.; Stamler J. S. Circ. Res. 2010, 106, 633–646. [DOI] [PMC free article] [PubMed] [Google Scholar]
- Mitchell D. A.; Marletta M. A. Nat. Chem. Biol. 2005, 1, 154–158. [DOI] [PubMed] [Google Scholar]
- Mitchell D. A.; Morton S. U.; Fernhoff N. B.; Marletta M. A. Proc. Natl. Acad. Sci. U.S.A. 2007, 104, 11609–11614. [DOI] [PMC free article] [PubMed] [Google Scholar]
- Barglow K. T.; Knutson C. G.; Wishnok J. S.; Tannenbaum S. R.; Marletta M. A. Proc. Natl. Acad. Sci. U.S.A. 2011, 108, E600–E606. [DOI] [PMC free article] [PubMed] [Google Scholar]
- Palmer L. A. Proc. Am. Thorac. Soc. 2006, 3, 166–169. [DOI] [PMC free article] [PubMed] [Google Scholar]
- Bellinger A. M.; Reiken S.; Carlson C.; Mongillo M.; Liu X.; Rothman L.; Matecki S.; Lacampagne A.; Marks A. R. Nat. Med. 2009, 15, 325–330. [DOI] [PMC free article] [PubMed] [Google Scholar]
- Durham W. J.; Aracena-Parks P.; Long C.; Rossi A. E.; Goonasekera S. A.; Boncompagni S.; Galvan D. L.; Gilman C. P.; Baker M. R.; Shirokova N.; Protasi F.; Dirksen R.; Hamilton S. L. Cell 2008, 133, 53–65. [DOI] [PMC free article] [PubMed] [Google Scholar]
- Foster M. W.; McMahon T. J.; Stamler J. S. Trends Mol. Med. 2003, 9, 160–168. [DOI] [PubMed] [Google Scholar]
- Lim K. H.; Ancrile B. B.; Kashatus D. F.; Counter C. M. Nature 2008, 452, 646–649. [DOI] [PMC free article] [PubMed] [Google Scholar]
- Pawloski J. R.; Hess D. T.; Stamler J. S. Proc. Natl. Acad. Sci. U.S.A. 2005, 102, 2531–2536. [DOI] [PMC free article] [PubMed] [Google Scholar]
- Uehara T.; Nakamura T.; Yao D.; Shi Z. Q.; Gu Z.; Ma Y.; Masliah E.; Nomura Y.; Lipton S. A. Nature 2006, 441, 513–517. [DOI] [PubMed] [Google Scholar]
- Anand P.; Stamler J. S. J. Mol. Med. (Berlin) 2012, 90, 233–244. [DOI] [PMC free article] [PubMed] [Google Scholar]
- Sen N.; Snyder S. H. Trends Neurosci. 2010, 33, 493–502. [DOI] [PMC free article] [PubMed] [Google Scholar]
- Richardson G.; Benjamin N. Clin. Sci. (London) 2002, 102, 99–105. [PubMed] [Google Scholar]
- Sinha V.; Wijewickrama G. T.; Chandrasena R. E.; Xu H.; Edirisinghe P. D.; Schiefer I. T.; Thatcher G. R. ACS Chem. Biol. 2010, 5, 667–680. [DOI] [PMC free article] [PubMed] [Google Scholar]
- Tsikas D.; Sandmann J.; Holzberg D.; Pantazis P.; Raida M.; Frolich J. C. Anal. Biochem. 1999, 273, 32–40. [DOI] [PubMed] [Google Scholar]
- Faccenda A.; Bonham C. A.; Vacratsis P. O.; Zhang X.; Mutus B. J. Am. Chem. Soc. 2010, 132, 11392–11394. [DOI] [PubMed] [Google Scholar]
- Doulias P. T.; Greene J. L.; Greco T. M.; Tenopoulou M.; Seeholzer S. H.; Dunbrack R. L.; Ischiropoulos H. Proc. Natl. Acad. Sci. U.S.A. 2010, 107, 16958–16963. [DOI] [PMC free article] [PubMed] [Google Scholar]
- Jaffrey S. R.; Erdjument-Bromage H.; Ferris C. D.; Tempst P.; Snyder S. H. Nat. Cell Biol. 2001, 3, 193–197. [DOI] [PubMed] [Google Scholar]
- Gow A.; Doctor A.; Mannick J.; Gaston B. J. Chromatogr., B 2007, 851, 140–151. [DOI] [PMC free article] [PubMed] [Google Scholar]
- Fang K.; Ragsdale N. V.; Carey R. M.; MacDonald T.; Gaston B. Biochem. Biophys. Res. Commun. 1998, 252, 535–540. [DOI] [PubMed] [Google Scholar]
- Nagababu E.; Rifkind J. M. Methods Mol. Biol. 2011, 704, 27–37. [DOI] [PMC free article] [PubMed] [Google Scholar]
- Saville B. Analyst 1958, 83, 670–672. [Google Scholar]
- Wink D. A.; Kim S.; Coffin D.; Cook J. C.; Vodovotz Y.; Chistodoulou D.; Jourd’heuil D.; Grisham M. B. Methods Enzymol. 1999, 301, 201–211. [DOI] [PubMed] [Google Scholar]
- Forrester M. T.; Thompson J. W.; Foster M. W.; Nogueira L.; Moseley M. A.; Stamler J. S. Nat. Biotechnol. 2009, 27, 557–559. [DOI] [PMC free article] [PubMed] [Google Scholar]
- Forrester M. T.; Foster M. W.; Benhar M.; Stamler J. S. Free Radical Biol. Med. 2009, 46, 119–126. [DOI] [PMC free article] [PubMed] [Google Scholar]
- Jaffrey S. R.; Snyder S. H. Sci. STKE 2001, 86, l1. [DOI] [PubMed] [Google Scholar]
- Monteiro G.; Horta B. B.; Pimenta D. C.; Augusto O.; Netto L. E. Proc. Natl. Acad. Sci. U.S.A. 2007, 104, 4886–4891. [DOI] [PMC free article] [PubMed] [Google Scholar]
- Landino L. M.; Koumas M. T.; Mason C. E.; Alston J. A. Biochem. Biophys. Res. Commun. 2006, 340, 347–352. [DOI] [PubMed] [Google Scholar]
- Hunter R. A.; Storm W. L.; Coneski P. N.; Schoenfisch M. H. Anal. Chem. 2013, 85, 1957–1963. [DOI] [PMC free article] [PubMed] [Google Scholar]
- Wang H.; Xian M. Curr. Opin. Chem. Biol. 2011, 15, 32–37. [DOI] [PMC free article] [PubMed] [Google Scholar]
- Bechtold E.; King S. B. Antioxid. Redox Signaling 2012, 17, 981–991. [DOI] [PMC free article] [PubMed] [Google Scholar]
- Wang H.; Xian M. Angew. Chem., Int. Ed. 2008, 47, 6598–6601. [DOI] [PubMed] [Google Scholar]
- Zhang J.; Wang H.; Xian M. Org. Lett. 2009, 11, 477–480. [DOI] [PubMed] [Google Scholar]
- Zhang J.; Wang H.; Xian M. J. Am. Chem. Soc. 2009, 131, 3854–3855. [DOI] [PubMed] [Google Scholar]
- Zhang J.; Li S.; Zhang D.; Wang H.; Whorton A. R.; Xian M. Org. Lett. 2010, 12, 4208–4211. [DOI] [PMC free article] [PubMed] [Google Scholar]
- Saxon E.; Armstrong J. I.; Bertozzi C. R. Org. Lett. 2000, 2, 2141–2143. [DOI] [PubMed] [Google Scholar]
- Saxon E.; Bertozzi C. R. Science 2000, 287, 2007–2010. [DOI] [PubMed] [Google Scholar]
- Bechtold E.; Reisz J. A.; Klomsiri C.; Tsang A. W.; Wright M. W.; Poole L. B.; Furdui C. M.; King S. B. ACS Chem. Biol. 2010, 5, 405–414. [DOI] [PMC free article] [PubMed] [Google Scholar]
- Cline D. J.; Redding S. E.; Brohawn S. G.; Psathas J. N.; Schneider J. P.; Thorpe C. Biochemistry 2004, 43, 15195–15203. [DOI] [PubMed] [Google Scholar]
- Han J. C.; Han G. Y. Anal. Biochem. 1994, 220, 5–10. [DOI] [PubMed] [Google Scholar]
- Houk J.; Singh R.; Whitesides G. M. Methods Enzymol. 1987, 143, 129–140. [DOI] [PubMed] [Google Scholar]
- Reisz J. A.; Klorig E. B.; Wright M. W.; King S. B. Org. Lett. 2009, 11, 2719–2721. [DOI] [PubMed] [Google Scholar]
- Reisz J. A.; Zink C. N.; King S. B. J. Am. Chem. Soc. 2011, 133, 11675–11685. [DOI] [PMC free article] [PubMed] [Google Scholar]
- Li S.; Wang H.; Xian M.; Whorton A. R. Nitric Oxide 2012, 26, 20–26. [DOI] [PMC free article] [PubMed] [Google Scholar]
- Saxon E.; Luchansky S. J.; Hang H. C.; Yu C.; Lee S. C.; Bertozzi C. R. I J. Am. Chem. Soc. 2002, 124, 14893–14902. [DOI] [PubMed] [Google Scholar]
- Lin F. L.; Hoyt H. M.; van H. H.; Bergman R. G.; Bertozzi C. R. J. Am. Chem. Soc. 2005, 127, 2686–2695. [DOI] [PubMed] [Google Scholar]
- Bramanti E.; Angeli V.; Paolicchi A.; Pompella A. Life Sci. 2011, 88, 126–129. [DOI] [PubMed] [Google Scholar]
- Dicks A. P.; Williams D. L. Chem. Biol. 1996, 3, 655–659. [DOI] [PubMed] [Google Scholar]
- Doulias P. T.; Raju K.; Greene J. L.; Tenopoulou M.; Ischiropoulos H. Methods 2012, 10.1016/j.ymeth.2012.10.009. [DOI] [PMC free article] [PubMed] [Google Scholar]
- Hansen R. E.; Roth D.; Winther J. R. Proc. Natl. Acad. Sci. U.S.A. 2009, 106, 422–427. [DOI] [PMC free article] [PubMed] [Google Scholar]
- Godoy L. C.; Anderson C. T.; Chowdhury R.; Trudel L. J.; Wogan G. N. Proc. Natl. Acad. Sci. U.S.A. 2012, 109, 20373–20378. [DOI] [PMC free article] [PubMed] [Google Scholar]
- Fitzpatrick B.; Mehibel M.; Cowen R. L.; Stratford I. J. Nitric Oxide 2008, 19, 217–224. [DOI] [PubMed] [Google Scholar]
- Iyer A. K.; Azad N.; Wang L.; Rojanasakul Y. Nitric Oxide 2008, 19, 146–151. [DOI] [PMC free article] [PubMed] [Google Scholar]
- Jeannin J. F.; Leon L.; Cortier M.; Sassi N.; Paul C.; Bettaieb A. Nitric Oxide 2008, 19, 158–163. [DOI] [PubMed] [Google Scholar]
- Lechner M.; Lirk P.; Rieder J. Semin. Cancer Biol. 2005, 15, 277–289. [DOI] [PubMed] [Google Scholar]
- Switzer C. H.; Cheng R. Y.; Ridnour L. A.; Glynn S. A.; Ambs S.; Wink D. A. Breast Cancer Res. 2012, 14, R125. [DOI] [PMC free article] [PubMed] [Google Scholar]
- Jaiswal M.; LaRusso N. F.; Gores G. J. Am. J. Physiol.: Gastrointest. Liver Physiol. 2001, 281, G626–G634. [DOI] [PubMed] [Google Scholar]
- Ambs S.; Glynn S. A. Cell Cycle 2011, 10, 619–624. [DOI] [PMC free article] [PubMed] [Google Scholar]
- Ali-Fehmi R.; Semaan A.; Sethi S.; Arabi H.; Bandyopadhyay S.; Hussein Y. R.; Diamond M. P.; Saed G.; Morris R. T.; Munkarah A. R. Cancer 2011, 117, 301–309. [DOI] [PubMed] [Google Scholar]
- Azad N.; Iyer A. K.; Wang L.; Lu Y.; Medan D.; Castranova V.; Rojanasakul Y. Am. J. Respir. Cell Mol. Biol. 2010, 42, 578–585. [DOI] [PMC free article] [PubMed] [Google Scholar]
- Massi D.; Franchi A.; Sardi I.; Magnelli L.; Paglierani M.; Borgognoni L.; Maria R. U.; Santucci M. J. Pathol. 2001, 194, 194–200. [DOI] [PubMed] [Google Scholar]
- Schroeder R. A.; Cai C.; Kuo P. C. Am. J. Physiol. 1999, 277, C523–C530. [DOI] [PubMed] [Google Scholar]
Associated Data
This section collects any data citations, data availability statements, or supplementary materials included in this article.