Abstract
This report introduces a novel diagnostic and therapeutic platform for in vivo noninvasive detection and treatment of metastases in sentinel lymph nodes (SLNs) at single cell level using an integrated system of multicolor photoacoustic (PA) lymph flow cytometry, PA lymphography, absorption image cytometry, and photothermal (PT) therapy. A melanoma-bearing mouse model was used to demonstrate the capability of this platform for real-time lymphatic mapping, counting of disseminated tumor cells (DTCs) in prenodal lymphatics, and detection of metastasis in SLNs and its purging. The detection and ablation of non-pigmented breast cancer cells in SLNs was achieved by labeling them with nanoparticles. The association between DTC count and SLN metastasis progression supports lymphatic DTCs as a novel prognostic marker of metastasis. The fiber-based portable PA device may replace the conventional SLN(s) excision and histology-based staging. The earliest detection of DTCs in the lymphatic vessels before the establishment of nodal metastasis may prevent metastasis by well-timed ablation of DTCs.
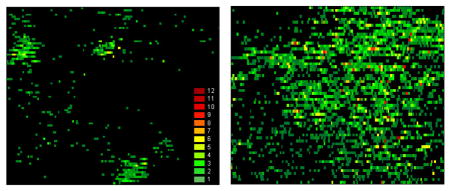
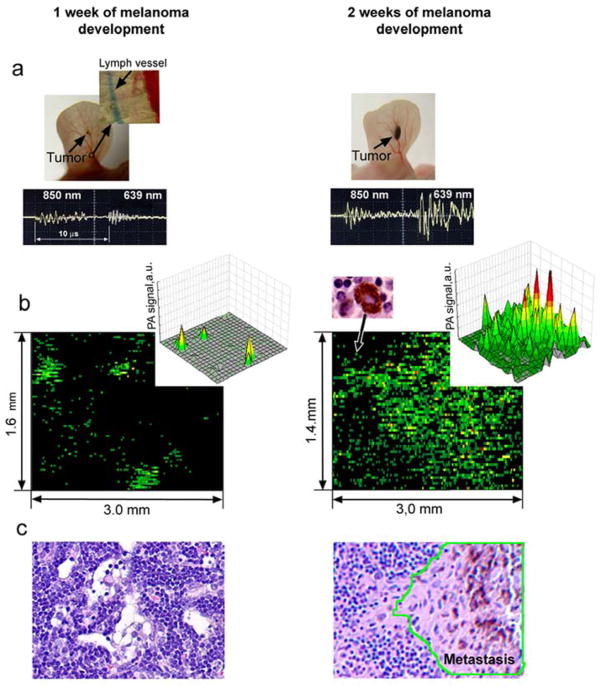
Photoacoustic mapping of melanoma metastasis in sentinel lymph node (1.6 × 3 mm) at single cancer cell level using tumor-bearing mouse model at week one (left) and two (right) of tumor development. Red pseudo-color peaks indicate the photoacoustic signals with maximum amplitudes.
Keywords: metastasis, sentinel lymph nodes, photoacoustic imaging, photothermal therapy, nanoparticles
1. Introduction
Cancer metastases, which originate from detached tumor cells, are major causes of mortality [1–3]. These cells can disseminate through afferent (prenodal) lymph vessels to sentinel lymph nodes (SLNs), which have dual roles as the first identifiable metastatic site and immune barrier for cancer cells. The presence of metastatic cancer in SLNs (i.e., positive SLNs) is one of the most important prognostic factors for survival in cancer patients [2, 3]. Traditionally, SLN assessment involves mapping of SLNs and surgical excision for histological and immunohistochemical detection of intranodal metastasis [4]. This procedure is invasive and time-consuming, and can lead to complications related to surgical procedure. The progress in in vivo mapping of lymph nodes with reasonable precision has been made with many advanced technologies such as computer tomography, positron emission tomography, multiphoton microscopy, magnetic resonance imaging (MRI) with magnetic nanoparticles (NPs), radio-lymphoscintigraphy with 99mTc-sulfur-colloid-, albumin- or gadolinium-labeled contrast agents, and optical lymphography with blue dyes or multicolor quantum dots (QDs) [4–12]. However, most of these techniques are limited in their ability to assess SLN status due to their still poor sensitivity and depth resolution (e.g., a few mm for optical technique), require high concentration of contrast agents because of the influence of background signals, and provide only anatomic and non-functional maps, which cannot image lymphatic tracers together with real-time counting of tumor cells in lymph flow and lymph nodes. Also the optimal NPs for imaging the SLNs remain unclear due to the concerns of toxicity for radio- or fluorescent contrast agents. As a result of these challenges, SLNs with micrometastases and, especially, cancer cells in lymphatics may remain undetected until there is sufficient tumor burden to be detected by current techniques. This may understage a patient and delay the initiation of systemic therapy. In addition, metastases, which escape detection, results in erroneous clinical decision-making and treatment.
The photoacoustic (PA) techniques using endogenous chromophores (e.g., melanin or hemoglobin) or NPs as PA contrast agents have demonstrated tremendous potential for imaging tumors in vivo with higher resolution in deeper tissues (up to 3–5 cm) compared to existing optical modalities [13–18]. In particular, our team pioneered an application using carbon nanotubes (CNTs) [15], QDs [19], and golden carbon nanotubes (GNTs) [20] as PA contrast agents and developed in vivo flow cytometry with photothermal (PT) [21] and PA [22] detection schematics for real-time counting of circulating tumor cells targeted by advanced NPs. We also first suggested the possibility of using the PA method for assessing SLNs [15, 16, 20, 23] and demonstrated multicolor PA detection of disseminated tumor cells (DTCs) in lymphatics using tumor bearing animal models. Recently, PA imaging technique with microscopic schematic was successfully applied for mapping of lymph nodes with depths up to ~3 cm in animal models using blue dyes and NPs as contrast agents [24–26]. However, the diagnostic capability of PA technique for detection of metastasis in SLNs and counting metastatic cells transported by lymph to SLNs has not been explored despite its high clinical significance for early staging and treatment of cancer. Our present study shows that PA detection of metastasis in SLNs can be integrated with their PT purging using a fiber-based multimodal diagnostic-therapeutic platform with time-resolved multicolor PA lymphography, PA lymph flow cytometry, and PT therapy.
2. Materials and methods
2.1 Principles and schematics of integrated PA–PT setup
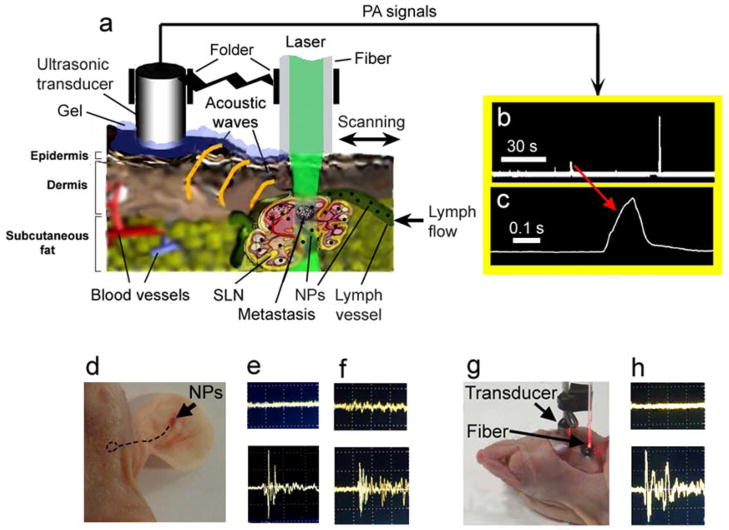
The setup was built on the platform of an upright Olympus BX51 microscope (Olympus America, Inc.), with incorporated PA, PT, fluorescent, transmission digital microscopy (TDM), and fiber modules as previously described [11, 12, 16, 20, 27, 28] (Figure 1a and supplementary data [SD] #1). Briefly, a tunable pulse optical parametric oscillator (OPO, Lotis Ltd., Minsk, Belarus) was used to irradiate samples at the following parameters: wavelength, 420–2,300 nm; pulse width, 8 ns; beam diameter, 10–100 μm; fluence range, 1–104 mJ/cm2; and pulse repetition rate, 10–50 Hz. In selected experiments, a diode laser (905 nm, 15 ns, 10 kHz, 0.01–0.7 J/cm2, model 905-FD1S3J08S, Frankfurt Laser Company) with driver IL30C (Power Technology Inc, Little Rock, AR) was used for detection of melanoma cells. PA waves were detected by ultrasound transducers (model 6528101, 3.5 MHz, 5.5 mm in diameter; Imasonic Inc., Besançon, France), then amplified (amplifier 5660B, band 2 MHz, gain 60 dB; Panametrics) and recorded with a Boxcar (SR250, Stanford Research Systems, Inc.), Tektronix TDS 3032B oscilloscope, and a computer using standard and customized software. The ultrasound gel or warm water was used to provide acoustic and optical matching between tissue and transducer.
Figure 1.
In vivo fiber-based integrated PA lymphography, PA flow lymph cytometry, and PT therapy. (a) Schematic. (b) The typical trace of digitized signals from flowing melanoma cells in ear lymphatics. Each signal is based on the acquisition of ~40 PA signals induced by high pulse rate diode laser. Laser parameters: wavelength, 905 nm; pulse width, 15 ns, pulse rate, 9 kHz; laser fluence, 90 mJ/cm2. (c) The temporal shape of one zoomed digitized signal. (d) Injection of NPs in mouse ear (arrow). Dashed circle indicates the position of SLN. (e and f) PA signal amplitude from site over SLNs before (top) and after (bottom) injection of GNTs and MNPs at 850 nm and 639 nm, respectively. Laser fluence at the tip of fiber is 15 mJ/cm2 and 35 mJ/cm2 at 850 nm and 639 nm, respectively. (g) Direct visualization and PA mapping of the SLN after skin incision. (h) Background PA signals (top) at the scanning of surrounding tissue outside the SLN and PA signals (bottom) at scanning directly over the labeled SLN with MNPs. Laser wavelength and fluence are 639 nm and 35 mJ/cm2, respectively.
Two-color mapping of lymphatics and identification of NPs was realized with two laser pulses at wavelength of 850 nm (OPO) and 639 nm (Raman shifter) with 10 μs delay, followed by time-resolved detection of corresponding PA waves [16].
Delivery of laser radiation to samples was performed either with a microscope schematic or with a 400 μm diameter fiber with focusing tip fixed in a customized folder (Figure 1a). PA microscope was integrated with a PT module [27]. In PT thermolens mode, a laser-induced refractive heterogeneity, called a thermolens effect, causes defocusing of a collinear He-Ne laser probe beam (wavelength, 633 nm; power, 1.4 mW) and hence, a reduction in the beam’s intensity at its center, similar to detection by a photodiode (C5658; Hamamatsu Corp.) with a pinhole. A fluorescence module with colored CCD camera (Nikon DXM1200) was added to verify the PA/PT data. Navigation of the laser beams as well as anatomic microstructure of SLNs was controlled with high-resolution (300 nm) TDM. An in vitro study was performed with cells in suspension on conventional 120 μm thick microscope slides. PA mapping was achieved in vivo and ex vivo by spatial scanning of focused beam or fiber across samples using an automatic microscopic stage (Conix Research, Inc) and visual basic software with a total scanning time of 1–10 min depending on sample size.
2.2 Nanoparticles
The magnetic NPs (MNPs) as well recognized lymphographic tracer [8] and novel GNTs [20] were used as PA contrast agents. The 30-nm spherical PEG-coated MNPs with a Fe2O3 core were provided by Ocean NanoTech (Springdale, AR). Customized GNTs were synthesized as reported previously [20] and consisted of hollow single-walled CNTs surrounded by thin gold layers with an average dimension of 12.8 nm × 91.7 nm. They exhibited high water solubility and biocompatibility, low cytotoxicity (due to the protective layer of gold around the CNTs [20, 29]), and high plasmon absorption in the near-infrared (NIR) range of 850 nm [20]. The GNTs were conjugated with folate, which are highly expressed in selected human breast tumors and are not expressed in normal endothelial cells in lymphatics.
2.3 Cell culture
B16F10 mouse melanoma cells and MDA-MB-231 human breast cancer cells (American Type Culture Collection, Manassas, VA) were cultured according to the vendor’s specifications. Viable cells were resuspended in PBS for all tests. For verification purpose, the melanoma cells (1×10⁴ cells) were stained with fluorescein isothiocyanate (FITC) using standard procedure (15 min at 37°C), while the bulk of breast cancer cells (1×10⁴ cells) were double labeled with GNT-folate conjugates (overnight at 37°C) and FITC. The labeling efficiency was estimated in vitro using fluorescent technique (e.g., ~99% efficiency for FITS) and by comparing PA/PT signals from labeled and control cells at selected wavelengths (see other details in SD#2).
2.4. Animal model
Nude nu/nu mice weighing 20–25 g, purchased from Harlan Sprague-Dawley (Harlan Sprague-Dawley Indianapolis, IN), were used to verify the efficacy of PA/PT technique in accordance with protocols approved by the UAMS Institutional Animal Care and Use Committee. Mice were anesthetized with intraperitoneal injection of ketamine/xylazine, 50mg/10mg/kg and then placed on a warmed microscopic stage. Melanoma tumors were created in the mouse ear by inoculating 106 B16F10 melanoma cells in 50 μl of phosphate-buffered saline (PBS) with a 30-gauge needle. The progression to metastatic disease was estimated by measurements of primary tumor size and subsequently verified with PA evaluation and histology. Also the breast cancer cells were injected with a microsyringe (Beckton Dickson and Co., Franklin Lakes, NJ) directly in the lymph nodes to mimic metastasis.
2.5 Lymph node examination
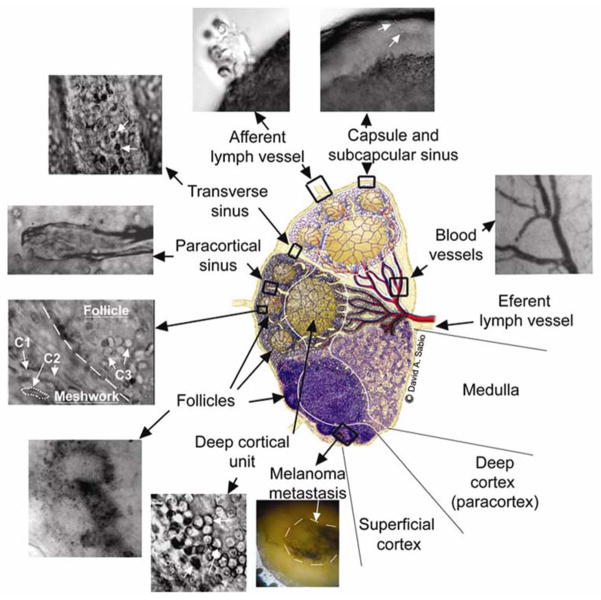
In vivo and ex vivo PA mapping and microscopic and H&E pathological examination of lymph nodes were performed at 1 and 2 weeks after melanoma tumor cell inoculation. In vivo assessment of SLNs and lymphatic vessels was performed noninvasively through intact skin and intraoperatively through a small skin incision overlying the SLN and direct attachment of the folder with a fiber to skin and the lymph node, respectively. For ex vivo study, lymph nodes were excised without fat and surrounding tissues from the mouse and placed in a well (8 mm in diameter and 2 mm in depth; Molecular Probes) of a microscope slide to obtain the optical images at the different magnifications (4×, 10×, 20×, 40×, 100× with oil immersion). To decrease beam blurring due to light scattering in a lymph nodes, the nodes were embedded for 5 minutes in 40% glucose, 100% DMSO, and 80% glycerol as hyperosmotic “clearing” agents, which reduce biotissue scattering [30]. Comparisons of optical images with different agents and PBS (control) revealed that glycerol had a maximal optical clearing (Figure 2). The treatment of SLNs with 80% glycerol permitted the label-free imaging of a fresh node at the cellular level including localization of immune-related, metastatic, and other cells (e.g, lymphocytes, macrophages, dendritic cells, and melanoma cells) as well as surrounding microstructures (e.g., afferent lymph vessel, subcapsular and transverse sinuses, the medulla, a reticular meshwork, follicles, and the venous vessels) (Figure 3 and SD#3). The combination of PA mapping of SLN metastases with high resolution TDM mode (up to 300 nm) allowed us to assess exact distribution and number of melanoma metastasis and laser-induced damage area. To confirm that the PA signals and following PT purging are related to the tumor cells (evaluation of false-positive signals), the cells were additionally labeled with FITC and imaged with fluorescence techniques. For histological & immunohistochemistry analysis, the examined SLNs were fixed in phosphate-buffered 10% formalin (pH 7.2) and then embedded in paraffin. Multiple 5 μm sections at 200 μm intervals were cut through the entire node and studied with conventional histology with H&E according to the manufacturer’s instructions.
Figure 2.
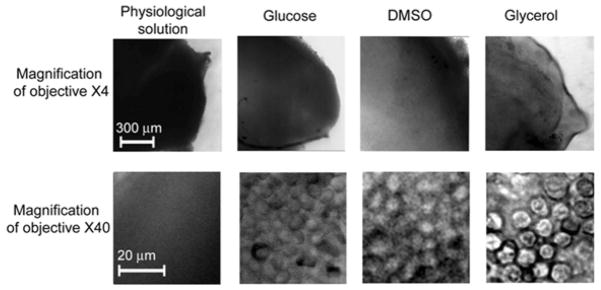
The effect of 40% glucose, 100% DMSO, 80% glycerol, and PBS on the optical imaging of a lymph node ex vivo at the different microscopic magnifications. PBS served as a control.
Figure 3.
Optical imaging of microanatomy of the fresh lymph node ex vivo obtained with optical clearance using 80% glycerol. The central schematic designed by David Sabio [44] shows a midsagital section of a lymph node containing three lymphoid lobules with the basic anatomical and functional unit of the lymph node. Top and middle lobules: microanatomical schematics of lobular compartments (superficial cortex, deep cortex and medulla) without (top) and with (middle) reticular meshwork. Bottom lobule: a lobule of a mouse lymph node as it appears in conventional histological section. C1 shows basophilic lymphocytes; C2 shows elongated fibroblastic reticular cells; and C3 shows B lymphocytes and follicular dendritic cells (see other details in SD # 3).
2.6 Statistical analysis
Results are expressed as means plus/minus the standard error of at least three independent experiments (P <0.05). Statistica 5.11 software (StatSoft, Inc.) and MATLAB 7.0.1 (MathWorks) were used for the statistical calculations.
3. Results
3.1 Two-wavelength PA lymphography with multicolor nanoparticles
PA technique was employed for identification of lymph vessels and node location using MNPs and GNTs as PA lymphographic contrast agents. To evaluate two lymphatic basins, MNPs and GNTs (each ~1011 NPs/mL in 5 μl of PBS; MNP/GNT proportion of 20:80) were intradermally injected in the tip of the left and right mouse ears of intact healthy animals (n=4). The prior measurement of PA spectra of NPs revealed that 639 nm is the optimal wavelength providing the best PA contrast of MNPs in tissues and minimal interference with GNTs that have a maximum absorption at 850 nm [20]. The dual-color PA mapping using two laser pulses at 639 nm and 850 nm was performed immediately after injection and then periodically every 10 minutes for 5 hrs. Then, co-injection of GNTs with conventional Evans Blue (EB) dye (5 μl) provided additional visualization of lymphatic vessels and SLNs. This dye with absorption in the visible region (below 660 nm) was chosen to avoid interference from GNTs with maximum absorption in the NIR region. This study revealed that NPs quickly entered into lymphatics and migrated in less than 3–5 minutes to left and right cervical lymph nodes at a depth of 2–3 mm. This is in line with rapid uptakes of small NPs by lymphatics [31, 32]. PA signal amplitude at 850 nm on the site over SLNs before and after injection of GNTs increased from 1.5±0.2 a.u. to 30.1±3.2 a.u. (10 min after injection, p=0.05). The PA signal amplitude at 639 nm from the site over SLNs before and after injection of MNPs increased from 2.2±0.3 a.u. to 8.7±0.9 a.u. (p = 0.01). This led to an increase in PA contrast (as ratio of signals before and after injection at the skin site overlying SLNs) of ~20 for GNTs and ~4 for MNPs at 850 nm and 639 nm, respectively. The PA signals from a SLN with MNPs were stable for three hours with slight decreasing amplitude to background at 5 hrs after injection; however, the clearance of GNTs was faster, with decreasing amplitude to almost background 1–1.5 hr after injection. Co-injection of GNTs (Figure 1d) with EB dye yielded co-localization of PA signals from GNTs (850 nm) and EB (639 nm) verifying GNTs as a novel PA high-contrast NIR lymphographic tracer (Figure 1e and f). To confirm accumulation of MNPs and GNTs in SLNs, we also incised and retracted the overlying skin to inspect SLNs directly (Figure 1g). PA mapping by scanning of the fiber across the samples demonstrated that the high-amplitude PA signals were exclusively from the SLNs with PA contrast of 55 for GNTs and 14 for MNPs (Figure 1h) at 850 nm and 639 nm, with signal averaging of 1 sec.
3.2 Detection of tumor cells in lymphatics and SLNs in a melanoma model
The feasibility of the integrated PA platform for assessment of lymphatic DTCs and SLN status was first tested in a melanoma tumor model. Melanoma is a malignancy that is rising epidemically, which can quickly progress to incurable metastasis [33]. Conventional diagnostic tools have a high false-negativity (~25%) in detecting positive SLNs [34]. From a clinical perspective, melanin is a very promising endogenous (i.e., nontoxic) PA contrast agent and provides PA signals from individual pigmented melanoma cells above blood background in NIR range, whose absorption (similar to MNPs) slightly decreases as the wavelength increases [16, 28]. Monitoring of the PT signals from individual B16F10 cells (total 300) in suspension demonstrated a high level of heterogeneity: the 5–10% of cells with increased pigmentation produced PT signals with an amplitude much greater than that of PT signals from cells with less pigmentation [28]. Approximately 82±3,8% of tumor cells were detectable with the PT/PA technique.
The entire diagnostic procedure took 10–20 min and involved injection of PA lymphographic agent (5 μl of MNPs or EB) near the ear tumor and PA mapping of lymphatic vessels with counting of melanoma cells in the collecting prenodal lymph vessel and mapping of the SLN for detection of metastasis. Specifically, after a visible primary melanoma tumor had developed in the mouse ear, the injection of MNPs provided stronger PA signals from lymphatics and SLNs at 639 nm. However, similar NIR absorption spectra of MNPs and melanin made it difficult for spectral identification of melanoma metastasis in the presence of MNPs. To resolve this problem, we used EB dye, which absorbed slightly at 639 nm only, while the presence of melanoma cells in lymphatics and in a node was identified through the appearance PA signals at 850 nm. Because absorption of melanin [16, 28] also occurred at 639 nm above the background from EB dye, we used specific ratio of PA signals at 639 and 850 nm for additional identification of melanoma cells [28]. In addition, EB injection was used to visually differentiate afferent lymph vessel that was exclusively collecting lymph from the tumor (Figure 4a, top, callout). Many (20–50) diode-laser induced PA signals from the same flowing melanoma cells in lymphatics were acquired using Boxcar system and transformed into signals with width determined by the transit time of the cells through the laser beam (Figure 1 b and c; see details of acquisition algorithms in [16,28]). Real-time PA monitoring of prenodal lymph vessels from the primary tumor and the SLN revealed that the number of metastatic cells producing rare flash PA signals, which increased from 0.26±0.05 cells/min to 2.13±0.3 cells/min at 1 and 2 weeks after melanoma inoculation. At 1 week post-inoculation, the primary tumor size was 1.0±0.2 mm2 (Figure 4a, left) and PA signals associated with individual melanoma cells (single green spots) and three SLN micrometastases were identified with PA contrast of 10±2 (Figure 4b, left). At two weeks, the primary tumor size was increased to 3.6±0.5 mm2 (Figure 4a, right) and much larger number of PA signals with higher contrast of 50±2 were detected, including 7–10 high-amplitude signals, which were indicative of macrometastases (Figure 4b, right). The histology of these nodes showed an absence of metastases at 1 week (Figure 2 and 4c), but single metastases were present on histology at 2 weeks post-inoculation (Figure 3, and 4c, right). This result is consistent with the ability of PA technique to detect single cell metastases with improved sensitivity over conventional histology [16, 28]. Thus, an increase in the quantity of lymphatic DTCs by ~10 times is accompanied by ~4-fold increase in the number of PA signals and 5-fold increase in their mean amplitude from the SLNs that were associated with an increased number and size of melanoma micrometastases in the SLNs. This demonstrates the capability of PA technique to not only detect early micrometastasis including individual metastatic cells (at week one), which cannot be achieved by conventional histological assays, but also confirm a correlation between lymphatic DTCs, primary tumor size, and SLN metastasis status.
Figure 4.
PA detection and counting of melanoma metastasis during tumor development. (a) Photo of tumor at week 1 (left) after inoculation with visualization of the lymph vessel (using EB dye) collecting lymph from primary tumor area (top, callout) and in vivo two-wavelength PA detection (bottom oscilloscope) of melanoma metastasis with tumor progression in the SLN at first (left) and second (right) week. (b) Ex vivo PA mapping of the SLN with melanoma metastasis at single cell level at 1 (left) and 2 (right) week(s) of primary tumor development. The data are presented as 2-D high-resolution (bottom) and 3-D low-resolution (top, callout) simulation. Each green spot on bottom is associated with single metastatic cells showed on right panel (top, left callout). Red pseudo-color peaks indicate the photoacoustic signals with maximum amplitudes. (c) Histological images of the investigated SLNs demonstrating no histological changes at week 1 (left) and the detectable metastases, contoured by green line, at week 2 after tumor inoculation (right).
3.3. PA detection of breast cancer metastases in SLNs with functionalized NPs
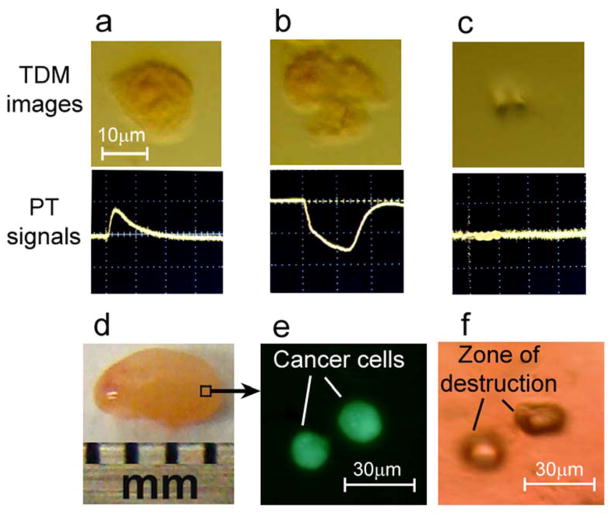
To explore the feasibility of PA technology to detect non-pigmented metastasis, low absorbing MDA-MB-231 breast cancer cells were labeled with GNT-folate conjugates [20, 35]. The SLN was identified by PA technique at 639 nm with injection of 5 μl of MNPs as described above. Then a 10 μl of suspension with a limited number (~100) of labeled breast cancer cells was injected directly into target lymph nodes. Immediately after this injection, the appearance of PA signals at 850 nm was observed. To ensure that these signals were from cancer cells, we performed additional dual labeling of cells with folate-GNTs and fluorescent dye (FITC). The ex vivo mapping of SLNs with injected cells using PA and fluorescent techniques showed that PA signals were exclusively from fluorescent cells (Figure 5d and e).
Figure 5.
Targeted laser purging of SLN metastasis. (a–c) Laser ablation of MDA-MB-231 breast cancer cells labeled by GNT-folate conjugates: linear PT response from live cell (left), non-linear PT response from damaged cell (middle), and the disappearance of PT signal after cell disintegration by high energy laser pulse as feedback control of therapeutic efficacy (right). (d) Laser targeted ablation of single breast cancer cells double labeled by GNT-folate and FITC injected in the lymph node ex vivo (left) was verified at single cell level by fluorescent microscopy (middle). The right image indicates the zone of the high local destruction (40×30 μm) within the lymph node after cancer cell elimination.
3.4 Targeted laser PT purging metastases in a SLN
To examine the application of this novel tool for targeted therapy of metastases, PA technique was integrated with PT therapy based on laser-induced microbubbles around overheated GNTs [20] or melanin clusters [28] as a main mechanism of cell damage. A low laser pulse energy (20 mJ/cm2) at 850 nm produced a linear PT responses in vitro from single breast cancer cells labeled with GNTs with characteristic unipolar positive pattern associated with fast cell heating and slower cooling (Figure 5a, bottom). However, at increased pulse energy from 20 to 100 mJ/cm2, a negative peak was observed (Figure 5b, bottom), which is indicative of microbubble formation, with subsequent cell disintegration (Figure 5b and c, top). When the double labeled (GNTs–folate–FITC) breast cancer cells were injected into lymph nodes and exposed once with laser pulses with increased energy, there was an in situ disappearance of both PT/PA signals (Figure 5 c) and fluorescence images at the second laser exposure which correlated with cell disintegration. The strong localization of damaged areas in the lymph node tissue was confirmed by transmission images (Figure 5f). We used the similar protocol for purging melanoma metastasis in SLNs in vivo at two weeks after tumor inoculation in the mouse ear (Figure 6a). Briefly, application of one nanosecond laser pulse at 639 nm with different fluence of 80, 200, and 400 mJ/cm2 led to decrease of PA signals during second laser pulses (Figure 6c). The PA signal levels detected using low fluence laser pulses after exposure with high fluence laser pulses were comparable to the background signals in an intact SLN without melanoma, indicating that there was complete laser ablation of melanoma metastasis. This skin superficial to the SLNs at a depth of 2–3 mm was intact at low energy (like in Figure 6a) and was partly damaged at high laser energy (Figure 6b).
Figure 6.
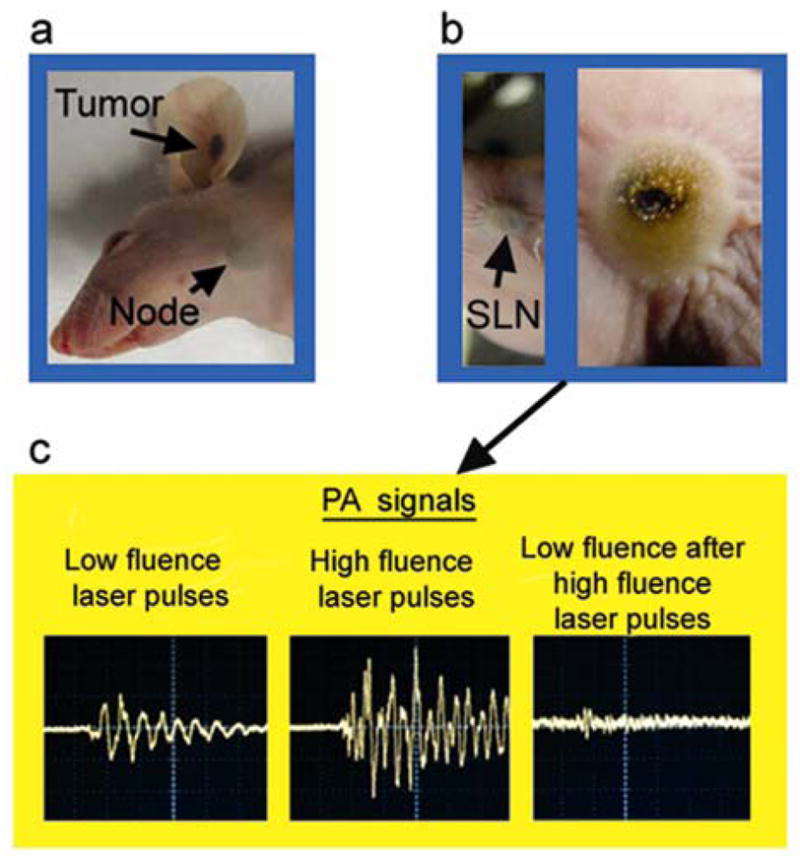
(a) Melanoma in the mouse ear with micrometastasis in the SLN at week 2 after tumor inoculation. (b) Laser-induced localized damage of the SLN containing melanoma micrometastasis at different laser energy, respectively. Laser parameters: wavelength, 639 nm; 10 laser pulses with overlapping beams with diameter on skin of 1 mm; laser fluence, 200 mJ/cm2 (b, left) and 750 mJ/cm2 (b, right). (c) PA signals from the SLN using a low fluence laser pulse, 50 mJ/cm2 (left); at high fluence laser pulse, 400 mJ/cm2 (middle); and at low fluence laser pulse again, 50 mJ/cm2 after high fluence laser pulse (right). Amplitude (vertical axis), time scale (horizontal axis): 100 mV/div, 2 μs/div (left); 500/div, 2 μs (middle); 20 mV/div, 2 μs/div (right).
4. Discussion
To the best of our knowledge, this is the first report of a robust multifunctional PA/PT platform, which by integrating time-resolved multicolor PA lymphography, PA lymph flow cytometry, and PT therapy provides real-time mapping of lymph vessels and SLNs, counting DTCs in prenodal lymphatics, and diagnosis of early metastasis in SLNs and its purging. The integrated PA diagnostic and PT therapy can be performed at single cancer cell level as verified in our previous [15, 16, 28] and present studies. Thus, this technology overcomes the limitation of existing techniques (see Introduction section) and permits simultaneously distinguishing lymphatic flow and SLNs with flowing and static tumor cells. Using this platform, the diagnostic value of SLN status could be significantly improved by quantitative molecular detection of DTCs in prenodal lymph before they colonize in SLNs. As a result, prevention or at least inhibition of metastatic progression can be potentially achieved by noninvasive targeted PT therapy of early DTCs and micrometastasis precisely in SLNs. The applicability of this approach was recently demonstrated for circulating melanoma cells in blood [28], where with increased laser energy decreases in the melanoma cell count in blood were observed.
A challenge of this approach will be to select cancer metastasis biomarkers and NP parameters and to determine how to distinguish molecular-based targeting of metastasis compared to nonspecific uptake of dyes and NPs by SLNs (e.g., due to phagocytosis of NPs by macrophages or natural killer cell action that lead to increase false-positivity) [8, 32]. As we discovered, there is a shorter retention period for non-conjugated GNTs in SLNs (1–1.5 hr) compared to other NPs and dyes (from many hours to several days) [8, 25]. This finding confirms other observations that phagocytosis can be minimized by “worm” like shape of NPs such as GNTs [36]. More data can be collected with PA technique on drainage dynamics of functionalized NPs, such as GNTs, with different sizes and shapes by real-time counting of NPs before, within, and after transit in SLNs. If this is successful, metastasis in SLNs can be potentially identified by the prolonged retention of optimized NPs in SLNs, whereas in SLNs without metastasis, the NPs clear quickly. Identification of micrometastasis can be based also on synergistic enhancement of PA signals from NPs within the metastatic lesions due to a high local concentration of NPs in targeted tumor cells, and, especially NP clustering around dense or clustered surface cancer markers [15, 37, 38] compared to random non-specific distribution of NPs across SLNs. Indeed, we have already demonstrated that (1) clustered gold NPs or melanin aggregates enhances both the PA and PT signals from 5 to 100 times depending on cluster sizes [20, 28, 37] and (2) laser-induced nanobubble generation around overheated NPs is an effective amplifier of PA signals [19,28]. The developed high resolution optical imaging with optical clearance with its ability to differentiate main SLN microstructure (Figure 3) should be important for verification of metastasis and NP location in SLNs by precise guidance of diagnostic laser beams at least in ex vivo experiments.
Currently, there are some uncertainties with regard to the clinical significance of low level of metastatic cell detection due to the limitation of currently available diagnostic modalities [1–3]. The highly sensitive PA technology can adequately address this and also clarify how SLN micrometastasis and even small dormant clusters of metastatic cells are related to tumor progression in their natural environment. PA technique could also further define the correlation between the presence of lymphatic DTCs and SLN status. In addition, simultaneous PA counting of tumor cells in the lymph [16] and blood [28] system could reveal the main pathways for tumor spread including its entrance into blood vessels from SLNs and vice versa. Therefore, it remains to be determined if circulating tumor cells (CTCs) enter into blood vessels during SLN metastasis progression. The results from this study suggest that PA technology is an ideal tool to answer this problem because it permits molecular detection/counting CTCs in vivo with potential sensitivity in humans of one CTC in 100 billion of RBCs [28].
In the future, PA/PT technology can be extended by its integration with other promising and established methods, for example, MRI using MNPs as multimodal (PA-PT-MRI) contrast agents or QD-based lymphography [4, 7]. Since we have demonstrated QDs’ utility as PA/PT contrast agents [19], QDs could serve as triple lymphographic tracers for advanced fluorescent imaging, highly sensitive and deeply penetrating PA cytometry, and PT elimination of metastatic cells, if the concern over potential QD toxicity is resolved. The integrated PA/PT diagnostic-therapeutic platform needs to be compared with other recently developed approaches, for example, SLN purging using adoptive transfer of normal T cells with oncolytic virus that kills metastatic cells [39]. We have already demonstrated that viruses with covalently incorporated gold NPs have potential to be used for integrated PT-gene cancer therapy [37, 40]. Thus, a combination of both technologies is quite feasible.
The label-free nature of PA/PT technique using melanin as an intrinsic cell marker offers avoidance of potential problems related to labeling of tumor cells in vivo. This may provide the precedent for non-invasive, in vivo staging and purging of SLNs in melanoma, which is a highly aggressive epidemic malignancy and is often widely metastatic at an early stage. Approximately 18% and potentially more of melanoma cells with low melanin expression can be missed with label-free PA techniques [28]. Nevertheless, this is less than or comparable to conventional assays, which can miss up to 30–70% of tumor cells due to the limited expression of cancer biomarkers [1–3]. Further study could determine whether label-free PT therapy of melanoma metastasis is effective enough to be used alone or if it should be used in conjunction with chemo and radiation therapy. Further improvement could be achieved by targeting of melanoma with strongly absorbing NPs as we demonstrated for breast tumor cells.
Taking into account the successful clinical applications of PA techniques with target (blood or tumor) depth up to 3 cm (maximal depth for breast SLNs) [14, 41, 42] using the safe range of laser fluence [43], non-toxic (e.g., melanoma) or low toxic (e.g., gold NPs) contrast agents [20], and sterile disposable fibers (at least for interstitial therapy of SLNs), we anticipate PA/PT technologies can be rapidly translated to the bedside through the use of a portable multicolor device with flexible multiple-strand fibers and miniature focused ultrasound transducers (SD#4). For diagnostic purpose we plan to use a high pulse repetition rate (10–50 kHz) diode laser array as demonstrated recently for detection of circulating melanoma cells in blood [28] and partly in this study. We project that in clinical applications a high resolution PA imaging for mapping SLNs is useful but not absolutely necessary. Instead, rapid (minute scale) identification of lymph vessel and SLN and margins with reasonable resolution can be achieved with simpler robust multi-fiber schematics. Moreover, these schematics with multicolor NPs [16] injected in different sites can provide assessment of several lymph vessels that drain into shared SLNs, allowing differentiating nonmetastatic lymph nodes from metastatic ones and noninvasively treating or resecting the metastatic ones. The expected clinical benefits include rapid, ultra-sensitive, and noninvasive SLN assessment integrated with in vivo high-targeted localized PT therapy. This may preserve SLNs as an immunological barrier against cancer cells and allow avoiding surgical complications (e.g., bleeding, lymphedema, nerve damage, and abnormal scarring). In addition, the PA technique might rapidly assess the therapeutic efficacy through in vivo counting of DTCs and micrometastasis.
Supplementary Material
Acknowledgments
This work was supported in part by the National Institute of Health grants R01 EB000873, R01 CA131164, R01 EB009230, R21 CA139373, the National Science Foundation grant DBI 0852737 (VPZ) and the Arkansas Biosciences Institute (JWK and VPZ). The authors thank to H.-M. Moon for his assistance with TEM imaging and sample preparations for this study.
Footnotes
Supporting Information for this article is available free of charge under http:/dx.doi.org/
References
- 1.Van Trappen PO, Pepper MS. Lancet Oncol. 2002;3:44–52. doi: 10.1016/s1470-2045(01)00621-0. [DOI] [PubMed] [Google Scholar]
- 2.Christofori G. Nature. 2006;441:444–450. doi: 10.1038/nature04872. [DOI] [PubMed] [Google Scholar]
- 3.Leong SP, Cady B, Jablons DM, Garcia-Aguilar J, Reintgen D, Jakub J, Pendas S, Duhaime L, Cassell R, Gardner M, Giuliano R, Archie V, Calvin D, Mensha L, Shivers S, Cox C, Werner JA, Kitagawa Y, Kitajima M. Cancer Metastasis Rev. 2006;25:221–232. doi: 10.1007/s10555-006-8502-8. [DOI] [PubMed] [Google Scholar]
- 4.Kobayashi H, Hama Y, Koyama Y, Barrett T, Regino CA, Urano Y, Choyke PL. Nano Lett. 2007;7:1711–1716. doi: 10.1021/nl0707003. [DOI] [PubMed] [Google Scholar]
- 5.Barrett T, Choyke PL, Kobayashi H. Contrast Media Mol Imaging. 2006;1:230–245. doi: 10.1002/cmmi.116. [DOI] [PubMed] [Google Scholar]
- 6.Ogata F, Azuma R, Kikuchi M, Koshima I, Morimoto Y. Ann Plast Surg. 2007;58:652–655. doi: 10.1097/01.sap.0000250896.42800.a2. [DOI] [PubMed] [Google Scholar]
- 7.Kim S, Lim YT, Soltesz EG, et al. Nat Biotechnol. 2004;22:93–97. doi: 10.1038/nbt920. [DOI] [PMC free article] [PubMed] [Google Scholar]
- 8.Guimaraes R, Clément O, Bittoun J, Carnot F, Frija G. AJR Am J Roentgenol. 1994;162:201–207. doi: 10.2214/ajr.162.1.8273666. [DOI] [PubMed] [Google Scholar]
- 9.Kobayashi H, Ogawa M, Kosaka N, Choyke PL, Urano Y. Nanomed. 2009;4:411–419. doi: 10.2217/nnm.09.15. [DOI] [PMC free article] [PubMed] [Google Scholar]
- 10.Makale M, McElroy M, O’Brien P, Hoffman RM, Guo S, Bouvet M, Barnes L, Ingulli E, Cheresh D. J Biomed Opt. 2009;14:024032. doi: 10.1117/1.3103783. [DOI] [PMC free article] [PubMed] [Google Scholar]
- 11.Wessels JT, Busse AC, Mahrt J, Dullin C, Grabbe E, Mueller GA. Cytometry A. 2007;71:542–549. doi: 10.1002/cyto.a.20419. [DOI] [PubMed] [Google Scholar]
- 12.Fujiki Y, Tao K, Bianchi DW, Giel-Moloney M, Leiter AB, Johnson KL. Cytometry A. 2008;73:111–118. doi: 10.1002/cyto.a.20533. [DOI] [PMC free article] [PubMed] [Google Scholar]
- 13.Zhang HF, Maslov K, Stoica G, Wang LV. Nat Biotechnol. 2006;24:848–851. doi: 10.1038/nbt1220. [DOI] [PubMed] [Google Scholar]
- 14.Xu M, Wang LV. Rev Sci Instrum. 2006;77:041101. [Google Scholar]
- 15.Zharov VP, Galanzha EI, Shashkov EV, Kim JW, Khlebtsov NG, Tuchin VV. J Biomed Opt. 2007;12:051503. doi: 10.1117/1.2793746. [DOI] [PubMed] [Google Scholar]
- 16.Galanzha EI, Shashkov EV, Tuchin VV, Zharov VP. Cytometry A. 2008;73:884–894. doi: 10.1002/cyto.a.20587. [DOI] [PMC free article] [PubMed] [Google Scholar]
- 17.Eghtedari M, Oraevsky A, Copland JA, Kotov NA, Conjusteau A, Motamedi M. Nano Lett. 2007;7:1914–1918. doi: 10.1021/nl070557d. [DOI] [PubMed] [Google Scholar]
- 18.De la Zerda A, Zavaleta C, Keren S, Vaithilingam S, Bodapati S, Liu Z, Levi J, Smith BR, Ma TJ, Oralkan O, Cheng Z, Chen X, Dai H, Khuri-Yakub BT, Gambhir SS. Nat Nanotechnol. 2008;3:557–562. doi: 10.1038/nnano.2008.231. [DOI] [PMC free article] [PubMed] [Google Scholar]
- 19.Shashkov EV, Everts M, Galanzha EI, Zharov VP. Nano Lett. 2008;8:3953–3958. doi: 10.1021/nl802442x. [DOI] [PMC free article] [PubMed] [Google Scholar]
- 20.Kim J-W, Galanzha EI, Shashkov EV, Moon H-M, Zharov VP. Nat Nanotechnol. 2009;4 doi: 10.1038/nnano.2009.231. (in press) [DOI] [PMC free article] [PubMed] [Google Scholar]
- 21.Zharov VP, Galanzha EI, Tuchin VV. Opt Lett. 2005;30:628–630. doi: 10.1364/ol.30.000628. [DOI] [PubMed] [Google Scholar]
- 22.Zharov V, Galanzha E, Shashkov E, Khlebtsov N, Tuchin V. Opt Lett. 2006;31:3623–3625. doi: 10.1364/ol.31.003623. [DOI] [PubMed] [Google Scholar]
- 23.Zharov V, Galanzha E, Shashkov E, Maksimova I, Khlebtsov B, Khlebsov N, Terentuk G, Akchurin G, Tuchin V. Lasers Surg Med. 2007;19(Suppl):47. [Google Scholar]
- 24.Song KH, Stein EW, Margenthaler JA, Wang LV. J Biomed Opt. 2008;13:054033. doi: 10.1117/1.2976427. [DOI] [PMC free article] [PubMed] [Google Scholar]
- 25.Song KH, Kim C, Cobley CM, Xia Y, Wang LV. Nano Lett. 2009;9:183–188. doi: 10.1021/nl802746w. [DOI] [PMC free article] [PubMed] [Google Scholar]
- 26.Song KH, Kim C, Maslov K, Wang LV. Eur J Radiol. 2009;70:227–231. doi: 10.1016/j.ejrad.2009.01.045. [DOI] [PMC free article] [PubMed] [Google Scholar]
- 27.Zharov VP, Galanzha EI, Tuchin VV. J Cell Biochem. 2006;97:916–932. doi: 10.1002/jcb.20766. [DOI] [PubMed] [Google Scholar]
- 28.Galanzha EI, Shashkov EV, Spring P, Suen JY, Zharov VP. Cancer Res. 2009 doi: 10.1158/0008-5472.CAN-08-4900. (in press) [DOI] [PMC free article] [PubMed] [Google Scholar]
- 29.Schipper ML, Nakayama-Ratchford N, Davis CR, Kam NW, Chu P, Liu Z, Sun X, Dai H, Gambhir SS. Nat Nanotechnol. 2008;3:216–221. doi: 10.1038/nnano.2008.68. [DOI] [PubMed] [Google Scholar]
- 30.Tuchin V. J Phys D Appl Phys. 2005;38:2497–2518. [Google Scholar]
- 31.Sage HH, Sinha BK, Kizilay D, Toulon R. J Nucl Med. 1964;5:626–642. [PubMed] [Google Scholar]
- 32.Nopajaroonsri C, Simon GT. Am J Pathol. 1971;65:25–42. [PMC free article] [PubMed] [Google Scholar]
- 33.Jemal A, Siegel R, Ward E, Murray T, Xu J, Thun MJ. CA Cancer J Clin. 2007;57:43–66. doi: 10.3322/canjclin.57.1.43. [DOI] [PubMed] [Google Scholar]
- 34.Karim RZ, Scolyer RA, Li W, Yee VS, McKinnon JG, Li LX, Uren RF, Lam S, Beavis A, Dawson M, Doble P, Hoon DS, Thompson JF. Ann Surg. 2008;247:1003–1010. doi: 10.1097/SLA.0b013e3181724f5e. [DOI] [PubMed] [Google Scholar]
- 35.Sega EI, Low PS. Cancer Metastasis Rev. 2008;27:655–664. doi: 10.1007/s10555-008-9155-6. [DOI] [PubMed] [Google Scholar]
- 36.Champion JA, Mitragotri S. Pharm Res. 2009;26:244–249. doi: 10.1007/s11095-008-9626-z. [DOI] [PMC free article] [PubMed] [Google Scholar]
- 37.Sain V, Zharov VP, Brazel CS, Nikles DE, Johnson DT, Everts M. J Nanomedicine. 2006;2:200–206. doi: 10.1016/j.nano.2006.07.002. [DOI] [PubMed] [Google Scholar]
- 38.Ross JS, Linette GP, Stec J, Clark E, Ayers M, Leschly N, Symmans WF, Hortobagyi GN, Pusztai L. Expert Rev Mol Diagn. 2003;3:573–585. doi: 10.1586/14737159.3.5.573. [DOI] [PubMed] [Google Scholar]
- 39.Qiao J, Kottke T, Willmon C, Galivo F, Wongthida P, Diaz RM, Thompson J, Ryno P, Barber GN, Chester J, Selby P, Harrington K, Melcher A, Vile RG. Nat Med. 2008;14:37–44. doi: 10.1038/nm1681. [DOI] [PubMed] [Google Scholar]
- 40.Everts M, Saini V, Leddon JL, Kok RJ, Stoff-Khalili M, Preuss MA, Millican CL, Perkins G, Brown JM, Bagaria H, Nikles DE, Johnson DT, Zharov VP, Curiel DT. Nano Lett. 2006;6:587–591. doi: 10.1021/nl0500555. [DOI] [PubMed] [Google Scholar]
- 41.Petrov YY, Petrova IY, Patrikeev IA, Esenaliev RO, Prough DS. Opt Lett. 2006;31:1827–1829. doi: 10.1364/ol.31.001827. [DOI] [PubMed] [Google Scholar]
- 42.Ermilov SA, Khamapirad T, Conjusteau A, Leonard MH, Lacewell R, Mehta K, Miller T, Oraevsky AA. J Biomed Opt. 2009;14:024007. doi: 10.1117/1.3086616. [DOI] [PubMed] [Google Scholar]
- 43.American National Standard for Safe Use of Lasers. ANSI Z136.1. 2000. [Google Scholar]
- 44.Willard-Mack CL. Toxicol Pathol. 2006;34:409–424. doi: 10.1080/01926230600867727. [DOI] [PubMed] [Google Scholar]
Associated Data
This section collects any data citations, data availability statements, or supplementary materials included in this article.


