

Abstract
Background Human epidemiological studies suggest that small size at birth and food deprivation during gestation confer an excess risk of coronary heart diseases (CHD) in adulthood, frequently in a sex-specific manner. Prior epigenetic studies indicate that such prenatal conditions are marked by persistent and sometimes sex-specific changes in DNA methylation. Here, we have investigated the association between DNA methylation and myocardial infarction (MI) at six loci sensitive to prenatal nutrition, anticipating potential sex-specificity.
Method Within the placebo group of the PROSPER trial on pravastatin and the risk of CHD, we compared all individuals who were event free at baseline and developed MI during 3 years' follow-up (n = 122) with a similar-sized control group. Methylation at IL10, LEP, ABCA1, IGF2, INS and GNASAS was measured in DNA extracted from leucocytes using mass spectrometry.
Results DNA methylation at GNASAS was modestly higher in MI cases compared with controls (P = 0.030). A significant sex interaction was observed for INS (P = 0.014) and GNASAS (P = 0.031). Higher DNA methylation at these loci was associated with MI among women (INS: +2.5%, P = 0.002; GNASAS: +4.2%, P = 0.001). Hypermethylation at one locus and at both loci was associated with odds ratios (ORs) of 2.8 and 8.6, respectively (Ptrend = 3.0 × 10⁻⁴). No association was observed among men.
Conclusions The risk of MI in women is associated with DNA methylation marks at specific loci previously shown to be sensitive to prenatal conditions. This observation may reflect a developmental component of MI.
Keywords: Epigenetic risk factors, coronary heart disease, epigenetic biomarkers, prenatal adversity, epigenetic epidemiology
Introduction
The developmental origins of health and disease hypothesis poses that conditions during early development influence the risk for developing coronary heart diseases (CHD) and other chronic diseases in later life.1,2 In human studies, this hypothesis is being investigated using various proxies for developmental adversity. Small size at birth, for example, is linked to a consistent albeit modest increase in risk of type 2 diabetes mellitus3 and CHD4 in later life. Prenatal exposure to the Dutch Famine at the end of World War II is associated with an adverse CHD risk profile in adulthood in individuals who had a normal size at birth.5,6 These proxies, however, generally lack specificity. Small size at birth can be caused by many factors and cannot distinguish between specific prenatal conditions and their timing. Studies of historical famines can be relatively precise for the type and the timing of prenatal conditions but provide limited information for exposures at the individual level. Moreover, data on these proxies are rarely available in epidemiological studies of CHD. The molecular modifications underlying epigenetic regulation are an alternative resource for markers of the prenatal environment that could meet these limitations.
Epigenetic mechanisms maintain heritable variation in gene expression potential that is not caused by variation in the DNA sequence.7 The molecular basis includes the methylation of cytosines in CpG dinucleotides, which together with histone modifications, and non-coding RNAs, influences the accessibility of DNA to the transcriptional machinery.8 DNA methylation is recognized as the most stable epigenetic mark9 and can be measured on DNA samples that are commonly available in biobanks.10
Although generally stable, the prenatal environment can induce persistent changes in DNA methylation. Crucially, these changes can be specific to the type of exposure, its timing during gestation and the sex of the exposed individual. In sheep, maternal methyl-donor deficiency from preconception to preimplantation resulted in sex-specific DNA methylation changes throughout the genome in the adult offspring.11 In rats, prenatal dietary protein restriction12 and prenatal caloric restriction13 had opposite effects on DNA methylation at the same candidate loci, illustrating that methylation marks at specific loci can be meta-stable and that the direction of epigenetic changes may be exposure-specific.14 Similar mechanisms apply to humans. We reported timing and sex-specific changes in DNA methylation at candidate loci 60 years after exposure to the Dutch Famine.15,16 The relevance of sex-specific effects is highlighted by the observation that the association of prenatal famine exposure with an adverse cardiovascular risk profile is predominantly present among women.5,17 In addition, periconceptional exposure to famine was associated with lower DNA methylation at the IGF2 locus whereas periconceptional folic acid supplementation was associated with higher DNA methylation at this locus.18 Other prenatal conditions that have been associated with changes in DNA methylation in humans include intrauterine growth restriction19 and maternal tobacco smoking during pregnancy.20 In line with these data, it has been proposed that the developmental origins of CHD may eventually be investigated with epigenetic signatures that are specific for both timing and type of adverse prenatal conditions.21,22
In this study, we investigated the association of DNA methylation with myocardial infarction (MI) during a 3.2-year follow-up period. To this end, DNA methylation was measured at six loci implicated in metabolic disease and CVD, namely IL10, LEP, ABCA1, IGF2, INS (alternate symbol INSIGF) and GNASAS (alternate symbol NESPAS). These methylation marks cover the genomic region that contains features with a potential for epigenetic regulation as observed in human, animal or cell culture experiments23–28 (Table 1). DNA methylation at these loci was previously found to mark prenatal environmental conditions.15,16,18 Analyses took into account potential sex-specificity since prenatal adversity was reported to be sex-specifically associated with changes in DNA methylation16 and with prevalence of metabolic risk factors for CHD.5,17,29
Table 1.
Epigenetic properties of the six methylation assays and their associated candidate loci
| Prenatal famine 15,16 |
|||||||
|---|---|---|---|---|---|---|---|
| Locus (alias) | Perib | Latec | Sex-specific | mTFBSa | Epigenetic feature10 | Control of gene | Gene function |
| IL10 | ↑ | = | N | Confirmed | Proximal promoter | IL1022 | Anti-inflammation |
| LEP | ↑d | ↑d | Y (♂) | Confirmed | Proximal promoter | LEPTIN23 | Metabolism |
| ABCA1 | ↑ | NT | N | Confirmed | Promoter CpG island shore | ABCA124 | Cholesterol transport |
| IGF2DMR | ↓ | = | N | Putative | Imprinted DMR | IGF225 | Growth and development |
| INS (INSIGF) | ↓d | = | Y (♂) | Putative | Proximal promoter | INSULIN26/INS-IGF36 | Glucose metabolism/Fetal growth |
| GNASAS (NESPAS) | ↑d | ↓ | Y (♀) | Confirmed | Imprinting control DMR | Gs, Alpha Subunit27 | cAMP-dependent pathway |
aMethylation-sensitive transcription factor-binding site.
bExposure to famine in the period around conception.
cExposure to famine in late gestational period (last trimester).
dThe association between DNA methylation and prenatal famine was sex-specific.
NT: The association between DNA methylation and famine was not tested.
Materials and Methods
Study population
This study was based in the ongoing PROspective Study of Pravastatin in the Elderly at Risk (PROSPER) trial. Details of the design of the PROSPER study were described previously.30,31 Briefly: PROSPER is a prospective multicentre randomized placebo-controlled clinical trial to assess if treatment with pravastatin could reduce risk of major vascular events in the elderly. Between December 1997 and May 1999, subjects were screened and enrolled in Glasgow (Scotland), Cork (Ireland) and Leiden (The Netherlands). For the PROSPER study men and women aged 70–82 years were recruited if they had pre-existing vascular disease or were at a moderately increased risk due to smoking, hypertension or diabetes. A total number of 5804 subjects were randomly assigned to either pravastatin (n = 2891) or placebo (n = 2913) treatment. Mean follow-up period was 3.2 years after randomized assignment to pravastatin or placebo treatment. All endpoints of the study were adjudicated by a study endpoint committee. In the current study, MI includes the definitions of definite fatal and nonfatal myocardial infarction as devised for the PROSPER trial.30 Further details on the measurement and definition of baseline characteristics are described elsewhere.30,31 DNA was extracted from blood drawn before the placebo run-in medication was issued. Samples were centrifuged after lysis of erythrocytes, the supernatant was removed and DNA was extracted from the pellet, consisting of the leucocytes, using the salting-out method.
Eligible individuals for this study were allocated to placebo treatment to exclude an influence of pravastatin treatment and were free of CHD events at baseline (n = 1654). The remaining risk factors for which the study population was selected (smoking, hypertension or diabetes) are common at older age and the individuals can be expected to be largely representative of their age group. A further inclusion criterion for this study was availability of sufficient DNA (n = 1375). Controls were selected from those alive at the end of the follow-up period who did not develop CHD, stroke or cancer (n = 1248); cases suffered an MI during the follow-up period (n = 122). The study focused on a single endpoint to reduce heterogeneity. A case–control study was designed to compare all eligible cases with a representative control group of similar size. Assuming that the differences in DNA methylation between cases and controls are similar to those we previously observed between individuals prenatally exposed to famine15,16 or periconceptional folic acid18 [mean difference expressed in standard deviations (SD) = 0.35], the estimated power of our study is 0.78 (122 cases, 122 controls; α = 0.05; two-sample t-test). Because this would leave space for four additional samples on the PCR plates, 126 individuals were included in the control group. To select the controls, we used block-random selection in order to obtain a similar sex distribution in the controls as in the cases (females 48.4%). From the group of eligible controls (females 60.9%), 302 females were randomly removed. Next, from the remaining group (n = 946), 126 individuals (females 49.2%) were randomly selected to be the control group, which was similar in baseline characteristics to the whole group of eligible controls.
The institutional ethics review boards of all study centres approved the protocol, and all participants gave written informed consent. The protocol was consistent with the Declaration of Helsinki.
DNA methylation
DNA methylation was measured using a mass spectrometry-based method (Epityper version 1.05, Sequenom, San Diego, CA, USA). Previous studies showed the quantitative accuracy (R2 duplicate measurements ≥0.98) and high concordance with clonal PCR bisulphite sequencing.15,32,33 The design, features and measurement details of the assays to measure DNA methylation at IL10, LEP, ABCA1, IGF2, INS (INSIGF) and GNASAS (NESPAS) were described previously.10 Briefly: bisulphite conversion of 0.5 μg of genomic DNA using the EZ 96-DNA methylation kit (Zymo Research, Orange, CA, USA) was followed by PCR amplification, fragmentation after reverse transcription and analysis on a mass spectrometer. Fragments that contain one or more CpG sites are called CpG units, methylation of which is assessed in a single measurement for all CpG sites on the fragment. Cases and controls were randomly divided over bisulphite conversion (3 × 96-well plates) and PCR amplification batches (2 × 384-well plates). For each individual, the six assays were amplified from the same bisulphite-treated DNA. All methylation measurements were done in triplicate from the same bisulphite-treated DNA.
The six assays contained a total of 59 CpG units, over which 96 CpG sites were distributed. After applying a stringent quality control procedure,10 32 CpG units, containing 49 CpG sites remained (Supplementary Table S1B). In total 23 CpG units (41 CpG sites) were removed since their fragment's mass overlapped, was outside the detection range, or was potentially confounded by single nucleotide polymorphisms due to known (dbSNP build 28) or unknown genetic variation (R-module MassArray 34), and 4 CpG units (6 CpG sites) were removed since they had success of less than two of the three replicate measurements, SD > 10% for the replicates and success rate <75% after quality controls. The average call rate for the 32 CpG units was 94%.
Statistical analysis
The differences in baseline characteristics between the case and control groups were assessed with a chi-square test for the qualitative variables, and an independent t-test for the quantitative variables. For HDL-cholesterol, triglycerides, glucose and CRP, significance of the difference was assessed after natural logarithmic transformation.
We estimated the mean DNA methylation at the six loci and the standard error of the mean (SE) for cases and controls as previously described.10,16 A linear mixed model was used to test for differences in methylation of the loci between cases and controls.10,16,35 It uses all available methylation data per locus, i.e. methylation of multiple CpG units per locus, accounts for the correlation between methylation of CpG units within a locus, and using this correlation handles data missing at random. It further enables the inclusion of relevant adjustments on the raw data within the same model. The linear mixed model may be seen as an extension of a t-test, resulting in identical results when between-group methylation differences are assessed for a single CpG unit (instead of all CpG units within a locus) and covariates are omitted. In the linear mixed model DNA methylation was entered as dependent variable. Individual was entered as a random effect. Incidence of MI, age, sex (when applicable), country of origin, PCR- and bisulphite batch and CpG unit were entered as fixed effects. The difference between case and control groups at a locus was expressed as percentage DNA methylation and as the proportion of the SD of the adjusted mean methylation in the control group (estimated from the SE), i.e. the standardized difference (SD-unit).
To test for sex-specificity of the association between DNA methylation and MI the interaction term MI*sex was entered as a fixed effect to the model. This was done in view of the previously observed sex-specificity of the association between prenatal exposure to famine and both DNA methylation at LEP, INS and GNASAS16 (Table 1) and cardiovascular risk factors.5,17 For loci showing a significant interaction between sex and MI, the study population was reanalysed for men and women separately. Traditional CHD risk factors, that showed a difference (P < 0.05) between cases and controls were added to the model as fixed effects, separately and simultaneously to obtain adjusted DNA methylation differences between cases and controls.
Logistic regression was used to calculate odds ratios (OR) for hypo- (i.e. lower than the median) or hypermethylation (i.e. higher than the median) at a locus and incidence of MI. The median, being independent of the distribution of variation in DNA methylation, was chosen as cut-off to compare the analyses across the loci. To categorize DNA methylation at a locus as hypo- or hypermethylated, the mean methylation at a locus was calculated by averaging the methylation of the CpG units measured across the locus after imputing missing data. Imputation was performed using the linear mixed model, which exploits the correlation between methylation of neighbouring CpG sites to achieve accurate imputation.15 In the regression model, incidence of MI status was the dependent variable, and methylation status, age, sex (when applicable), country of origin, PCR- and bisulphite batch, and traditional risk factor (when applicable) were entered as independent variables. OR for hypo- and hypermethylation were calculated with methylation of a locus entered as categorical covariate (hypomethylation was the reference category). Loci were tested individually and combined; interaction between loci was tested by entering an interaction term locus1*locus2 as covariate. Statistical significance for combined effects was assessed using a test for trend. All P-values reported are two-sided. All analyses were performed using SPSS 16.0 (SPSS Inc., Chicago, IL, USA).
Results
Our study was based in the PROSPER trial.30 Eligible individuals for the current epigenetic study were selected from the placebo group and were free of CHD events at baseline (n = 1654). Individuals who developed MI during follow-up (n = 122) had a higher BMI, lower HDL-cholesterol, higher triglycerides and higher CRP than a randomly selected control group (n = 126; Table 2). Of note, the association of many CHD risk factors had a different distribution between the two sexes in this study population. Metabolic risk factors such as BMI, triglyceride levels and fasting blood glucose were only associated with MI in women, whereas CRP levels and hypertension were only associated with MI in men (Table 2).
Table 2.
Baseline characteristics of the case and control groups
| Selected individuals |
Females |
Males |
|||||||
|---|---|---|---|---|---|---|---|---|---|
| Characteristica | Controls(n = 126) | Cases(n = 122) | P-value | Controls(n = 62) | Cases(n = 57) | P-value | Controls(n = 64) | Cases(n = 65) | P-value |
| Current smoker (%) | 48 (38) | 43 (35) | 0.642 | 18 (29) | 15 (26) | 0.741 | 30 (47) | 28 (43) | 0.665 |
| Diabetes (%) | 12 (10) | 17 (14) | 0.280 | 4 (7) | 9 (16) | 0.103 | 8 (12) | 8 (12) | 0.974 |
| Hypertension (%) | 86 (68) | 96 (79) | 0.063 | 51 (82) | 46 (81) | 0.827 | 35 (55) | 50 (77) | 0.008 |
| Age years | 74.8 ± 3.1 | 75.4 ± 3.6 | 0.209 | 75.1 ± 3.2 | 75.4 ± 3.5 | 0.654 | 74.6 ± 2.9 | 75.3 ± 3.7 | 0.184 |
| BMI kg/m2 | 26.3 ± 4.4 | 28.9 ± 4.2 | 0.004 | 26.4 ± 4.7 | 28.5 ± 4.6 | 0.016 | 26.3 ± 4.1 | 27.4 ± 3.8 | 0.102 |
| Total cholesterol mmol/l | 5.7 ± 0.97 | 5.5 ± 0.89 | 0.116 | 6.2 ± 0.94 | 5.8 ± 0.96 | 0.034 | 5.3 ± 0.78 | 5.3 ± 0.74 | 0.887 |
| LDL-chol mmol/l | 3.8 ± 0.89 | 3.7 ± 0.78 | 0.173 | 4.1 ± 0.92 | 3.8 ± 0.85 | 0.052 | 3.5 ± 0.74 | 3.5 ± 0.69 | 0.764 |
| HDL-cholb mmol/l | 1.3 (1.10–1.55) | 1.2 (0.97–1.41) | 0.003 | 1.4 (117– 168) | 1.3 (1.06– 1.50) | 0.016 | 1.2 (1.01– 1.41) | 1.1 (0.92–1.25) | 0.066 |
| Triglycerideb mmol/l | 1.3 (1.05–1.74) | 1.5 (110– 206) | 0.038 | 1.4 (1.13–1.86) | 1.6 (1.34–2.19) | 0.048 | 1.3 (0.98–1.69) | 1.4 (1.00–2.00) | 0.237 |
| Glucoseb mmol/l | 4.9 (460– 5.33) | 5.1 (4.70–5.90) | 0.039 | 4.7 (450– 5.30) | 5.2 (4.60–5.95) | 0.031 | 5.0 (4.60– 5.48) | 5.0 (4.70– 5.75) | 0.511 |
| CRPb mg/l | 2.9 (1.48–6.01) | 4.5 (182– 754) | 0.024 | 3.1 (1.49–6.10) | 4.7 (1.50–8.16) | 0.519 | 2.7 (1.33–5.77) | 4.4 (2.00–7.27) | 0.013 |
aQualitative characteristics are given as their count (%), quantitative characteristics as mean ± SD.
bThese quantitative variables are given as median (interquartile range), due to their skewed distribution.
DNA methylation at IL10, LEP, ABCA1, IGF2, INS and GNASAS was measured using a mass spectrometry-based method.33 Linear mixed models were used to test for differences in methylation of the loci between cases and controls.10,16,35 DNA methylation was modestly higher in MI cases at GNASAS [+1.8% (=0.26 SD-units), P = 0.030; Table 3] compared with the control group. No differences in DNA methylation were observed at the other loci. Sex-specificity of the associations was tested. An interaction between sex and MI was observed for INS (Pinteraction = 0.014) and GNASAS (Pinteraction = 0.031) (Table 3). Women and men were subsequently analysed separately for these loci.
Table 3.
DNA methylation differences and incidence of MI
| Mean methylationa (SE) |
Cases–controls (SE) |
|||||
|---|---|---|---|---|---|---|
| Locus | Controls | Cases | Percentage of methylationb | Standardizedc | P-value§ | Psex interaction |
| IL10 | 27.6 (0.79) | 29.2 (0.88) | +1.6 (1.11) | +0.18 (0.12) | 0.148 | 0.232 |
| LEP | 29.2 (0.54) | 29.7 (0.60) | +0.4 (0.75) | +0.07 (0.12) | 0.558 | 0.435 |
| ABCA1 | 14.8 (0.35) | 15.0 (0.38) | +0.2 (0.47) | +0.04 (0.12) | 0.752 | 0.093 |
| IGF2 | 52.0 (0.52) | 53.2 (0.58) | +1.2 (0.73) | +0.21 (0.13) | 0.089 | 0.087 |
| INSIGF | 75.7 (0.42) | 76.8 (0.46) | +1.1 (0.58) | +0.23 (0.12) | 0.063 | 0.014 |
| GNASAS | 49.0 (0.60) | 50.9 (0.67) | +1.8 (0.84) | +0.27 (0.12) | 0.030 | 0.031 |
aAverage DNA methylation at the locus, adjusted for batch effects, country, age at baseline and sex.
bThe difference is expressed in percentage DNA methylation.
cThe standardized difference is expressed as a proportion of the standard deviation in the control group.
§Two-sided P-value for the difference, adjusted for batch effects, country, age at baseline and sex.
In women, DNA methylation at INS was higher in MI cases compared with controls [+2.5% (=0.59 SD-units), P = 0.002] (Table 4), which was independent of traditional risk factors [+2.6% (=0.62 SD-units), P = 0.002]. This difference was similar for all four CpG units at the locus, when expressed in SD-units (Figure 1B). DNA methylation at GNASAS was also higher in female cases compared with controls [+4.2% (=0.61 SD-units), P = 0.001], and was also independent of traditional risk factors [+3.5% (=0.51 SD-units), P = 0.009]. This difference was similar for all 10 CpG units at this locus (Figure 1). In men, no differences in DNA methylation were observed between cases and controls.
Table 4.
DNA methylation differences and incidence of MI, per sex
| Mean methylationa (SE) |
Cases–controls (SE) |
|||||
|---|---|---|---|---|---|---|
| Locus | Sex | Controls | Cases | Percentage of methylationb | Standardizedc | P-value§ |
| INSIGF | ♂ | 76.0 (0.64) | 75.7 (0.68) | −0.4 (0.87) | −0.07 (0.17) | 0.659 |
| ♀ | 75.5 (0.53) | 77.9 (0.60) | +2.5 (0.76) | +0.59 (0.18) | 0.002 | |
| GNASAS | ♂ | 49.3 (0.83) | 49.6 (0.89) | +0.2 (1.12) | +0.03 (0.17) | 0.850 |
| ♀ | 48.4 (0.89) | 52.6 (1.01) | +4.2 (1.28) | +0.60 (0.18) | 0.001 | |
aAverage DNA methylation at the locus, adjusted for batch effects, country and age at baseline.
bThe difference is expressed in percentage DNA methylation.
cThe standardized difference is expressed as a proportion of the SD in the control group.
§Two-sided P-value for the difference, adjusted for batch effects, country and age at baseline.
Figure 1.
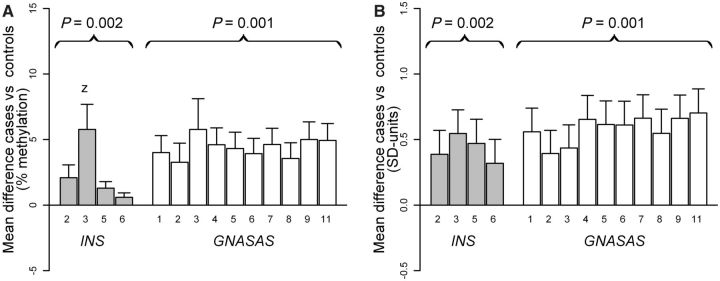
DNA methylation difference between the female case and control groups (y-axis) at each CpG unit (x-axis) of the loci INS (grey bars) and GNASAS (open bars). Differences were nominally significant for all CpG units when tested individually (P < 0.05), except for CpG 6 of INS. (A) Difference in percentage DNA methylation. (B) Difference in SD-units, a proportion of the standard deviation (SD) from the adjusted mean methylation in the control group. Bars represent the average difference, the whiskers represent the SE of the difference. Numbers under each bar are the CpG units, numbered from the forward primer onward. A positive difference indicates that the case group had a higher average DNA methylation, values are adjusted for bisulphite- and PCR batches, country and age at baseline
We assessed the association between hypermethylation at INS and at GNASAS with the risk of MI (Table 5). No interaction between the two loci was observed. Therefore, three categories were analysed: hypomethylation at both loci (reference), hypermethylation at either INS or GNASAS and hypermethylation at both loci. In the whole study population, hypermethylation at one locus and at both loci was associated with OR of 1.7 [95% confidence interval (95% CI): 0.9–3.3] and 2.8 (95% CI: 1.4–5.9), respectively (Ptrend = 0.006). This association could be solely attributed to women among whom single and double hypermethylation were associated with OR of 2.8 (95% CI: 1.0–7.8) and 8.6 (95% CI: 2.7–27.9), respectively (Ptrend = 3.1 × 10⁻⁴). Adjustment for traditional risk factors did not appreciably alter these associations (ORsingle = 3.1 (95% CI: 1.0–9.7); ORdouble = 11.1 (95% CI: 2.9–43.4), Ptrend = 5.2 × 10⁻⁴). In men, no association was observed.
Table 5.
Hypermethylation at INSIGF and GNASAS and risk of MI
| Whole group |
♂ |
♀ |
||||
|---|---|---|---|---|---|---|
| Methylation status INSIGF/GNASASa | n | OR (95% CI) | n | OR (95% CI) | n | OR (95% CI) |
| Hypo/Hypo | 69 | 1 | 34 | 1 | 35 | 1 |
| Hypo/Hyper or Hyper/Hypo | 103 | 1.7 (0.9–3.3) | 59 | 1.1 (0.4–2.7) | 44 | 2.8 (1.0–7.8) |
| Hyper/Hyper | 70 | 2.8 (1.4–5.9) | 33 | 1.1 (0.4–3.1) | 37 | 8.6 (2.7–27.9) |
| Test for trend (Ptrend)† | 0.006 | 0.868 | 3.1×10⁻⁴ | |||
aHypomethylation is defined as below median, hypermethylation as above median.
†Two-sided P-value, adjusted for batch effects, country, age at baseline and sex where appropriate.
Discussion
We report the association of a higher DNA methylation at the imprinted loci INS and GNASAS with the incidence of MI in women. Until now, only the association between various measures of genomic methylation and CHD has been investigated with varied outcomes.36,37 Our results suggest that methylation at specific loci may be an epigenetic marker for the risk of CHD.
It remains to be determined which factors or mechanisms underlie the observed association. Our results may be linked to the developmental origins hypothesis which predicts that individuals who go on to develop CHD were subjected to less favourable conditions in early life than those who do not.1,2,38 INS and GNASAS are regulators of fetal growth. Methylation at GNASAS is crucial for normal imprinting throughout the GNAS locus, in which expression of the antagonists G protein α-subunit (Gαs) and its extra large isoform (XLαs) regulate fetal nutrient demand.28,39 Methylation at the INS promoter establishes imprinting in extra-embryonic tissues, in which expression of the INSIGF transcript regulates placental development.40,41 Further highlighting the putative link to the developmental origins hypothesis are the differences in DNA methylation at INS and GNASAS observed after prenatal exposure to famine that persist throughout life, which are of the same magnitude and are sex-specific.16
Our findings are compatible with a developmental component of MI, but the current study population lacks data on the potential prenatal factors involved, although it is certain that participants of the study population did not experience famine during gestation. Previous work indicated that epigenetically meta-stable loci like INS and GNASAS may be sensitive to various perturbations during early development.12,13,15,18 Prenatal conditions that are associated with an adverse CHD risk profile in adulthood and that have been suggested to produce persistent epigenetic changes include maternal micronutrient deficiency,42 maternal smoking43 and placental morphology.29 Socioeconomic status may be another relevant but as yet less investigated factor related to prenatal conditions.44 If persistent epigenetic signatures of specific prenatal conditions can be established in studies in which these prenatal conditions have been recorded,10,45 they can subsequently be used as surrogate markers to indirectly assess the association of such prenatal conditions with CHD risk in studies that, like our study, lack information on the prenatal environment.21,22
The loci studied here were selected for their sensitivity to prenatal conditions and the influence of prenatal conditions on DNA methylation is well established. However, the difference between female MI cases and controls may also have accumulated during ageing as a result of a differential exposure to environmental factors over the life course.46 If life course exposures indeed contributed to our findings, they appear to be unrelated to traditional CHD risk factors, since the associations between DNA methylation and MI remained after adjustment for these CHD risk factors. As in to the studies on prenatal exposures, we measured DNA methylation on DNA extracted from leucocytes. We previously demonstrated that heterogeneity of the leucocyte population does not influence INS and GNASAS methylation in whole blood10 and, furthermore, individuals with signs of inflammation were excluded from the current study.30 Thus, it is unlikely that cellular heterogeneity contributed to our results.
Epigenetic changes were proposed to be mechanistically involved in CHD development,47 and it may be explored whether the current data can be viewed as supportive of this hypothesis. Higher DNA methylation at INS is associated with lower expression of the insulin gene in pancreatic β-cells.27 Higher DNA methylation at GNASAS is associated with higher expression of Gαs in the adipose tissue, the pituitary and the thyroid glands.28,39 Gαs is a key component of the cAMP-mediated intracellular signal transduction cascade.39 Both cAMP and insulin signalling are implicated in obesity, insulin resistance and other signs of metabolic dysregulation,48 all of which are risk factors for developing CHD. The differences in DNA methylation that we report here, however, were observed in leucocytes, in which insulin is not expressed27 and expression of Gαs is not controlled by DNA methylation at GNASAS.39 Still, the methylation status of imprinted loci in leucocytes is generally thought to mark that of (internal) tissues that are directly involved in disease.10,49 Also, it should be noted that the observed differences in percentage DNA methylation are small, although their magnitude is in line with other human studies.15,16,18–20,50 In a rat study small changes in percentage DNA methylation were demonstrated to explain almost half the variance in gene expression.51 Studies in non-peripheral tissues, incorporating a study design that addresses confounding and reverse causation,52 should be used to establish whether or not small but long-term changes in expression of these loci can influence pathways that are involved in CHD development.
In the current study we found an association between DNA methylation and risk of MI in women, but not in men. This may indicate sex-specificity of the association, similar to sex-specific epigenetic changes associated with prenatal exposure to the Dutch Famine.16 In view of the size of the current and the characteristics of the PROSPER study, the absence of an association in men should be interpreted with caution. We observed sex-specific associations with MI for traditional risk factors that are known to be sex-independent in middle age. This may be related to the age range of the study subjects (70–82 years) and the exclusion of individuals with a history of CHD at baseline. The age is well above the average age of a first MI for men (63 years), but below the average age of a first MI for women (74 years).53,54 To definitely establish whether the associations of INS and GNASAS methylation are sex-specific, larger series of patients and controls that include younger age ranges should be investigated.
It has been proposed that epigenetic marks that are sensitive to the prenatal environment can be used as biomarkers to investigate the developmental origins of health and disease hypothesis.21,22 Our data, in combination with previous results on prenatal exposures15,16,18 indicate the feasibility of this approach. The success of the approach will rely on the identification of epigenetic signatures that mark a specific prenatal condition, e.g. maternal micronutrient deficiency,42 maternal smoking43 and placental morphology.29 This will entail epigenome-wide screening in studies designed to investigate exposures during early development. These epigenetic signatures can subsequently be utilized as biomarkers for disease risk in epidemiological studies of CHD or other chronic diseases.
Supplementary Data
Supplementary Data are available at IJE online
KEY MESSAGES.
We report the association of a higher DNA methylation at the imprinted loci INS and GNASAS with the incidence of myocardial infarction.
The association was predominantly observed among women, which may be related to sex-specific effects and the older age of our study population.
Our results suggest that methylation at specific loci may be an epigenetic marker for the risk of myocardial infarction.
Since differences in INS and GNASAS methylation have been linked to prenatal adversity, our observation may reflect a developmental component of CHD.
Acknowledgements
This work was performed as part of an ongoing collaboration of the PROSPER study group in the universities of Leiden, Glasgow and Cork. This work was supported by grants from the Netherlands Heart Foundation (#2006B083), the Interuniversity Cardiology Institute of the Netherlands (ICIN) and the Durrer Center for Cardiogenetic Research (both Institutes of the Netherlands Royal Academy of Arts and Sciences (KNAW)), an investigator-initiated grant from Bristol-Myers Squibb (USA), the European Union-funded Network of Excellence LifeSpan (FP6/036894), the Center for Medical Systems Biology (CMSB) (a centre of excellence approved by the Netherlands Genomics Initiative (NGI)/Netherlands Organization for Scientific Research (NWO)), the NGI/NWO-funded Netherlands Consortium for Healthy Ageing (NCHA) (#05060810) and the EU project HEALTH-F2-2007 223004 PHASE. J.W. Jukema is an established clinical investigator of the Netherlands Heart Foundation (#2001D032). The funders had no role in study design, data collection and analysis, decision to publish or the preparation of the manuscript.
Conflict of interest: None declared.
References
- 1.Gluckman PD, Hanson MA. Developmental origins of disease paradigm: a mechanistic and evolutionary perspective. Pediatr Res. 2004;56:311–17. doi: 10.1203/01.PDR.0000135998.08025.FB. [DOI] [PubMed] [Google Scholar]
- 2.Barker DJ. The Wellcome Foundation Lecture, 1994. The fetal origins of adult disease. Proc Biol Sci. 1995;262:37–43. doi: 10.1098/rspb.1995.0173. [DOI] [PubMed] [Google Scholar]
- 3.Whincup PH, Kaye SJ, Owen CG, et al. Birth weight and risk of type 2 diabetes: a systematic review. JAMA. 2008;300:2886–97. doi: 10.1001/jama.2008.886. [DOI] [PubMed] [Google Scholar]
- 4.Leon DA, Lithell HO, Vagero D, et al. Reduced fetal growth rate and increased risk of death from ischaemic heart disease: cohort study of 15 000 Swedish men and women born 1915–29. BMJ. 317:241–45. doi: 10.1136/bmj.317.7153.241. [DOI] [PMC free article] [PubMed] [Google Scholar]
- 5.Lumey LH, Stein AD, Kahn HS, Romijn JA. Lipid profiles in middle-aged men and women after famine exposure during gestation: the Dutch Hunger Winter Families Study. Am J Clin Nutr. 2009;89:1737–43. doi: 10.3945/ajcn.2008.27038. [DOI] [PMC free article] [PubMed] [Google Scholar]
- 6.de Rooij S, Painter RC, Roseboom TJ, et al. Glucose tolerance at age 58 and the decline of glucose tolerance in comparison with age 50 in people prenatally exposed to the Dutch famine. Diabetologia. 2006;49:637–43. doi: 10.1007/s00125-005-0136-9. [DOI] [PubMed] [Google Scholar]
- 7.Jaenisch R, Bird A. Epigenetic regulation of gene expression: how the genome integrates intrinsic and environmental signals. Nat Genet. 2003;33(Suppl):245–54. doi: 10.1038/ng1089. [DOI] [PubMed] [Google Scholar]
- 8.Bernstein BE, Meissner A, Lander ES. The mammalian epigenome. Cell. 2007;128:669–81. doi: 10.1016/j.cell.2007.01.033. [DOI] [PubMed] [Google Scholar]
- 9.Cedar H, Bergman Y. Linking DNA methylation and histone modification: patterns and paradigms. Nat Rev Genet. 2009;10:295–304. doi: 10.1038/nrg2540. [DOI] [PubMed] [Google Scholar]
- 10.Talens RP, Boomsma DI, Tobi EW, et al. Variation, patterns, and temporal stability of DNA methylation: considerations for epigenetic epidemiology. FASEB J. 2010;24:3135–44. doi: 10.1096/fj.09-150490. [DOI] [PubMed] [Google Scholar]
- 11.Sinclair KD, Allegrucci C, Singh R, et al. DNA methylation, insulin resistance, and blood pressure in offspring determined by maternal periconceptional B vitamin and methionine status. Proc Natl Acad Sci U S A. 2007;104:19351–56. doi: 10.1073/pnas.0707258104. [DOI] [PMC free article] [PubMed] [Google Scholar]
- 12.Lillycrop KA, Phillips ES, Jackson AA, Hanson MA, Burdge GC. Dietary protein restriction of pregnant rats induces and folic acid supplementation prevents epigenetic modification of hepatic gene expression in the offspring. J Nutr. 2005;135:1382–86. doi: 10.1093/jn/135.6.1382. [DOI] [PubMed] [Google Scholar]
- 13.Gluckman PD, Lillycrop KA, Vickers MH, et al. Metabolic plasticity during mammalian development is directionally dependent on early nutritional status. Proc Natl Acad Sci U S A. 2007;104:12796–800. doi: 10.1073/pnas.0705667104. [DOI] [PMC free article] [PubMed] [Google Scholar]
- 14.Rakyan VK, Blewitt ME, Druker R, Preis JI, Whitelaw E. Metastable epialleles in mammals. Trends Genet. 2002;18:348–51. doi: 10.1016/s0168-9525(02)02709-9. [DOI] [PubMed] [Google Scholar]
- 15.Heijmans BT, Tobi EW, Stein AD, et al. Persistent epigenetic differences associated with prenatal exposure to famine in humans. Proc Natl Acad Sci U S A. 2008;105:17046–49. doi: 10.1073/pnas.0806560105. [DOI] [PMC free article] [PubMed] [Google Scholar]
- 16.Tobi EW, Lumey LH, Talens RP, et al. DNA methylation differences after exposure to prenatal famine are common and timing- and sex-specific. Hum Mol Genet. 2009;18:4046–53. doi: 10.1093/hmg/ddp353. [DOI] [PMC free article] [PubMed] [Google Scholar]
- 17.Stein AD, Kahn HS, Rundle A, Zybert PA, van der Pal-de Bruin, Lumey LH. Anthropometric measures in middle age after exposure to famine during gestation: evidence from the Dutch famine. Am J Clin Nutr. 2007;85:869–76. doi: 10.1093/ajcn/85.3.869. [DOI] [PubMed] [Google Scholar]
- 18.Steegers-Theunissen RP, Obermann-Borst SA, Kremer D, et al. Periconceptional maternal folic acid use of 400 μg per day is related to increased methylation of the IGF2 gene in the very young child. PLoS ONE. 2009;4:e7845. doi: 10.1371/journal.pone.0007845. [DOI] [PMC free article] [PubMed] [Google Scholar]
- 19.Einstein F, Thompson RF, Bhagat TD, et al. Cytosine methylation dysregulation in neonates following intrauterine growth restriction. PLoS ONE. 2010;5:e8887. doi: 10.1371/journal.pone.0008887. [DOI] [PMC free article] [PubMed] [Google Scholar]
- 20.Breton CV, Byun HM, Wenten M, Pan F, Yang A, Gilliland FD. Prenatal tobacco smoke exposure affects global and gene-specific DNA methylation. Am J Respir Crit Care Med. 2009;180:462–67. doi: 10.1164/rccm.200901-0135OC. [DOI] [PMC free article] [PubMed] [Google Scholar]
- 21.Heijmans BT, Tobi EW, Lumey LH, Slagboom PE. The epigenome: Archive of the prenatal environment. Epigenetics. 2009;4:526–31. doi: 10.4161/epi.4.8.10265. [DOI] [PubMed] [Google Scholar]
- 22.Hoyo C, Murphy SK, Jirtle RL. Imprint regulatory elements as epigenetic biosensors of exposure in epidemiological studies. J Epidemiol Commun Health. 2009;63:683–84. doi: 10.1136/jech.2009.090803. [DOI] [PMC free article] [PubMed] [Google Scholar]
- 23.Dong J, Ivascu C, Chang HD, et al. IL-10 is excluded from the functional cytokine memory of human CD4+ memory T lymphocytes. J Immunol. 2007;179:2389–96. doi: 10.4049/jimmunol.179.4.2389. [DOI] [PubMed] [Google Scholar]
- 24.Melzner I, Scott V, Dorsch K, et al. Leptin gene expression in human preadipocytes is switched on by maturation-induced demethylation of distinct CpGs in its proximal promoter. J Biol Chem. 2002;277:45420–27. doi: 10.1074/jbc.M208511200. [DOI] [PubMed] [Google Scholar]
- 25.Probst MC, Thumann H, Aslanidis C, et al. Screening for functional sequence variations and mutations in ABCA1. Atherosclerosis. 2004;175:269–79. doi: 10.1016/j.atherosclerosis.2004.02.019. [DOI] [PubMed] [Google Scholar]
- 26.Cui H, Cruz-Correa M, Giardiello FM, et al. Loss of IGF2 imprinting: a potential marker of colorectal cancer risk. Science. 2003;299:1753–55. doi: 10.1126/science.1080902. [DOI] [PubMed] [Google Scholar]
- 27.Kuroda A, Rauch TA, Todorov I, et al. Insulin gene expression is regulated by DNA methylation. PLoS ONE. 2009;4:e6953. doi: 10.1371/journal.pone.0006953. [DOI] [PMC free article] [PubMed] [Google Scholar]
- 28.Williamson CM, Turner MD, Ball ST, et al. Identification of an imprinting control region affecting the expression of all transcripts in the Gnas cluster. Nat Genet. 2006;38:350–55. doi: 10.1038/ng1731. [DOI] [PubMed] [Google Scholar]
- 29.Thornburg KL, O'Tierney PF, Louey S. Review: The placenta is a programming agent for cardiovascular disease. Placenta. 2010;31(Suppl):S54–59. doi: 10.1016/j.placenta.2010.01.002. [DOI] [PMC free article] [PubMed] [Google Scholar]
- 30.Shepherd J, Blauw GJ, Murphy MB, et al. The design of a prospective study of Pravastatin in the Elderly at Risk (PROSPER). PROSPER Study Group. PROspective Study of Pravastatin in the Elderly at Risk. Am J Cardiol. 1999;84:1192–97. doi: 10.1016/s0002-9149(99)00533-0. [DOI] [PubMed] [Google Scholar]
- 31.Shepherd J, Blauw GJ, Murphy MB, et al. Pravastatin in elderly individuals at risk of vascular disease (PROSPER): a randomised controlled trial. Lancet. 2002;360:1623–30. doi: 10.1016/s0140-6736(02)11600-x. [DOI] [PubMed] [Google Scholar]
- 32.Coolen MW, Statham AL, Gardiner-Garden M, Clark SJ. Genomic profiling of CpG methylation and allelic specificity using quantitative high-throughput mass spectrometry: critical evaluation and improvements. Nucleic Acids Res. 2007;35:e119. doi: 10.1093/nar/gkm662. [DOI] [PMC free article] [PubMed] [Google Scholar]
- 33.Ehrich M, Turner J, Gibbs P, et al. Cytosine methylation profiling of cancer cell lines. Proc Natl Acad Sci U S A. 2008;105:4844–49. doi: 10.1073/pnas.0712251105. [DOI] [PMC free article] [PubMed] [Google Scholar]
- 34.Thompson RF, Suzuki M, Lau KW, Greally JM. A pipeline for the quantitative analysis of CG dinucleotide methylation using mass spectrometry. Bioinformatics. 2009;25:2164–70. doi: 10.1093/bioinformatics/btp382. [DOI] [PMC free article] [PubMed] [Google Scholar]
- 35.Hoyo C, Murtha AP, Schildkraut JM, et al. Methylation variation at IGF2 differentially methylated regions and maternal folic acid use before and during pregnancy. Epigenetics. 2011;6:928–36. doi: 10.4161/epi.6.7.16263. [DOI] [PMC free article] [PubMed] [Google Scholar]
- 36.Kim M, Long TI, Arakawa K, Wang R, Yu MC, Laird PW. DNA methylation as a biomarker for cardiovascular disease risk. PLoS ONE. 2010;5:e9692. doi: 10.1371/journal.pone.0009692. [DOI] [PMC free article] [PubMed] [Google Scholar]
- 37.Baccarelli A, Wright R, Bollati V, et al. Ischemic heart disease and stroke in relation to blood DNA methylation. Epidemiology. 2010;21:819–28. doi: 10.1097/EDE.0b013e3181f20457. [DOI] [PMC free article] [PubMed] [Google Scholar]
- 38.Barker DJ, Osmond C, Forsen TJ, Kajantie E, Eriksson JG. Trajectories of growth among children who have coronary events as adults. N Engl J Med. 2005;353:1802–809. doi: 10.1056/NEJMoa044160. [DOI] [PubMed] [Google Scholar]
- 39.Weinstein LS, Xie T, Zhang QH, Chen M. Studies of the regulation and function of the G(s)alpha gene Gnas using gene targeting technology. Pharmacol Ther. 2007;115:271–91. doi: 10.1016/j.pharmthera.2007.03.013. [DOI] [PMC free article] [PubMed] [Google Scholar]
- 40.Moore GE, bu-Amero SN, Bell G, et al. Evidence that insulin is imprinted in the human yolk sac. Diabetes. 2001;50:199–203. doi: 10.2337/diabetes.50.1.199. [DOI] [PubMed] [Google Scholar]
- 41.Monk D, Sanches R, Arnaud P, et al. Imprinting of IGF2 P0 transcript and novel alternatively spliced INS-IGF2 isoforms show differences between mouse and human. Hum Mol Genet. 2006;15:1259–69. doi: 10.1093/hmg/ddl041. [DOI] [PubMed] [Google Scholar]
- 42.Christian P, Stewart CP. Maternal micronutrient deficiency, fetal development, and the risk of chronic disease. J Nutr. 2010;140:437–45. doi: 10.3945/jn.109.116327. [DOI] [PubMed] [Google Scholar]
- 43.Power C, Atherton K, Thomas C. Maternal smoking in pregnancy, adult adiposity and other risk factors for cardiovascular disease. Atherosclerosis. 2010;211:643–48. doi: 10.1016/j.atherosclerosis.2010.03.015. [DOI] [PubMed] [Google Scholar]
- 44.Barker DJ, Osmond C. Infant mortality, childhood nutrition, and ischaemic heart disease in England and Wales. Lancet. 1986;1:1077–81. doi: 10.1016/s0140-6736(86)91340-1. [DOI] [PubMed] [Google Scholar]
- 45.Feinberg AP, Irizarry RA, Fradin D, et al. Personalized epigenomic signatures that are stable over time and covary with body mass index. Sci Transl Med. 2010;2:49ra67. doi: 10.1126/scitranslmed.3001262. [DOI] [PMC free article] [PubMed] [Google Scholar]
- 46.Christensen BC, Houseman EA, Marsit CJ, et al. Aging and environmental exposures alter tissue-specific DNA methylation dependent upon CpG island context. PLoS Genet. 2009;5:e1000602. doi: 10.1371/journal.pgen.1000602. [DOI] [PMC free article] [PubMed] [Google Scholar]
- 47.Gluckman PD, Hanson MA, Buklijas T, Low FM, Beedle AS. Epigenetic mechanisms that underpin metabolic and cardiovascular diseases. Nat Rev Endocrinol. 2009;5:401–08. doi: 10.1038/nrendo.2009.102. [DOI] [PubMed] [Google Scholar]
- 48.Madsen L, Kristiansen K. The importance of dietary modulation of cAMP and insulin signaling in adipose tissue and the development of obesity. Ann NY Acad Sci. 2010;1190:1–14. doi: 10.1111/j.1749-6632.2009.05262.x. [DOI] [PubMed] [Google Scholar]
- 49.Reik W. Stability and flexibility of epigenetic gene regulation in mammalian development. Nature. 2007;447:425–32. doi: 10.1038/nature05918. [DOI] [PubMed] [Google Scholar]
- 50.Bollati V, Baccarelli A, Hou L, et al. Changes in DNA methylation patterns in subjects exposed to low-dose benzene. Cancer Res. 2007;67:876–80. doi: 10.1158/0008-5472.CAN-06-2995. [DOI] [PubMed] [Google Scholar]
- 51.Lillycrop KA, Phillips ES, Torrens C, Hanson MA, Jackson AA, Burdge GC. Feeding pregnant rats a protein-restricted diet persistently alters the methylation of specific cytosines in the hepatic PPAR alpha promoter of the offspring. Br J Nutr. 2008;100:278–82. doi: 10.1017/S0007114507894438. [DOI] [PMC free article] [PubMed] [Google Scholar]
- 52.Relton CL, Davey SG. Epigenetic epidemiology of common complex disease: prospects for prediction, prevention, and treatment. PLoS Med. 2010;7:e1000356. doi: 10.1371/journal.pmed.1000356. [DOI] [PMC free article] [PubMed] [Google Scholar]
- 53.Joakimsen O, Bonaa KH, Stensland-Bugge E, Jacobsen BK. Age and sex differences in the distribution and ultrasound morphology of carotid atherosclerosis: the Tromso Study. Arterioscler Thromb Vasc Biol. 1999;19:3007–13. doi: 10.1161/01.atv.19.12.3007. [DOI] [PubMed] [Google Scholar]
- 54.Theres H, Maier B, Matteucci GR, et al. Influence of gender on treatment and short-term mortality of patients with acute myocardial infarction in Berlin. Z Kardiol. 2004;93:954–63. doi: 10.1007/s00392-004-0157-2. [DOI] [PubMed] [Google Scholar]