Abstract
We have assessed the utility of five new long-wavelength fluorescent voltage-sensitive dyes (VSD) for imaging the activity of populations of neurons in mouse brain slices. Although all the five were capable of detecting activity resulting from activation of the Schaffer collateral-CA1 pyramidal cell synapse, they differed significantly in their properties, most notably in the signal-to-noise ratio of the changes in dye fluorescence associated with neuronal activity. Two of these dyes, Di-2-ANBDQPQ and Di-1-APEFEQPQ, should prove particularly useful for imaging activity in brain tissue and for combining VSD imaging with the control of neuronal activity via light-activated proteins such as channelrhodopsin-2 and halorhodopsin.
Introduction
Because imaging techniques permit monitoring of the activity of many neurons at once, such approaches represent the most practical means of mapping functional circuits within the brain (Cohen et al., 1974; Gupta et al., 1981). Among the imaging modalities available, only light-based imaging methods offer the possibility of detecting the activity of defined neuron populations with time resolution sufficient to discern individual action potentials (Homma et al., 2009).
Although fluorescent indicators for ions such as calcium (Sinha and Saggau, 1999; Cossart et al., 2005; Fast, 2005; Rochefort et al., 2008), protons (Chen et al., 1999), and chloride (Isomura et al., 2003; Berglund et al., 2006) have proven to be useful probes of neuronal activity, detecting membrane potential changes through voltage-sensitive dyes (VSD) offers the most direct means of monitoring neuronal activity (Cohen and Salzberg, 1978; Wu et al., 1998; Loew et al., 2002; Djurisic et al., 2003; Glover et al., 2008). VSDs typically are organic compounds that bind to cell membranes and have chromophores that shift their absorption and/or fluorescence emission spectra according to the transmembrane potential (Loew et al., 1979; Loew and Simpson, 1981; Zochowski et al., 2000). In addition, protein-based fluorescent voltage sensors have been developed and offer a means of genetically targeting such sensors to particular types of neurons (Baker et al., 2008; Tsutsui et al., 2008). For both organic and genetically-encoded voltage sensors, the direct correlation between dye signals and changes in membrane potential allows noninvasive readout of membrane potential changes associated with neuronal activity (Loew et al., 1985; Antic et al., 1999). In addition to measurements of the activity of neuronal populations, VSDs allow monitoring of electrical signals from cellular compartments that are too small for electrode recording (Antic et al., 2000; Milojkovic et al., 2005; Nuriya et al., 2006; Palmer and Stuart, 2006; Canepari et al., 2007; Zhou et al., 2007, 2008; Nakamura et al., 2007).
However, the properties of current VSDs are not ideal. The main problem has been the poor signal-to-noise ratio (S/N) typically found when recording the activity of populations of neurons. In addition, the spectral properties of VSDs are not optimal for some purposes. Most are excited by relatively short-wavelength light that overlaps with the absorbance spectra of endogenous chromophores (Reinert et al., 2007). This is particularly problematic when imaging in vivo, because light absorption by hemoglobin both reduces VSD excitation and also produces substantial movement artifacts during the heartbeat (Shoham et al., 1999). Short-wavelength light also is readily scattered by brain tissue, limiting the depth of light penetration during fluorescence measurements. Finally, the excitation spectra of these dyes typically overlap with those of light-activated proteins used to control neuronal activity, such as channelrhodopsin-2 and halorhodopsin (Zhang et al., 2007), making it difficult to combine the use of VSDs and such proteins. Such problems would be reduced by using VSDs that absorb and emit at longer wavelengths (Shoham et al., 1999).
Here we consider several new fluorescent VSDs that could be useful for optical monitoring of the activity of neuronal populations in brain tissue. These new VSDs are variants of styryl chromophores with excitation wavelengths extended to red and near infrared region (above 700 nm), offering the possibility of monitoring neuronal activity at long wavelengths. In addition, these variants promise high sensitivity to changes in membrane potential: one (JPW-3067, Di-1-APEThEInPQ) yields an exceptionally high S/N of 40 for detecting single action potentials in lobster nerve (Wuskell et al., 2006). The high aqueous solubility of these dyes also facilitates penetration into thick tissue, such as brain slices. These dyes are sufficiently hydrophilic to permit microinjection into neurons and thereby enable the detection of action potentials in individual cells in rat brain slices (Zhou et al., 2007).
We have examined and compared the abilities of several of these new dyes for detecting neuronal population activity in mouse brain slices. We found that extracellular application of any of the five was capable of reporting optical signals associated with synaptic activity. Two of these dyes, namely Di-2-ANBDQPQ (JPW-6020) and Di-1-APEFEQPQ (JPW-3080), promise to be useful for long-wavelength monitoring of the activity of neuronal populations in mammalian brain tissue.
Results
Properties of long-wavelength VSDs
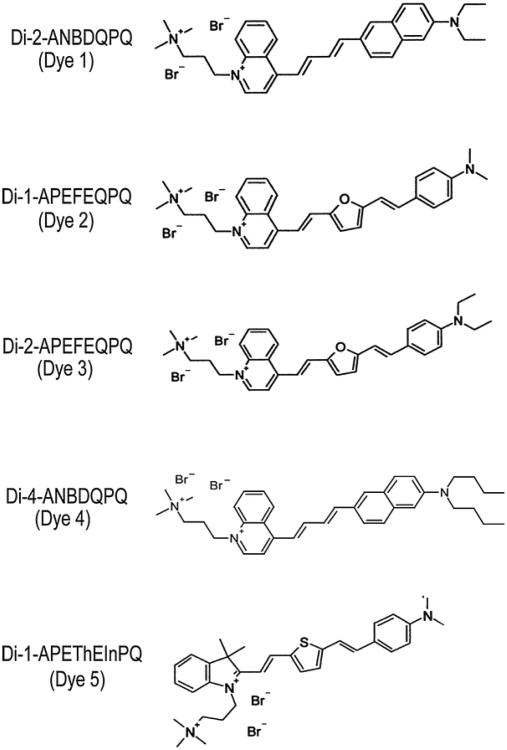
Here we compare the ability of five long-wavelength VSDs to the image activity of populations of neurons in mammalian brain slices. The dyes that we considered are shown in Fig. 1. All of these dyes have chromophores with extended π-conjugation compared to the older styryl dyes, such as Di-4-ANEPPS (6-(dibutylamino-2-naphtyl-styryl-pyridiniumpropyl sulfonate)), used for fluorescent imaging of activity in brain slices. This produces longer wavelength absorbance and fluorescence emission spectra to minimize light scattering from the thick brain slice.
Fig. 1. VSDs considered in our experiments. For simplicity, the names shown in parentheses are used to refer to these dyes in this article.
The dyes have abbreviated names: Di-n-DLAH that provide an indication of their structural components: alkyl chain lengths (n)-π-Donor-Linker(s)-π-Acceptor-hydrophilic Head group (Wuskell et al., 2006). A pair of short-alkyl chains is appended to the amino terminus of each dye (right side of each structure in Fig. 1). The number of carbons in these chains is indicated by the number, in the ‘Di-n’ portion of the name. A π-donor moiety, D, is either aminophenyl (AP) or aminonaphthyl (AN) in this set of dyes. The linker, L, is diene (D) for Dyes 1 and 4, ethane–furan–ethene (EFE) for Dyes 2 and 3 and ethene–thiophene–ethene (EThE) for Dye 5. Dyes 1–4 all have quinolinium (Q) π-acceptors, A, while Dye 5 has an indolenyl (In) π-acceptor. Finally, all the five dyes have quaternary propyltrimethylammonium (PQ) groups as their hydrophilic heads, H. The double positive charges on all these dyes and the relatively short-alkyl chains make these dyes relatively hydrophilic, yielding good solubility in aqueous media. A more detailed discussion of the physical–chemical properties of these dyes can be found in the study of Wuskell et al. (2006).
Imaging neuronal activity with long-wavelength VSDs
We evaluated the ability of the dyes to monitor the activity of populations of neurons in hippocampal slices, a preparation often used for optical studies of synaptic circuitry in the mammalian brain (Grinvald et al., 1982; Sekino et al., 1997; Chang and Jackson, 2003; Canepari et al., 2007; Chang et al., 2007; Nakamura et al., 2007). We begin by describing the results obtained when hippocampal slices were stained with one exemplary dye and then compare the performance of this dye to the others.
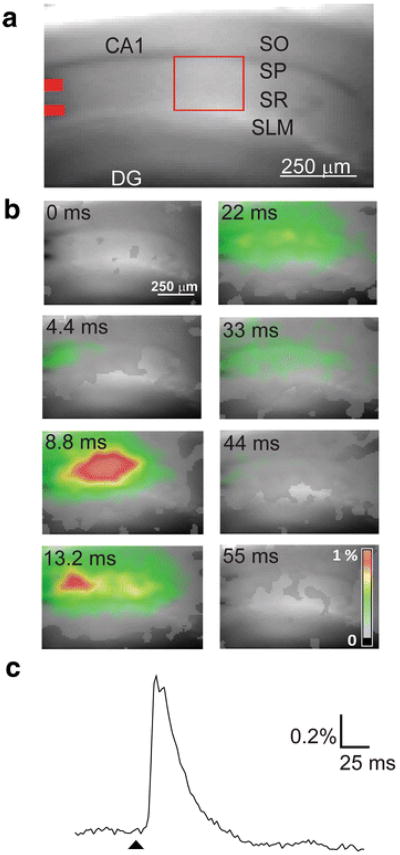
Hippocampal slices were stained by extracellular application of each dye. In order to elicit neuronal activity, we activated the excitatory synapse between Schaffer collateral axons and CA1 pyramidal cells while blocking synaptic inhibition by treating the slices with picrotoxin (100 μM). Our experimental arrangement is shown in Fig. 2a. This fluorescence image illustrates a transverse section of mouse hippocampus stained with Dye 1. Schaffer collateral axons were stimulated by a bipolar stimulating electrode, whose position within the stratum radiatum (SR) is indicated by the pair of red bars at the left side of the image. Responses evoked by such stimuli were then imaged with one of the five dyes described above. These dyes were excited by 615–685 nm light, whereas fluorescence emission was monitored at wavelengths of ≥700 nm.
Fig. 2.
Experimental arrangement and representative VSD imaging data. (a) Fluorescence of hippocampal slice stained with Dye 1. Labels indicate CA1 and dentate gyrus (DG) regions, with cell layers indicated as follows: striatum oriens (SO), striatum pyramidale (SP), striatum radiatum (SR), and striatum lacunosum moleculare (SLM). Stimulating electrodes were placed at the locations shown in red. (b) Pseudocolor maps (scale in lower right) illustrating changes in Dye 1 fluorescence detected at indicated times after stimulation. (c) Time course of response to electrical stimulation; arrowhead indicates time of stimulus. Changes in dye fluorescence were measured in the part of SR indicated by red box in (a)
Examples of the decreases in Dye 1 fluorescence produced by stimulation of the Schaffer collaterals are indicated by the pseudocolor maps as shown in Fig. 2b. These responses had complex spatiotemporal properties. The initial response to the stimulus was observed in <4 ms. This response was located near the stimulating electrodes and represents activity generated by excitatory postsynaptic potentials (EPSPs) produced at the most proximal Schaffer collateral-CA1 pyramidal cell synapses. Over the next few ms, activity spread across the slice to cover the stratum pyramidale (SP) and stratum oriens (SO), in addition to the SR. This response peaked at 8.8 ms and presumably represents synaptic excitation of other CA1 pyramidal cells by the Schaffer collateral axons, leading to the generation of a population spike in the pyramidal cells. Another peak of activity was observed closer to the stimulating electrodes at 13.2 ms; this presumably represents repetitive activity resulting from strong postsynaptic excitation in the absence of synaptic inhibition. The activity associated with the stimulus spread along the Schaffer collateral pathway, throughout the SR, SP, and SO. The time course of the response, measured in the area indicated by the red rectangle in Fig. 2a, is illustrated in Fig. 2c. In this and all subsequent traces shown in this article, a decrease in dye fluorescence is plotted as an upward signal. This response closely resembles extracellular recordings of the field potential generated by the Schaffer collateral-CA1 cell EPSP under these conditions (Sekino et al., 1997; Tominaga et al., 2000).
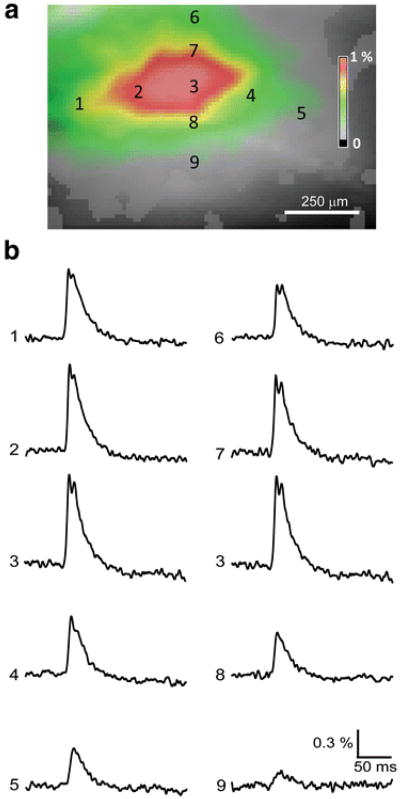
Spatial features of the same response to Schaffer collateral stimulation are analyzed in more detail in Fig. 3. For orientation, the image of the response at its peak—8.8 ms—is shown again in Fig. 3a. The numbers refer to positions where the responses shown in Fig. 3b were detected: a line across the SR (numbers 1–5) and another line transecting the layers of the CA1 area (positions 3 and 6–9). Although the amplitude of responses varied from 0.2 to 1% across these locations, the waveforms of the optical signals were very similar (Fig. 3b). The smallest signals had no notch at their peak, presumably indicating subthreshold EPSPs. Signals gradually increased across the SR, peaked in the middle of the SR, and decayed progressively toward the distal side of CA1 (Fig. 3, positions 1–5). Optical signals recorded across the layers of the CA1 area also were heterogeneous in amplitude, evident both in the activity map shown in Fig. 3a and in the traces shown in Fig. 3b. This progressive reduction in signal amplitude with distance along the dendritic axes of the CA1 pyramidal cells presumably represents decremental propagation of excitation along the dendrites.
Fig. 3.
Spatio-temporal features of responses reported by Dye 1. (a) Pseudocolor map of the response measured at its peak (8.8 ms after stimulus). Numbers refer to positions where the responses shown in (b) were recorded, both across the SR (positions 1–5) and transecting the CA1 layers (positions 3 and 6–9). (b) Optical signals recorded at multiple locations; each response was measured from a single pixel at the numbered sites
Variables important for comparing properties of VSDs
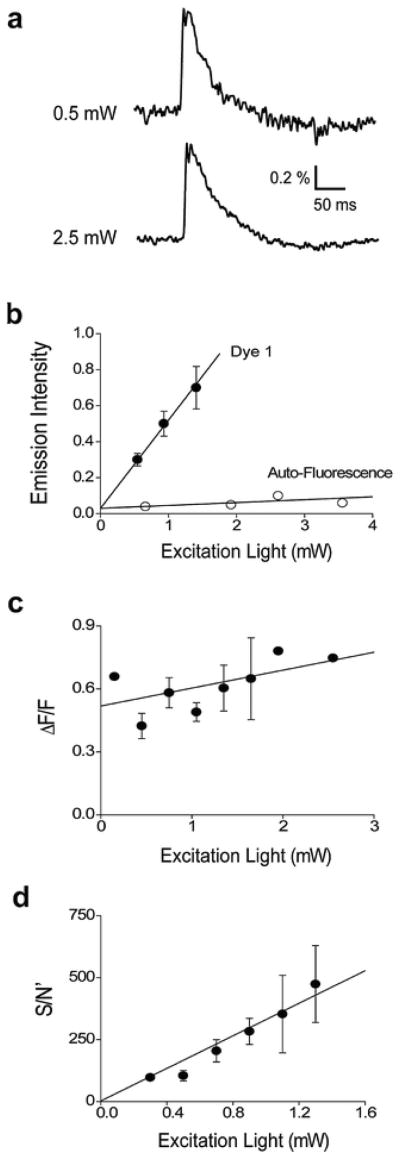
In order to compare the properties of the five long-wavelength VSDs, we needed to take into account several experimental variables. One critical variable was the intensity of the excitation light. Figure 4a illustrates responses, recorded from a slice stained with Dye 1, at two different excitation light levels. As expected, increasing excitation light intensity caused a proportional increase in dye fluorescence emission (Fig. 4b) due to the fact that dye molecules were excited more often. Figure 4b also illustrates that fluorescence emission associated with the dye was greater than the dim autofluorescence of the slice, determined by the measurements of the fluorescence of unstained slices (Fig. 4b). There was little effect of excitation light intensity on the percentage change in dye fluorescence produced by the synaptic response, as measured by the normalized change in fluorescence (ΔF/F; Fig. 4c). This is also to be expected, because ΔF/F should primarily depend upon the biological response and the ability of the dye to detect this response.
Fig. 4.
Effects of excitation light intensity on Dye 1 fluorescence. (a) Responses recorded from the same slice at two different excitation light intensities. (b) Relationship between excitation light intensity and fluorescence emission in slices stained with Dye 1 (n = 13). Open symbols show autofluorescence measured from slices not stained with dye (n = 3). (c) Varying excitation light intensity had little effect on the relative change in dye fluorescence produced in response to neural activity, as measured by the normalized change in fluorescence (ΔF/F; n = 13). (d) Relationship between excitation light intensity and S/N′ of responses (n = 13)
Responses to neuronal activity recorded with brighter excitation light intensity were less noisy than those measured with dim excitation light (Fig. 4a). This noise, measured as the standard deviation of the fluctuations in baseline fluorescence emission, was reduced more than 10-fold by turning off the bright excitation light. This indicates that the noise was primarily associated with the fluorescence signal, rather than camera read-out noise. The S/N ratio for the responses to neuronal activity was calculated, at a Dye 1 concentration of 0.9 mM and an excitation light power of 0.6 mW, by dividing ΔF (signal) by the standard deviation of the fluorescence emission during the pre-stimulus baseline (noise). This yielded an S/N value of 8.30 ± 0.58, which is similar to the S/N value reported for recording action potentials in individual pyramidal neurons following intracellular injection of this dye (Zhou et al., 2007).
Because the S/N varies with the excitation light intensity (Fig. 4a), we developed a means of quantifying the dependence on excitation light intensity. Due to the increase in absolute fluorescence intensity (Fig. 4b), with attendant decrease in noise, along with no change in ΔF/F (Fig. 4c), S/N improved at higher excitation light intensities. This was quantified by dividing ΔF/F (signal) by the variance of the fluorescence emission during the pre-stimulus baseline (noise). Measuring S/N in this way yielded a relationship that is proportional to excitation light intensity (Fig. 4d), rather then showing the usual square root dependence on excitation light intensity. This is due to the fact that we used the variance of fluorescence emission, rather than the usual standard deviation, to determine the noise level. We calculated S/N in this way because the linear dependence on light intensity made it easier for us to quantify dye properties. We will define this parameter as S/N′ to make clear that it differs from the conventional means of measuring S/N.
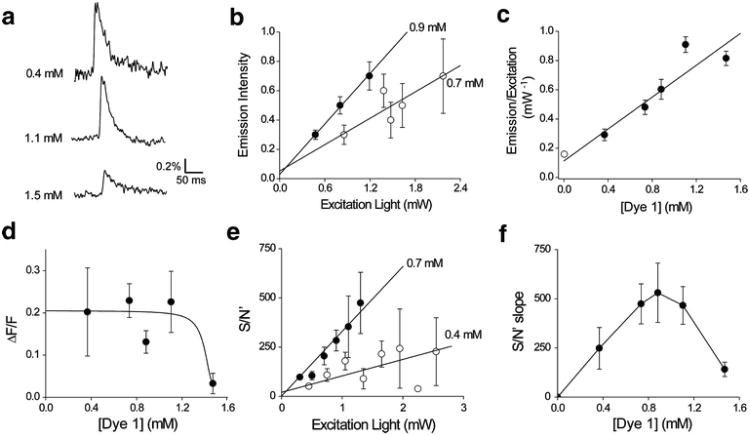
Another important experimental variable was the concentration of dye used to stain the slice. Figure 5 illustrates how concentration affected the performance of Dye 1. We found that varying the concentration of this dye had complex effects on the measured optical responses (Fig. 5a). Given that fluorescence intensity depends upon excitation light intensity (Fig. 4b), it was necessary for us to account for the excitation light level when considering the effect of dye concentration on fluorescence intensity. For a given concentration of Dye 1, increasing light intensity increased dye fluorescence, as in Fig. 4b. The slope of the relationship between excitation light intensity and fluorescence emission depended upon dye concentration, with higher dye concentrations yielding steeper slopes (Fig. 5b). Given that this slope was concentration dependent, and factored out the effect of variable excitation light intensity, we could use the slope to characterize the influence of dye concentration on fluorescence intensity. Higher dye concentrations produced higher fluorescence emission, evident in the relationship between the slope and concentration of Dye 1 (Fig. 5c). Again, note that dye fluorescence was substantially brighter than the autofluorescence (Fig. 5c, open symbol). We next considered the effects of dye concentration on the amplitude of the responses to synaptic activity. Up to a concentration of 1.2 mM, the amplitude of these responses, measured as ΔF/F, were relatively constant. However, ΔF/F decreased significantly at a dye concentration of 1.4 mM (Fig. 5d). This reduction in signal amplitude was probably due to a toxic effect of this high concentration of the dye.
Fig. 5.
Influence of Dye 1 concentration on fluorescence. (a) Representative responses measured in three different slices stained with the indicated dye concentrations. (b) Relationship between excitation light intensity and fluorescence emission, measured at two different dye concentrations. Note steeper slope at higher dye concentration. Data are mean values obtained from 16 slices stained with 0.9 mM dye and 13 slices stained with 0.7 mM dye. (c) Relationship between dye concentration and fluorescence emission, measured as the slope of plots such as those shown in (b) (n = 23). Open symbol shows value for autofluorescence intensity, measured in the same way (n = 3). (d) Relationship between dye concentration and amplitude of optical responses. Points represent mean values obtained from binned measurements made in 5–16 experiments. (e) Dye concentration affects the relationship between S/N′ and excitation light intensity. Data are mean values obtained from 13 slices stained with 0.7 mM dye and 12 slices stained with 0.4 mM dye. (f) Bell-shaped relationship observed between dye concentration and S/N′, measured as the slope of plots such as those shown in (e). Points represent mean values obtained from binned measurements made in 5–16 experiments
In order to determine how dye concentration affects S/N′, we again had to take into account the effect of excitation light intensity. Using the same type of analysis shown in Fig. 4d, we observed that dye concentration affected the relationship between S/N′ and excitation light intensity, specifically altering the slope of this relationship in a concentration-dependent manner (Fig. 5e). Measuring this slope as a function of dye concentration thus allowed us to establish a dose–response curve for the effect of dye concentration on S/N′. The resulting dose–response curve was bell-shaped, with maximal S/N′ measured at a concentration of 0.9 mM (Fig. 5f). This biphasic relationship reflects the interplay between at least two effects: over the low end of the dye concentration range, increasing dye concentration increased fluorescence (as in Fig. 5c) and thereby increased S/N′. At the highest concentration, the toxic effect of the dye (Fig. 5d) reduced signal amplitude and therefore decreased S/N′. Additional factors, such as those described in Chang and Jackson (2003), probably also contribute to the reduction in S/N′ that we observed at the highest dye concentration.
Comparison of VSD properties
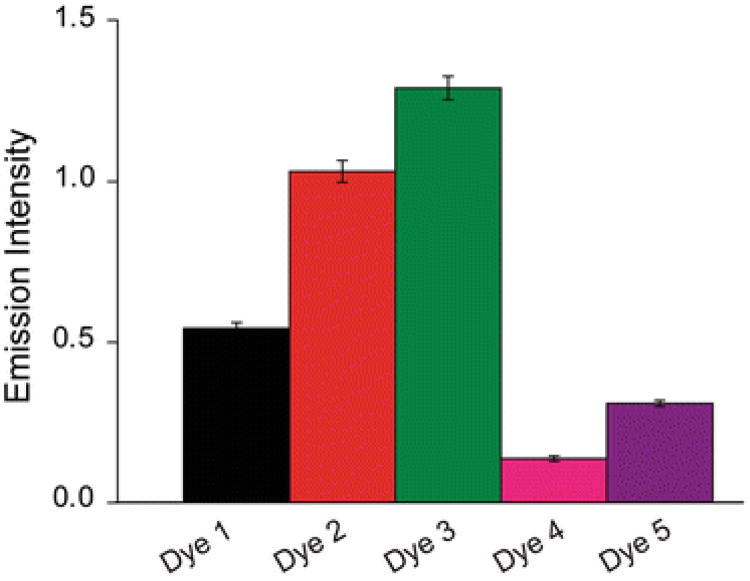
After establishing procedures for defining the fluorescence properties of Dye 1, we could then use these procedures to compare the properties of all the five long-wavelength VSDs. We first compared the brightness of the different dyes by measuring for each the relationship between excitation light intensity and fluorescence emission (as in Fig. 5b) and then plotting this relationship as a function of dye concentration (as in Fig. 5c). The slopes of such plots defined the relative brightness of each dye, independent of excitation light level or dye concentration. Under our recording conditions, we found Dye 3 to be the brightest and Dye 4 was the dimmest (Fig. 6).
Fig. 6.
Comparison of fluorescence brightness of the five VSDs. Brightness was measured as the slope of plots relating dye concentration to normalized fluorescence emission, such as the one shown for Dye 1 in Fig. 5c. Values represent means and error bars indicate ±1 SEM (n = 7–11)
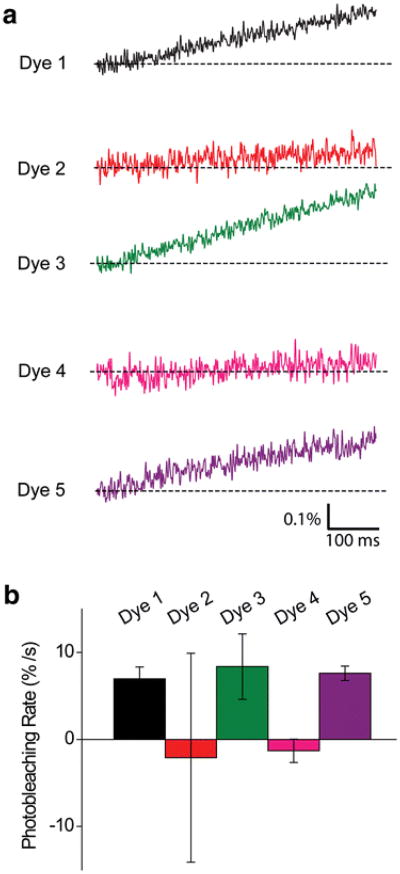
Another factor to consider when comparing these dyes is their rate of bleaching. Bleaching can affect the quality of recording by progressively decreasing the amount of fluorescence, thereby both decreasing S/N′ and producing artifactual time-dependent ΔF/F signals. In addition, bleaching creates free radicals that produce phototoxic damage to the tissue. We therefore determined the bleaching rates of the five dyes. The rate of bleaching was determined by recording the traces of dye fluorescence without stimulating the slices. In this case, the baseline fluorescence was observed to decrease over time, evident as a steady upward drift in the traces shown in Fig. 7a. We determined the relative bleaching rates of the five dyes by measuring the decreases in dye fluorescence observed at a constant level of excitation light, to permit comparison between the bleaching properties of the dyes. The rate of bleaching was then determined from linear regression fits to these decaying signals. The mean bleaching rates for these dyes are compared in Fig. 7b. For all the five long-wavelength VSDs, the rate of bleaching was <1% per second under the illumination conditions that we routinely used for detecting neuronal responses. In fact, Dyes 2 and 4 exhibited no significant bleaching.
Fig. 7.
Rates of photo-bleaching of VSDs. (a) Representative traces of dye fluorescence measured in unstimulated slices exposed to comparable excitation light intensities. (b) Mean bleaching rates (n = 15–38), measured as the slopes of plots such as those shown in (a). Error bars indicate ±1 SEM
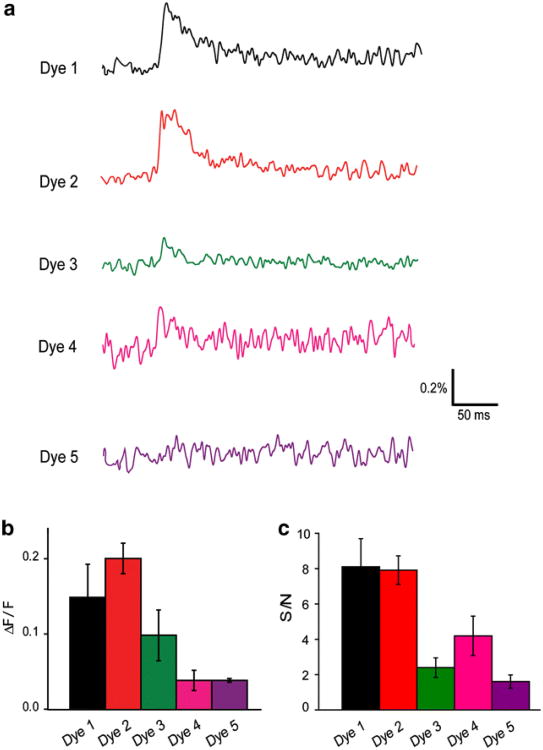
Finally, we compared the ability of each dye to report neuronal activity. Slices were stained with each dye and then stimulated as illustrated in Fig. 2a. In order to facilitate comparison across different slices stained with different dyes, the same stimulating and recording conditions were used in every experiment. Figure 8a compares representative responses recorded from slices stained with similar concentrations of each dye (approximately 1 mM) and obtained at similar excitation light intensities (0.6–0.7 mW). Inspection of these traces reveals that relative signal amplitude (ΔF/F) was largest for Dyes 1 and 2, whereas Dyes 3–5 produced smaller-amplitude signals. A comparison of the mean amplitudes of the ΔF/F responses reported by each dye is provided in Fig. 8b. In all cases, ΔF/F responses were quite stable, decreasing by <5% between successive trials under our illumination conditions. This is consistent with the relative resistance of these dyes to photobleaching (Fig. 7).
Fig. 8.
Comparison of the ability of VSDs to report neural activity. (a) Traces illustrate fluorescence signals recorded from slices stained with approximately 1 mM concentrations of each dye. Responses are obtained at similar excitation light intensities (0.6–0.7 mW) and are arranged in decreasing order of ΔF/F response magnitudes. (b) Mean values of ΔF/F signals (n = 20–42) measured for each dye. (c) Mean values of S/N measured for each dye (n = 6–12). Error bars in (b) and (c) indicate ±1 SEM
We next compared the S/N characteristics of each dye. To facilitate direct comparison to other measurements available in the literature, we first calculated S/N in the conventional way, by measuring the absolute magnitude of the change in fluorescence signal produced by neuronal activity (ΔF) as the signal and calculated noise from the standard deviation of the fluctuations in baseline fluorescence. In these experiments, we measured responses with a single concentration of each dye (approximately 1 mM) and at a single excitation light intensity (approximately 0.5–0.7 mW). Under these conditions, S/N was largest for Dyes 1 and 2, whereas Dyes 3–5 produced smaller S/N values (Fig. 8c).
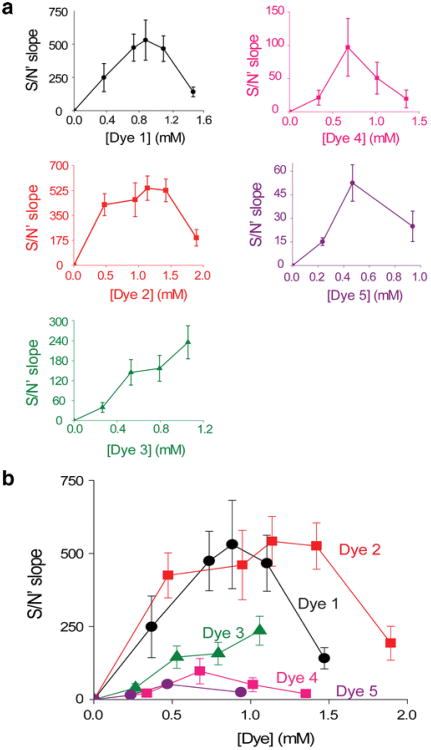
In order to compare the S/N characteristics of each dye more quantitatively, we stained slices with various concentrations of each dye and then quantified their dose–response curves using the procedure spelled out in Fig. 5. These relationships (Fig. 9a; note different x- and y-axis scales) indicated that Dyes 1 and 2 had the largest S/N′ values, with peak values of approximately 500 at their optimal concentrations (approximately 1 mM). On the other hand, Dyes 3–5 had substantially lower S/N′ values at all concentrations tested. With the possible exception of Dye 3—which was only examined up to a concentration of 1.1 mM—all of the dyes had an optimal S/N′ at concentrations of approximately 1 mM and reduced S/N′ at higher concentrations. Figure 9b compares the dose–responses curves for all dyes on the same graph. This plot makes clear that Dyes 1 and 2 yield the best S/N′ characteristics, with these dyes producing maximal S/N′ at concentrations of 0.9 and 1.1 mM, respectively. Although Dye 4 produced a reasonable S/N measured at a single excitation intensity (Fig. 8c), this dye produced a relatively poor S/N′ slope (Fig. 9b) because of its relatively dim fluorescence emission (Fig. 6).
Fig. 9.
Comparison of dye S/N properties when measuring neural activity. (a) Relationship between dye concentration and S/N, measured as shown in Fig. 5e and f. Note different x- and y-axis scales for each plot. Values represent means and error bars indicate ±1 SEM. (b) Comparison of dose–response relationships for all the five dyes. Graphs shown in (b) were replotted with identical Y-axis scales and then superimposed (n = 20–42)
Discussion
Here we have evaluated five new long-wavelength VSDs that promise improved performance for imaging the activity of populations of neurons in hippocampal slices. We found that all five dyes were capable of detecting the transient increase in neuronal activity produced by activating the excitatory synapse between Schaffer collateral axons and CA1 pyramidal cells. However, these dyes varied markedly in their S/N, with the largest S/N observed in slices stained with Dye 1 or 2. Comparing the properties of these two dyes, both yielded similar relative changes in fluorescence in response to activity (ΔF/F) and virtually identical peak S/N′ at optimal concentrations. Although photobleaching was not a significant problem with any of the dyes under our recording conditions, we found that Dye 2 had the lowest rate of bleaching. Dye 2 also was approximately twice as bright as Dye 1. We found that a very high concentration (1.4 mM) of Dye 1 reduces ΔF/F, presumably through an undefined toxic effect that inhibits neuronal activity. Given these properties, Dye 2 may be slightly better for the purpose of measuring neuronal population activity in brain slices, particularly for experiments where excitation light intensity must be limited or when the goal is to obtain prolonged recordings of activity.
Our results complement and extend previous work that has been done to evaluate the performance of these long-wavelength VSDs in other experimental systems. Because of the many differences in experimental conditions, it is not possible to make absolute comparisons between results obtained in different studies. However, a comparison of the relative S/N properties reported for these dyes is informative. For recording population activity in mouse hippocampal slices, the S/N′ of the dyes ranked in the following order: Dye 1, Dye 2 > Dye 3 > Dye 4, Dye 5 (Fig. 9b). For recording action potentials following intracellular introduction of dyes into individual neurons in rat cortical slices, the relative S/N properties are Dye 1, Dye 2 > Dye 4 (see Table 2 in Zhou et al., 2007). Thus, for the dyes that were tested in both studies, the results concur rather closely despite the differences in dye delivery method, brain region studied, and animal species. This suggests that our conclusions about dye properties may apply generally to measurements of neuronal population activity in mammalian brain slices. One modest quantitative discrepancy is that we found the peak S/N′ values for Dye 4 to be approximately 80% smaller than those of Dye 1 or 2, while Zhou et al. (2007) found the S/N of Dye 4 to be only 20–30% smaller than those of Dye 1 or 2 (658 nm excitation). It is likely that differences in optical recording conditions and/or intracellular dye concentration are responsible for to this difference between the two sets of measurements.
More remarkable is the relative ability of these dyes to detect action potentials in lobster nerve; the S/N properties for such signals rank in the order Dye 5 > Dye 2 > Dye 1 (see Table 2 in the study of Wuskell et al. 2006). Specifically, in the lobster nerve preparation Dye 5 was found to have 20 times better S/N than Dye 1, while we found the S/N of Dye 5 to be approximately 0.1 times that of Dye 1 in the mouse hippocampal slice. While some additional improvement in S/N of Dye 5 in slice experiments may be obtained by optimizing excitation and emission wavelengths for individual VSDs, which we did not attempt, this contrast between the performance of the two dyes in the two preparations reiterates previous conclusions that VSDs must be empirically tested for each experimental system (Wu et al., 1998). It also would be interesting to compare the properties of these long-wavelength dyes with other long-wavelength VSDs, most notably RH-1692, which has been reported to yield good S/N recording of neuronal activity in mammalian visual cortex and olfactory bulb (Shoham et al., 1999; Spors and Grinvald, 2002).
Although these new long-wavelength VSDs are capable of high S/N measurements of neuronal population activity in brain slices, certain characteristics of their performance are not as good as those of some short-wavelength VSDs that have been used for this purpose previously. Our analysis of the properties of Di-4-ANEPPS, one of the most popular dyes for such experiments (e.g., Tominaga et al., 2000, 2002; Maeda et al., 2007), indicates that this dye (530–550 nm excitation; 575 nm emission) has a peak S/N′ of approximately 5000 (unpublished results). This value is approximately 10-fold better than the values that we determined for Dyes 1 and 2 (Fig. 9b). Part of the improvement in S/N′ comes from the brightness of Di-4-ANEPPS, which allows lower excitation light intensities to be used. Higher brightness also allows lower concentrations of Di-4-ANEPPS to be used. Another factor that reduces the relative S/N of the long-wavelength dyes is the insensitivity of our detector to long-wavelength photons. Between 700 and 800 nm, the quantum efficiency of our detector is approximately 0.5–0.8 of its peak value at shorter wavelengths. The use of detectors with better sensitivity to long-wavelength light would improve the S/N in such experiments. Thus, we conclude that these long-wavelength dyes will be most suitable for experiments where light scattering or absorbance is limiting, such as when imaging neuronal activity in vivo, or when combining VSD imaging with the use of light-activated proteins such as channelrhodopsin-2 and halorhodopsin to control neuronal activity (Zhang et al., 2007).
Due to the large number of neurons in the mammalian brain, as well as the intricacy of the synaptic circuits that connect these neurons (Jonas et al., 2004; Sjostrom et al., 2008), understanding the brain function requires the simultaneous measurement of electrical activity from populations of neurons. VSD imaging provides the most promising means to achieve this technical goal (Cohen and Salzberg, 1978; Hirota et al., 1995) and our analysis of the properties of the new long-wavelength VSD reveals that some of these dyes are the valuable additions to the spectrum of VSDs available for monitoring the electrical activity of neuronal populations.
Methods
Slice preparation and dye staining
Male C57BL/6J mice (CLEA Inc, Japan) 2–4 months in age were decapitated under deep halothane anesthesia and both hippocampi were quickly removed. Transverse sections (400 μm) of the hippocampus were sliced in ice-cold artificial CSF (ACSF) using a Vibratome 1000 Plus (St. Louis, MO). The ACSF solution contained (in mM) 124 NaCl, 5 KCl, 2.6 NaH2PO4, 2 MgSO4, 2 CaCl2, 26 NaHCO3, and 10 glucose at pH 7.35, which was continuously bubbled with a mixture of 95% O2 and 5% CO2. Slices from only the central part of the hippocampus were used; prior to their use, a cut was made between the CA1 and CA3 regions to prevent spontaneous repetitive firing that ordinarily occurs when slices are treated with picrotoxin to block synaptic inhibition. All experiments were performed according to the guidelines of the Animal Care and Experimentation Committee of the University of Tokyo (Tokyo, Japan).
Slices were preincubated for 1 h at room temperature in an interface-type reservoir and then were stained for 1 h by exposure to ACSF solutions containing variable concentrations of VSDs. Stock solutions were prepared by dissolving VSDs in DMSO with Pluronic detergent (20%). Synthesis of the VSDs is described in Wuskell et al. (2006).
Brain-slice optical recording
VSD imaging was performed on a fluorescence macroscope (MVX10 MacroView, Olympus), equipped with a high-speed camera (MiCam02; Brain Vision, Inc., Tokyo, Japan). A 2× objective lens (MVPLAPA2XC; NA 0.5, Olympus), kept at a zoom of 4×, was used both to excite the VSDs and to collect their fluorescence emission. The excitation filter was 615–695 nm, the emission filter was a 700 nm long-pass filter, and the dichroic mirror cut-off at 685 nm (FF685-Di01, Semrock Inc., New York, NY). An additional ×0.63 projecting lens (MVX-TV0.63XC; Olympus) was used to concentrate emitted fluorescent light on the camera chip. In order to avoid camera saturation, in all cases the excitation light intensity was varied as necessary to keep the resting fluorescence signal within 30–70% of the dynamic range of the camera.
Slices were perfused, at a rate of 2 ml min−1, with ACSF solution bubbled continuously with a 95% O2/5% CO2 gas mixture. The ACSF contained 100 μM picrotoxin and was maintained at room temperature. Synaptic activity was elicited by a bipolar tungsten electrode (FHC, Bowdoinham, ME) placed on the proximal side of CA1 for stimulation. Stimulus pulses (30 μA, 0.2 ms duration) were delivered by a SEN-7203 stimulator (NIHON KOHDEN Corp., Tokyo Japan).
Fluorescence images were acquired with BrainVision software (Japan). In each acquisition trial, 512 consecutive images of 96 × 80 pixels were acquired at 2.2 ms intervals. A total of eight trials were averaged in each experiment and spatially filtered (5 × 5 pixel binning), to further improve the S/N. Unless otherwise indicated, results are expressed as means ± SEM.
Acknowledgments
This study was supported by funds from the Duke-NUS Graduate Medical School, and NIMH grant to G. Augustine, as well as NIH Grant EB001963 to L. Loew, and a Grant-in-Aid for Scientific Research on Priority Areas from MEXT of Japan (20021010) to Y. Sekino.
References
- Antic S, Major G, Zecevic D. Fast optical recordings of membrane potential changes from dendrites of pyramidal neurons. J Neurophysiol. 1999;82:1615–1621. doi: 10.1152/jn.1999.82.3.1615. [DOI] [PubMed] [Google Scholar]
- Antic S, Wuskell JP, Loew L, Zecevic D. Functional profile of the giant metacerebral neuron of Helix aspersa: temporal and spatial dynamics of electrical activity in situ. J Physiol. 2000;527:55–69. doi: 10.1111/j.1469-7793.2000.00055.x. [DOI] [PMC free article] [PubMed] [Google Scholar]
- Baker B, Mutoh H, Dimitrov D, Akemann W, Perron A, Iwamoto Y, Jin L, Cohen L, Isacoff E, Pieribone V, Hughes T, Knӧpfel T. Genetically encoded fluorescent sensors of membrane potential. Brain Cell Biol. 2008;36:53–67. doi: 10.1007/s11068-008-9026-7. [DOI] [PMC free article] [PubMed] [Google Scholar]
- Berglund K, Schleich W, Krieger P, Loo L, Wang D, Cant N, Feng G, Augustine G, Kuner T. Imaging synaptic inhibition in transgenic mice expressing the chloride indicator, Clomeleon. Brain Cell Biol. 2006;35:207–228. doi: 10.1007/s11068-008-9019-6. [DOI] [PMC free article] [PubMed] [Google Scholar]
- Canepari M, Djurisic M, Zecevic D. Dendritic signals from rat hippocampal CA1 pyramidal neurons during coincident pre- and post-synaptic activity: a combined voltage- and calcium-imaging study. J Physiol. 2007;580:463–484. doi: 10.1113/jphysiol.2006.125005. [DOI] [PMC free article] [PubMed] [Google Scholar]
- Chang PY, Taylor PE, Jackson MB. Voltage imaging reveals the CA1 region at the CA2 border as a focus for epileptiform discharges and long-term potentiation in hippocampal slices. J Neurophysiol. 2007;98:1309–1322. doi: 10.1152/jn.00532.2007. [DOI] [PubMed] [Google Scholar]
- Chen G, Hanson CL, Dunbar RL, Ebner TJ. Novel form of spreading acidification and depression in the cerebellar cortex demonstrated by neutral red optical imaging. J Neurophysiol. 1999;81:1992–1998. doi: 10.1152/jn.1999.81.4.1992. [DOI] [PubMed] [Google Scholar]
- Cohen L, Salzberg B. Optical measurement of membrane potential. Rev Physiol Biochem Pharmacol. 1978;83:35–88. doi: 10.1007/3-540-08907-1_2. [DOI] [PubMed] [Google Scholar]
- Cohen LB, Salzberg BM, Davila HV. Changes in axon fluorescence during activity: molecular probes of membrane potential. J Membr Biol. 1974;19:1–36. doi: 10.1007/BF01869968. [DOI] [PubMed] [Google Scholar]
- Cossart R, Ikegaya Y, Yuste R. Calcium imaging of cortical networks dynamics. Cell Calcium. 2005;37:451–457. doi: 10.1016/j.ceca.2005.01.013. [DOI] [PubMed] [Google Scholar]
- Djurisic M, Zochowski M, Wachowiak M, Falk CX, Cohen LB, Zecevic D. Optical monitoring of neural activity using voltage-sensitive dyes. Methods Enzymol. 2003;361:423–451. doi: 10.1016/s0076-6879(03)61022-0. [DOI] [PubMed] [Google Scholar]
- Fast VG. Simultaneous optical imaging of membrane potential and intracellular calcium. J Electrocardiol. 2005;38:107–112. doi: 10.1016/j.jelectrocard.2005.06.023. [DOI] [PubMed] [Google Scholar]
- Gao W, Dunbar RL, Chen G, Reinert KC, Oberdick J, Ebner TJ. Optical imaging of long-term depression in the mouse cerebellar cortex in vivo. J Neurosci. 2003;23:1859–1866. doi: 10.1523/JNEUROSCI.23-05-01859.2003. [DOI] [PMC free article] [PubMed] [Google Scholar]
- Glover JC, Sato K, Sato YM. Using voltage-sensitive dye recording to image the functional development of neuronal circuits in vertebrate embryos. Dev Neurobiol. 2008;68:804–816. doi: 10.1002/dneu.20629. [DOI] [PubMed] [Google Scholar]
- Grinvald A, Manker A, Segal M. Visualization of the spread of electrical activity in rat hippocampal slices by voltage-sensitive optical probes. J Physiol. 1982;333:269–291. doi: 10.1113/jphysiol.1982.sp014453. [DOI] [PMC free article] [PubMed] [Google Scholar]
- Gupta RK, Salzberg BM, Grinvald A. Improvements in optical methods for measuring rapid changes in membrane potential. J Membr Biol. 1981;58:123–137. doi: 10.1007/BF01870975. [DOI] [PubMed] [Google Scholar]
- Hirota A, Sato K, Momose-Sato Y, Sakai T, Kamino K. A new simultaneous 1020-site optical recording system for monitoring neural activity using voltage-sensitive dyes. J Neurosci Methods. 1995;56:187–194. doi: 10.1016/0165-0270(94)00123-x. [DOI] [PubMed] [Google Scholar]
- Homma R, Baker BJ, Jin L, Garaschuk O, Konnerth A, Cohen LB, Bleau CX, Canepari M, Djurisic M, Zecevic D. Wide-field and two-photon imaging of brain activity with voltage- and calcium-sensitive dyes. Methods Mol Biol. 2009;489:43–79. doi: 10.1007/978-1-59745-543-5_3. Kee et al. Voltage-sensitive dye imaging 170. [DOI] [PubMed] [Google Scholar]
- Isomura Y, Sugimoto M, Fujiwara-Tsukamoto Y, Yamamoto-Muraki S, Yamada J, Fukuda A. Synaptically activated Claccumulation responsible for depolarizing GABAergic responses in mature hippocampal neurons. J Neurophysiol. 2003;90:2752–2756. doi: 10.1152/jn.00142.2003. [DOI] [PubMed] [Google Scholar]
- Jonas P, Bischofberger J, Fricker D, Miles R. Interneuron diversity series: Fast in, fast out—temporal and spatial signal processing in hippocampal interneurons. Trends Neurosci. 2004;27:30–40. doi: 10.1016/j.tins.2003.10.010. [DOI] [PubMed] [Google Scholar]
- Loew LM, Campagnola P, Lewis A, Wuskell JP. Confocal and nonlinear optical imaging of potentiometric dyes. Methods Cell Biol. 2002;70:429–452. doi: 10.1016/s0091-679x(02)70013-7. [DOI] [PubMed] [Google Scholar]
- Loew LM, Cohen LB, Salzberg BM, Obaid AL, Bezanilla F. Charge-shift probes of membrane potential. Characterization of aminostyrylpyridinium dyes on the squid giant axon. Biophys J. 1985;47:71–77. doi: 10.1016/S0006-3495(85)83878-9. [DOI] [PMC free article] [PubMed] [Google Scholar]
- Loew LM, Scully S, Simpson L, Waggoner AS. Evidence for a charge-shift electrochromic mechanism in a probe of membrane potential. Nature. 1979;281:497–499. doi: 10.1038/281497a0. [DOI] [PubMed] [Google Scholar]
- Loew LM, Simpson L. Charge shift probes of membrane potential. A probable electrochromic mechanism for ASP probes on a hemispherical lipid bilayer. Biophys J. 1981;34:353–365. doi: 10.1016/S0006-3495(81)84854-0. [DOI] [PMC free article] [PubMed] [Google Scholar]
- Maeda H, Ohno T, Sakurai M. Optical and electrophysiological recordings of corticospinal synaptic activity and its developmental change in in vitro rat slice co-cultures. Neuroscience. 2007;150:829–840. doi: 10.1016/j.neuroscience.2007.10.010. [DOI] [PubMed] [Google Scholar]
- Milojkovic BA, Wuskell JP, Loew LM, Antic SD. Initiation of sodium spikelets in basal dendrites of neocortical pyramidal neurons. J Membr Biol. 2005;208:155–169. doi: 10.1007/s00232-005-0827-7. [DOI] [PMC free article] [PubMed] [Google Scholar]
- Nakamura M, Sekino Y, Manabe T. GABAergic interneurons facilitate mossy fiber excitability in the developing hippocampus. J Neurosci. 2007;27:1365–1373. doi: 10.1523/JNEUROSCI.4672-06.2007. [DOI] [PMC free article] [PubMed] [Google Scholar]
- Nuriya M, Jiang J, Nemet B, Eisenthal KB, Yuste R. Imaging membrane potential in dendritic spines. Proc Natl Acad Sci U S A. 2006;103:786–790. doi: 10.1073/pnas.0510092103. [DOI] [PMC free article] [PubMed] [Google Scholar]
- Palmer LM, Stuart GJ. Site of action potential initiation in Layer 5 pyramidal neurons. J Neurosci. 2006;26:1854–1863. doi: 10.1523/JNEUROSCI.4812-05.2006. [DOI] [PMC free article] [PubMed] [Google Scholar]
- Reinert KC, Gao W, Chen G, Ebner TJ. Flavoprotein autofluorescence imaging in the cerebellar cortex in vivo. J Neurosci. 2007;85:3221–3232. doi: 10.1002/jnr.21348. [DOI] [PubMed] [Google Scholar]
- Rochefort NL, Jia H, Konnerth A. Calcium imaging in the living brain: prospects for molecular medicine. Trends Mol Med. 2008;14:389–399. doi: 10.1016/j.molmed.2008.07.005. [DOI] [PubMed] [Google Scholar]
- Sekino Y, Obata K, Tanifuji M, Mizuno M, Murayama J. Delayed signal propagation via CA2 in rat hippocampal slices revealed by optical recording. J Neurophysiol. 1997;78:1662–1668. doi: 10.1152/jn.1997.78.3.1662. [DOI] [PubMed] [Google Scholar]
- Shoham D, Glaser DE, Arieli A, Kenet T, Wijnbergen C, Toledo Y, Hildesheim R, Grinvald A. Imaging cortical dynamics at high spatial and temporal resolution with novel blue voltage-sensitive dyes. Neuron. 1999;24:791–802. doi: 10.1016/s0896-6273(00)81027-2. [DOI] [PubMed] [Google Scholar]
- Sinha SR, Saggau P. Simultaneous optical recording of membrane potential and intracellular calcium from brain slices. Methods. 1999;18:204–214. doi: 10.1006/meth.1999.0773. [DOI] [PubMed] [Google Scholar]
- Sjostrom PJ, Rancz EA, Roth A, Hausser M. Dendritic excitability and synaptic plasticity. Physiol Rev. 2008;88:769–840. doi: 10.1152/physrev.00016.2007. [DOI] [PubMed] [Google Scholar]
- Spors H, Grinvald A. Spatio-temporal dynamics of odor representations in the mammalian olfactory bulb. Neuron. 2002;34:301–315. doi: 10.1016/s0896-6273(02)00644-x. [DOI] [PubMed] [Google Scholar]
- Tominaga T, Tominaga Y, Yamada H, Matsumoto G, Ichikawa M. Quantification of optical signals with electrophysiological signals in neural activities of Di-4-ANEPPS stained rat hippocampal slices. J Neurosci Methods. 2000;102:11–23. doi: 10.1016/s0165-0270(00)00270-3. [DOI] [PubMed] [Google Scholar]
- Tominaga T, Tominaga Y, Ichikawa M. Optical imaging of long-lasting depolarization on burst stimulation in area CA1 of rat hippocampal slices. J Neurophysiol. 2002;88:1523–1532. doi: 10.1152/jn.2002.88.3.1523. [DOI] [PubMed] [Google Scholar]
- Tsutsui H, Karasawa S, Okamura Y, Miyawaki A. Improving membrane voltage measurements using FRET with new fluorescent proteins. Nat Methods. 2008;5:683–685. doi: 10.1038/nmeth.1235. [DOI] [PubMed] [Google Scholar]
- Wu JY, Lam YW, Falk CX, Cohen LB, Fang J, Loew L, Prechtl JC, Kleinfeld D, Tsau Y. Voltage-sensitive dyes for monitoring multineuronal activity in the intact central nervous system. Histochem J. 1998;30:169–187. doi: 10.1023/a:1003295319615. [DOI] [PubMed] [Google Scholar]
- Wuskell JP, Boudreau D, Wei MD, Jin L, Engl R, Chebolu R, Bullen A, Hoffacker KD, Kerimo J, Cohen LB, Zochowski MR, Loew LM. Synthesis, spectra, delivery and potentiometric responses of new styryl dyes with extended spectral ranges. J Neurosci Methods. 2006;151:200–215. doi: 10.1016/j.jneumeth.2005.07.013. Kee et al. Voltage-sensitive dye imaging 171. [DOI] [PubMed] [Google Scholar]
- Zhang F, Aravanis A, Adamantidis A, de Lecea L, Deisseroth K. Circuit-breakers: optical technologies for probing neural signals and systems. Nat Rev Neurosci. 2007;8:577–581. doi: 10.1038/nrn2192. [DOI] [PubMed] [Google Scholar]
- Zhou WL, Yan P, Wuskell JP, Loew LM, Antic SD. Intracellular longwavelength voltage-sensitive dyes for studying the dynamics of action potentials in axons and thin dendrites. J Neurosci Methods. 2007;164:225–239. doi: 10.1016/j.jneumeth.2007.05.002. [DOI] [PMC free article] [PubMed] [Google Scholar]
- Zhou WL, Yan P, Wuskell JP, Loew LM, Antic SD. Dynamics of action potential backpropagation in basal dendrites of prefrontal cortical pyramidal neurons. Eur J Neurosci. 2008;27:923–936. doi: 10.1111/j.1460-9568.2008.06075.x. [DOI] [PMC free article] [PubMed] [Google Scholar]
- Zochowski M, Wachowiak M, Falk C, Cohen L, Lam Y, Antic S, Zecevic D. Imaging membrane potential with voltage-sensitive dyes. Biol Bull. 2000;198:1–21. doi: 10.2307/1542798. Kee et al. Voltage-sensitive dye imaging 172. [DOI] [PubMed] [Google Scholar]


