Background: Primary response genes (PRGs) are important for proliferation and play a prominent role in B cell activation.
Results: Distinct stimuli produce distinct modes of PRG regulation at the levels of both splicing and transcription.
Conclusion: RNA maturation and splicing are regulated in a signal-specific manner.
Significance: The nature of signaling controls the duration of transcriptional and splicing responses.
Keywords: Fos, Immunology, Signaling, Spliceosome, Transcription, B Cells, c-fos, Signaling, Splicing, Transcription
Abstract
Deregulated gene expression in B cells often results in various lymphoid malignancies and immune deficiencies. Therefore, understanding signal-induced gene regulatory pathways involved during B cell activation is important to tackle pathologies associated with altered B cell function. Primary response genes (PRGs) are rapidly induced upon signaling in B cells and other cell types and often encode oncogenic transcription factors, which are associated with various malignancies. However, an important issue that remains unclear is whether the fundamental mechanism of activation of these genes is essentially the same under such diverse conditions. c-fos is a PRG that is induced rapidly upon activation of B cells in response to a wide variety of stimuli. Using the c-fos gene as a candidate PRG, we addressed here how it is regulated in response to tumor-promoting and antigen-mimicking signals. Our results show that although the mRNA was induced and extinguished within minutes in response to both signals, surprisingly, apparently full-length unspliced pre-mRNA persisted for several hours in both cases. However, although the mitogenic signal resulted in a more sustained mRNA response that persisted for 4 h, antigenic signaling resulted in a more robust but very transient response that lasted for <1 h. Moreover, the pre-mRNA profile exhibited significant differences between the two signals. Additionally, the splicing regulation was also observed with egr-2, but not with c-myc. Together, these results suggest a previously underappreciated regulatory step in PRG expression in B cells.
Introduction
B cells are essential components of our immune system, and they respond to various cell extrinsic signals to mount an immune response. However, stimulation through different receptors will result in engagement of different signaling pathways and subsequently will result in qualitative differences in programs that initiate the proliferative process (1). As proliferation will have profound effects on the regulation of B cell differentiation, survival, and pathologies, strong regulation at multiple points is necessary for proper B cell function (2, 3).
B cells mature in multiple stages, and signaling via the B cell receptor (BCR)2 dictates B cell fate depending on the particular stage of maturation. Thus, BCR signaling in immature B cells results in cell death, whereas BCR signaling in mature B cells results in survival and proliferation of these cells (2–4). Moreover, mature B cells respond differently to transient versus sustained BCR signaling (5). Interestingly, although the early kinetics (1–2 h) of expression of most primary response genes (PRGs) are very similar in both transient and sustained signaling, some of the PRGs are expressed for an extended period (6–9 h) only after sustained signaling (5). Taken together, these results suggest that both the duration of signaling and the cell-type context are important for biological responses and that the levels of expression of PRGs might have distinct effects in determining these responses (5–8).
The stimulation of mature B cells by both anti-IgM (BCR signaling) and the addition of the mitogenic agent phorbol 12-myristate 13-acetate together with the ionophore ionomycin (P+I) promotes transition from the resting G0 state into the G1 phase of the cell cycle (9–12). These changes are associated with de novo protein synthesis-independent rapid induction of PRGs, which include c-myc, c-fos, egr-1, egr-2, and junB, and have been found to play a role in B cell proliferation (9–13). For example, regulated expression of c-myc is associated with stage-specific B cell proliferation (14). B cells activated by anti-IgM also transiently express the c-fos mRNA within 0.5 h and then enter into S phase of the cell cycle within 4–8 h (9–13). However, the mechanisms of such rapid transcriptional induction in B cells are unknown. Most information regarding c-fos regulation has been obtained in fibroblasts. Transcription of the c-fos mRNA peaks within 15–30 min after the addition of fresh serum or growth factor to the culture medium and then declines abruptly, returning to initial low levels by ∼60 min (15). Although these events take place long before DNA synthesis and changes in nucleosome structure during nucleosome assembly at the replication fork, it is a challenge to understand both the basal and induced chromatin status of this gene (16, 17).
Given that induction of c-fos plays a critical role in driving signal-induced B cell proliferation, we sought to study its transcriptional and epigenetic regulation in response to anti-IgM and P+I stimulation using a mature murine B cell line as a model system. Although both signals regulate c-fos expression in similar ways, there are differences in c-fos expression in response to these signals particularly in terms of unspliced pre-RNA generation. In addition, we show that another PRG, egr-2, is regulated in a similar fashion as c-fos, whereas c-myc is not. Our results reveal an unexpected regulatory step of PRG expression at the level of primary transcription.
EXPERIMENTAL PROCEDURES
Cells and Induction
The mature mouse B cell lymphoma BAL17 was cultured in RPMI medium with HEPES (Invitrogen) supplemented with 100 units/ml penicillin, 100 μg/ml streptomycin, 1 mm sodium pyruvate, 0.5 mm 2-mercaptoethanol solution (all Invitrogen) and 10% fetal calf sera (Atlanta Biologicals). 1–2 × 10⁶ cells were used for RNA-based assays, and 2 × 10⁷ cells were used for ChIP. 10 ng/ml phorbol 12-myristate 13-acetate (Sigma) and 150 nm ionomycin (Sigma) were added to cell medium for P+I induction of transcription. For BCR induction, goat IgG Fab fragments specific for mouse IgM (Jackson ImmunoResearch Laboratories) were added at 10 μg/ml to cells for various times. 5,6-Dichloro-1-β-d-ribofuranosyl-1H-benzimidazole (DRB; Sigma) was used at 100 μm for 10 min prior to stimulation. Meayamycin (18) was incubated with cells at a concentration of 10 nm for 30 min prior to cell stimulation.
Mouse primary splenic cells were isolated from 8-week-old C57BL/6 male mice (The Jackson Laboratory) following normal procedures. Resting B cells were isolated by labeling splenocytes with antibody against the activation marker CD43 (Miltenyi) and isolating the negative population (CD43−) as resting B cells following the manufacturer's protocol. The cells were incubated on ice for 30 min with or without ligands, 25 μg/ml Salmonella typhimurium typhi LPS (Sigma) or 10 μg/ml goat IgG Fab fragments specific for mouse IgM, before incubation at 37 °C and 5% CO2 for the times indicated.
Quantitative Real-time PCR
RNA was isolated with the Ambion® PureLink RNA mini kit (Invitrogen), followed by digestion with DNase I (Ambion) and purification with a secondary PureLink RNA column. Random primers and reverse transcriptase (Applied Biosystems) were employed to produce cDNA, which was then digested with RNase (Sigma). Samples were diluted in SYBR Green solution (Applied Biosystems) following the manufacturer's instructions. Primers were kept at 900 nm, and samples were run in triplicate with a thermal profile of 95 °C for 10 min and 40 cycles of 95 °C for 15 s and 60 °C for 45 s with the recommended thermal dissociation curve provided by the Applied Biosystems 7300 real-time PCR system. The RT-PCR signals were monitored for consistent dissociation curves and temperatures. All analyses were performed in triplicate. The following primers were used: c-fos mRNA, GGATTTGACTGGAGGTCTG and TGGGCTCAGGGTCGTTGA; c-myc mRNA, TCTCCACTCACCAGCACAACTACG and ATCTGCTTCAGGACCCT; egr-2 mRNA, ATCCTGCGACCTCGAAAGTA and TCAGAGCGTGAGAACCTCCT; and β-actin mRNA, CCTCTATGCCAACACAGTGCGTGCTA and GGAGCCAGAGCAG. The primary transcript primers were as follows: fos, GGCTCTCCTGTCAACACACA and TCCAGAGCGAAAAAGGAAGA (exon 1 to intron 1), CCTGTGCTGGAACCTCCTC and TGTCACCGTGGGGATAAGT (intron 1 to exon 2), GAATGGTGAAGACCGTGTCA and AGCCCCACAAAGGTCCAGAAT (exon 2 to intron 2), ACTGGGGTGACTGAATGGAG and CCTTCGGATTCTCCGTTTCT (intron 2 to exon 3), AGAAACGGAGAATCCGAAGG and GTTCAACCTACCGCTTGGAG (exon 3 to intron 3), and GTTGGAGCTTGGGACTATGG and TGCAACGCAGACTTCTCATC (intron 3 to exon 4); c-myc, AGAGCTCCTCGAGCTGTTTG and CGCTACATTCAAGACGCAGA (intron 1 to exon 1) and AGACTTGCTTCCCTTGCTGT and AGGGCTGTACGGAGTCGTAG (intron 2 to exon 2); and egr-2, GACCATCTTCCCCAATGGT and CCACAAGCTCCGAAGAAGAC (exon 1 to intron 1) and CTCATTGTCCCACCTCTTCC and GGAGATCCAGGGGTCTCTTC (intron 1 to exon 2).
ChIP
To prepare chromatin, 2 × 10⁷ BAL17 cells were washed twice with PBS and chromatin cross-linked by 1% formaldehyde exposure, followed by the addition of 0.125 m glycine to stop cross-linking. Cells were then washed twice with 10 ml of cold PBS and stored at −80 °C for subsequent processing. For processing, cell pellets were resuspended in 1 ml of ice-cold cell lysis buffer (5 mm PIPES (pH 8.0), 85 mm KCl, and 0.5% Nonidet P-40) supplemented with protease inhibitor mixture (Sigma). After centrifugation, the remaining nuclei were resuspended in 200 μl of ice-cold nuclear lysis buffer (50 mm Tris-Cl (pH 8.1), 10 mm EDTA, and 1% SDS) supplemented with protease inhibitor mixture. After a short incubation on ice, the sample volume was increased to 500 μl with ChIP dilution buffer (1% Triton X-100, 2 mm EDTA, 150 mm NaCl, and 20 mm Tris-HCl (pH 8.1)) supplemented with protease inhibitor mixture. Chromatin was sonicated with a Branson 350 Sonifier at a continuous setting of 2 for 10 cycles of 20 s each. After centrifugation, chromatin was precleared with protein A-Agarose (Santa Cruz Biotechnology), and the samples were diluted to 2 ml with ChIP dilution buffer and incubated overnight at 4 °C with protein A-agarose prelinked to various antibodies (see below). Thereafter, chromatin-agarose was washed with 1 ml of cold buffer containing 0.1% SDS, 1% Triton X-100, 2 mm EDTA, 20 mm Tris-Cl (pH 8), and 150 mm NaCl; with 1 ml of cold buffer containing 0.1% SDS, 1% Triton X-100, 2 mm EDTA, 20 mm Tris-Cl (pH 8), and 500 mm NaCl; with 1 ml of cold radioimmune precipitation assay buffer containing 50 mm HEPES (pH 7.6), 1 mm EDTA, 0.7% sodium deoxycholate, 1% Nonidet P-40, and 0.5 m LiCl; and twice with Tris/EDTA (pH 7.5). Chromatin was then eluted with 100 μl 1% SDS and 0.1 m NaHCO3 for 30 min at room temperature. Eluted chromatin and input DNA (5% of the pre-immunoprecipitation sample) were incubated for 15 h at 65 °C. DNA was purified using PureLink PCR purification kits (Invitrogen), treated with RNase mixture (Sigma), and quantified with the Qubit dsDNA HS system (Invitrogen). Samples were then analyzed by real-time PCR as described above. The following antibodies were used: 2 μg of rabbit anti-acetyl-histone 3 antibody (Upstate); 4 μg of rabbit anti-mouse RNA polymerase II (Pol II) polyclonal antibody N-20 (sc-899 X), 4 μg of mouse anti-phospho-Ser5 Pol II monoclonal antibody (sc-47701 X), 5 μg of rabbit anti-cyclin T1 antibody H-245 (sc-10750 X), and 5 μg of rabbit anti-Spt5 polyclonal antibody H-300 (sc-28678) (Santa Cruz Biotechnology); 2 μg of rabbit anti-H3K4me3 (histone 3, lysine 4 trimethylation) polyclonal antibody and 2 μg of rabbit anti-H3K36me3 polyclonal antibody (Abcam); and 5 μg of mouse anti-mouse U2AF65 monoclonal antibody (clone MC3, Sigma).
The ChIP primers used were as follows: fos−339, CCTTTACACAGGATGTCCATATTAGGA and CGTGTAGGATTTCGGAGATGGT; fos+116, GGCTTTCCCCAAACTTCGA and GCTACTGCAGCGGGAGGAT; fos+1016, CTGTCCGTCTCTAGTGCCAACTT and GAGACCAGAGTGGGCTGCA; fos+1694, CTCCTGAAGAGGAAGAGAAACG and GTGTATCTGTCAGCTCCCTCCT; and fos+2667, GGACCTTACCTGTTCGTGAAACA and TGAGGACTGGAGGCCAGATG.
RESULTS
Signal-induced mRNA Production
To analyze the signal-specific induction kinetics of c-fos mRNA in the BAL17 B cell line, we stimulated these cells either with P+I (Fig. 1A) or with anti-IgM (BCR) (Fig. 1B). In both experiments, the basal levels of c-fos mRNA were insignificant without induction (Fig. 1). However, as noted previously (9–11), the mRNA levels were induced sharply after 30 min of stimulation. Although BCR induced much greater c-fos expression compared with P+I stimulation, the mRNA levels were sharply decreased and were undetectable beyond 2 h, whereas significant levels of mRNA persisted for 4 h upon P+I stimulation. Importantly, similar kinetics and expression patterns were observed in freshly isolated murine splenic B cells. Although BCR induced c-fos mRNA with essentially identical kinetics as observed with the B cell line, LPS, which stimulates via TLR4 (Toll-like receptor-4) (19, 20), induced c-fos mRNA production with a slightly delayed kinetics reminiscent of the P+I induction observed with the B cell line (see Fig. 5A). Overall, these data agree with previous reports (9–11).
FIGURE 1.
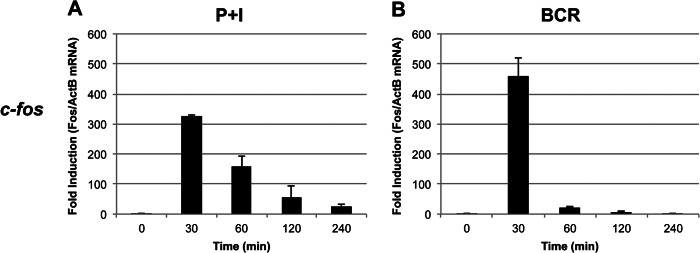
Induction of c-fos mRNA. BAL17 cells were induced either with P+I (A) or with antibody fragments against BCR (B) for the indicated times. Isolated total RNA was analyzed by real-time PCR with primers specific for c-fos and β-actin (ActB) as a control. Data were analyzed in triplicate and are expressed as the mean ± S.D. of the ratio of c-fos to β-actin (normalized to unstimulated cells). This experiment was repeated three times.
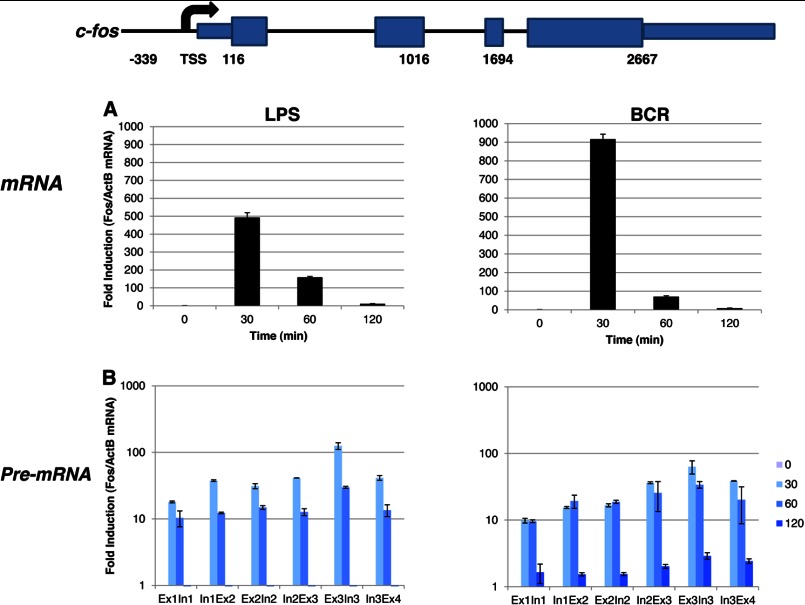
FIGURE 5.
Analyses of c-fos mRNA and pre-mRNA in primary splenic B cells. Primary resting B cells were isolated using negative selection against the activation marker CD43 and induced with either 25 μg/ml LPS or 10 μg/ml BCR. Isolated total mRNA was analyzed by real-time PCR with primers specific for c-fos mRNA (A) or pre-mRNA (B). β-Actin (ActB) was used as a normalization control. Data were analyzed in triplicate and are expressed as the mean ± S.D. of the ratio of fos to β-actin (normalized to unstimulated cells). The visualization of the c-fos data was with a logarithmic y axis. Ex, exon; In, intron.
Signal-induced Chromatin Changes
The rapid kinetics of PRGs is explained partly by their constitutively open chromatin architecture (16). Thus, PRGs show a high level of pre-existing H3K4me3 across the promoter region as well as H3K36me3 in the coding region. In addition, there is a dynamic turnover of histone acetylation by the action of histone acetyltransferases and histone deacetylases, which affects all K4me3-modified histone H3, which is also detectable in the absence of signaling (16, 17). Therefore, to further understand the signal-specific regulation of c-fos, we sought to analyze how the chromatin marks are altered upon induction of B cells with either P+I or BCR by employing ChIP assays.
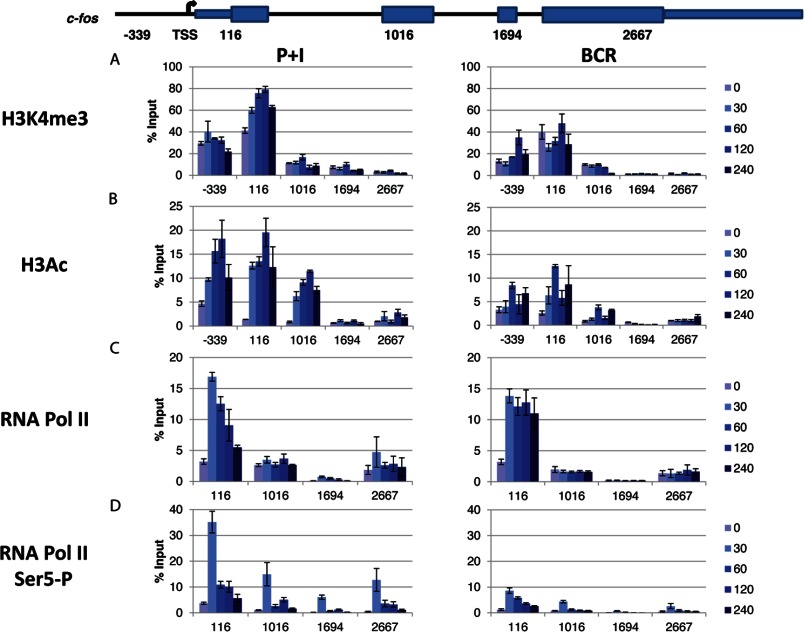
First, we looked at H3K4me3 throughout the gene (Fig. 2A) with an H3K4me3-specific antibody. As noted previously (16, 17), significant levels of constitutive H3K4me3 were observed. However, signal-induced enhancement of H3K4me3 was observed upon both stimulations and in a time-dependent manner. In accordance with H3K4me3 being predominantly associated with promoter activation, the highest signal was observed around the promoter region spanning the transcription start site (TSS) and dropped precipitously farther downstream and was barely detectable at the 3′-end of the gene (Fig. 2A). In addition to the H3K4me3 mark, significant levels of constitutive H3 acetylation (total) were also observed (Fig. 2B), and the signals were sharply enhanced upon both stimulations. Once again, the H3 acetylation signals were reduced drastically at downstream regions (Fig. 2). In summary, although minor differences were noted, no dramatic chromatin changes were observed in c-fos upon P+I versus BCR stimulation.
FIGURE 2.
Analyses of chromatin marks and Pol II. BAL17 cells were induced with either P+I or BCR for the indicated times in minutes. The recruitment of H3K4me3 (A) and total acetylated histone 3 (H3Ac; B) was measured by ChIP. Immunoprecipitated DNA was analyzed with primers targeting various segments of c-fos as indicated (positions are relative to the TSS depicted in the schematic). The samples were analyzed in triplicate and are reported as the mean ± S.D. of the percentage of input DNA. The data shown represent one of three comparable experiments. The levels of total Pol II (C) and Pol II phosphorylated at Ser5 of the C-terminal domain (Ser5-P; D) were measured by ChIP following stimulation with either P+I or BCR for the indicated times in minutes. Immunoprecipitated DNA was analyzed with primers targeting various segments of c-fos as indicated (positions are relative to the TSS depicted in the schematic). The samples were analyzed in triplicate, and the resulting data are reported as the mean ± S.D. of the percentage of input DNA. The data shown represent one of three comparable experiments.
Recruitment of Pol II
We subsequently analyzed the recruitment of Pol II at the c-fos gene upon P+I or BCR stimulation. Previous studies indicated that a transcriptional pausing/elongation block regulates many genes, including c-fos (21–25). Collectively, these studies suggest that in the basal/uninduced state, Pol II is engaged at the promoter-proximal region of these genes, pausing at ∼40 nucleotides downstream of the TSS. Mitogenic signals remove the elongation block and induce an elongation-competent complex that completes elongation and gene expression (22–24). In agreement with these observations, we noticed a significant level of total Pol II signal in the absence of any signaling (Fig. 2C). As expected, Pol II recruitment at the promoter region spanning the TSS and the first exon was greatly enhanced upon both types of signaling, and a noticeable amount of Pol II persisted in this region even at 4 h post-stimulation when mRNA was undetectable (Fig. 1). This was most apparent upon BCR stimulation (Fig. 2C, right panel). However, the Pol II density at downstream regions (particularly at exon 3, position 1694) was drastically reduced (Fig. 2C). Therefore, significant levels of Pol II persisted around the c-fos promoter region well after mRNA expression was extinguished. Interestingly, there appeared to be a low but above background level of Pol II accumulation at the 3′-end of the gene in both cases.
Because phosphorylation of the C-terminal domain of Pol II is associated with regulation of transcriptional initiation and elongation at many promoters (26, 27), we analyzed these events at the c-fos promoter (Fig. 2D). As observed previously for other PRGs (28, 29), an increase in phospho-Ser5 Pol II roughly paralleled the increase in total Pol II. Interestingly, significantly elevated signals were observed at 30 min for each of the exons tested (Fig. 2D), although P+I induction in general exhibited a much higher phospho-Ser5 Pol II signal compared with BCR induction. Therefore, active Pol II persists throughout the body of the c-fos gene, with the highest levels associated with the promoter region spanning the TSS. Phospho-Ser2 Pol II levels were not found to be significantly different between uninduced and induced conditions (data not shown).
Transcriptional Elongation at the c-fos Gene
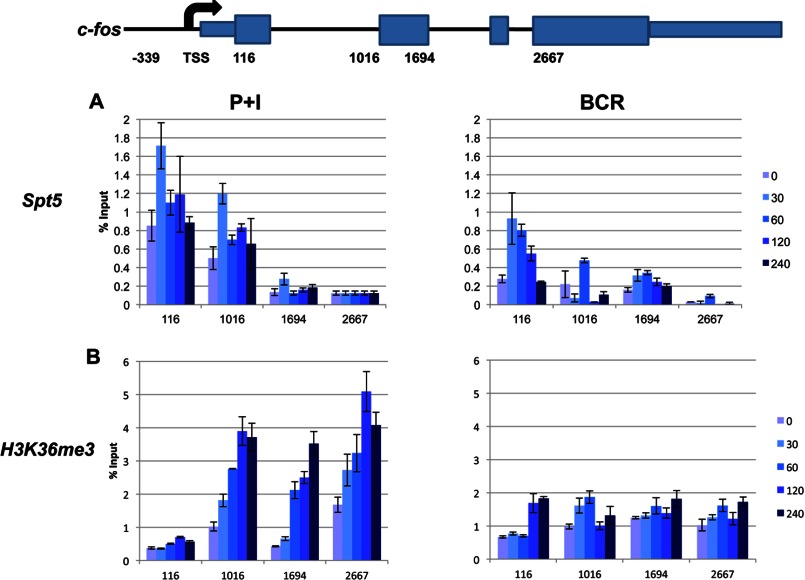
As noted previously, many of the PRGs are regulated at the level of transcriptional elongation (1, 25, 30). Given that we observed a significant level of Pol II persisting at the promoter, we tested whether the polymerases are associated with elongation factors. DSIF (DRB sensitivity-inducing factor) exerts dual regulatory effects by stably interacting with Pol II and recruiting various other factors to the Pol II elongation complex (31). DSIF is composed of Spt4 and Spt5 subunits, which were originally isolated in yeast by a genetic screen for regulators of transcription initiation sites (32, 33). Using an antibody against Spt5, we observed that it closely mirrored Pol II recruitment (Fig. 3A), suggesting that the polymerase is perhaps elongation-competent. A notable difference was observed at the 3′-end with very little Spt5 recruitment. However, given that Pol II is usually associated with Spt5 (31), the sensitivity of the anti-Spt5 antibody might not be high, and any signal at the 3′-end might be below the detection limit under our assay conditions. Once again, the highest recruitment of Spt5 was observed around the promoter region, and the general pattern of its recruitment in response to either signal was similar, with relatively minor differences (Fig. 3A).
FIGURE 3.
Analyses of transcriptional elongation. BAL17 cells were induced with either P+I or BCR for the indicated times in minutes, and the status of elongating Pol II was evaluated by ChIP. The recruitment of Spt5, a component of the elongation factor DSIF (A), and the levels of H3K36me3 (B) were analyzed. Immunoprecipitated DNA was analyzed with primers targeting various segments of c-fos as indicated (positions are relative to the TSS depicted in the schematic). The samples were analyzed in triplicate, and the resulting data are reported as the mean ± S.D. of the percentage of input DNA. The data shown represent one of three comparable experiments.
Because H3K36me3 is proportional to transcriptional activity (34), we also tested this particular histone mark in response to both P+I and BCR stimulation. Although P+I stimulation resulted in a marked increase in H3K36me3 in a time-dependent fashion across the entire gene, H3K36me3 levels due to BCR stimulation were much less pronounced (Fig. 3B). However, for both stimuli, the levels of H3K36me3 remained high even after 4 h across the entire gene (compare with Fig. 1), suggesting persistent transcriptional activity even after significant mRNA is undetectable.
Analysis of Pre-RNA and Splicing
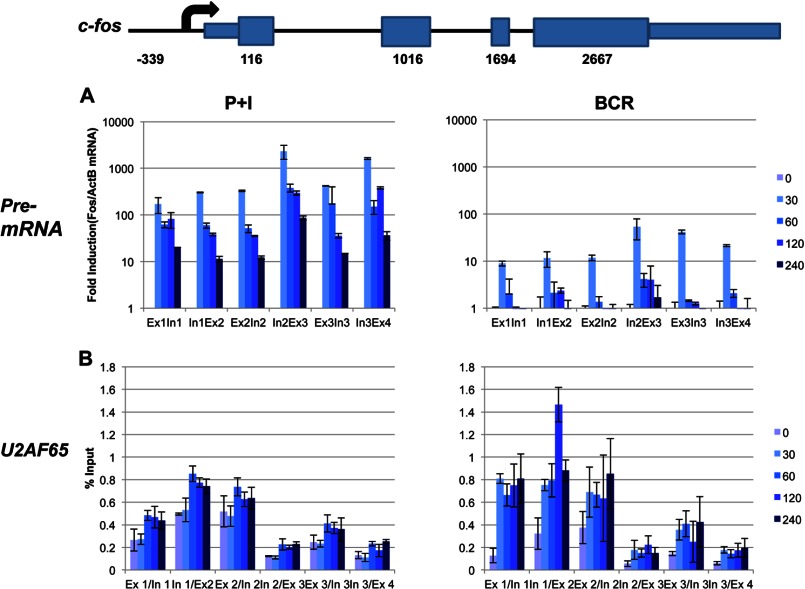
Several recent reports suggest that histone modifications may have a role in the regulation of splicing by modulating either the recruitment of the spliceosome or the Pol II elongation rate (34–36). Moreover, H3K36me3 affects alternative splicing decisions by modulating the recruitment of splicing regulators (35, 37). Thus, we analyzed the production of primary unspliced mRNA (pre-mRNA) across the c-fos gene in response to both stimulations. In agreement with our observation that H3K36me3 persisted across the entire gene (Fig. 3B), significant levels of pre-mRNA were detected even at 4 h (Fig. 4A), although the highest levels in both experiments were observed at the 30-min time point. Of note, we observed a precipitous drop in pre-mRNA at later time points across the gene in response to BCR compared with P+I stimulation (the -fold induction is reported here in log scale).
FIGURE 4.
Analyses of pre-mRNA and splicing. BAL17 cells were induced with either P+I or BCR for the indicated times in minutes. A, time-dependent production of long unspliced RNA was monitored by real-time PCR and is reported relative to β-actin (ActB) expression (normalized to unstimulated cells). The data are reported with a logarithmic y axis. B, association of the RNA splicing factor U2AF65 with c-fos was monitored by ChIP for the indicated times in minutes. Immunoprecipitated DNA was analyzed with primers spanning each of the exon (Ex)/intron (In) borders across the length of the c-fos gene (the exon/intron positions are relative to the TSS depicted in the schematic). The results were analyzed in triplicate and are reported as the mean ± S.D. of the percentage of input DNA. Data are representative of one of three comparable experiments.
Pre-mRNA splicing can occur co-transcriptionally, suggesting that splicing and transcription are mechanistically coupled (35, 37–39). Pre-mRNA splicing is an essential step in the expression of intron-containing genes and requires the assembly and activity of a spliceosome (37, 40). Because U2AF65 is a component of the spliceosome, we tested the recruitment of U2AF65 across the c-fos gene in response to both signals. U2AF65 was found to be constitutively associated with the c-fos gene, and its recruitment was enhanced upon both types of signaling (Fig. 4B). However, the increase in U2AF65 was most noticeable at later time points. As reported previously (37), the promoter region and downstream regions through to the intron 2/exon 2 region showed maximum recruitment of U2AF65, whereas farther downstream regions showed substantially less U2AF65 following mRNA expression kinetics. Thus, it seems that a significant portion of apparently full-length pre-RNA escapes splicing and persists when the mRNA ceases to exist.
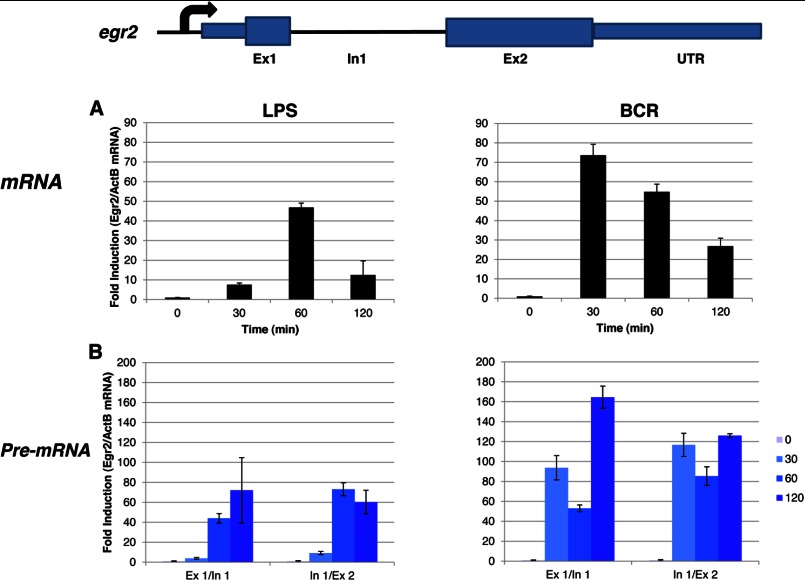
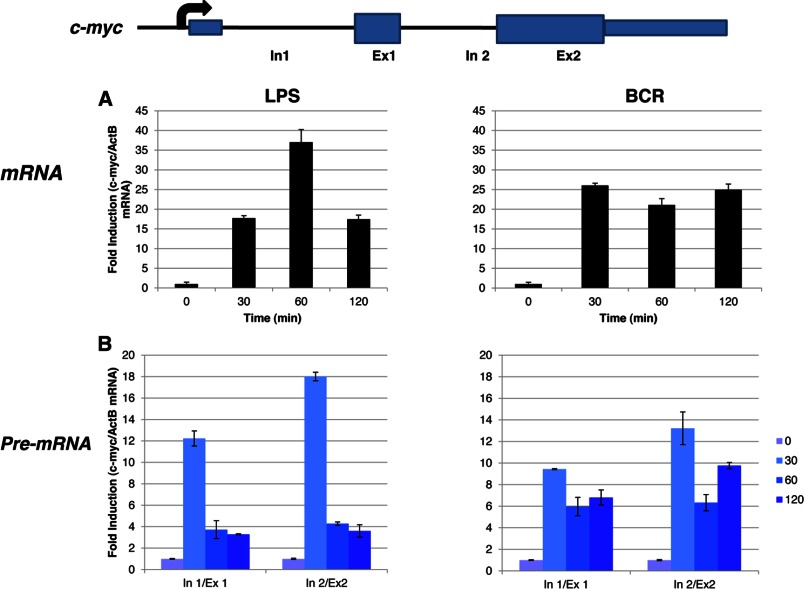
Importantly, a very similar pattern of mRNA production was also observed in splenic B cells in response to LPS and BCR signaling (Fig. 5A). Given that P+I represents an artificial stimulation, we instead used LPS in primary B cells as a proxy for innate immune signaling. Unfortunately, BAL17 cell lines do not appear to express TLR4, and thus, they did not respond to LPS (data not shown). Although the c-fos mRNA expression in these cells showed a sharp peak at ∼30 min, the pre-mRNA profile persisted for >2 h (Fig. 5, A and B). Next, we tested whether any other PRGs might behave in a similar fashion. Indeed, egr-2 exhibited a profile similar to c-fos: pre-mRNA expression was high even when mRNA production was severely reduced (Fig. 6, A and B). Importantly, not all PRGs are regulated similarly. Thus, in the case of c-myc, both mRNA and pre-mRNA expression appeared to follow similar patterns (Fig. 7, A and B).
FIGURE 6.
Analyses of egr-2 mRNA and pre-mRNA in primary splenic B cells. Primary B cells were isolated and stimulated as described in the legend to Fig. 5. Isolated total mRNA was analyzed by real-time PCR with primers specific for egr-2 mRNA (A) or pre-mRNA (B). β-Actin (ActB) was used as a normalization control. Ex, exon; In, intron.
FIGURE 7.
Analyses of c-myc mRNA and pre-mRNA in primary splenic B cells. Primary B cells were isolated and stimulated as described in the legend to Fig. 5. Isolated total mRNA was analyzed by real-time PCR with primers specific for c-myc mRNA (A) or pre-mRNA (B). β-Actin (ActB) was used as a normalization control. Ex, exon; In, intron.
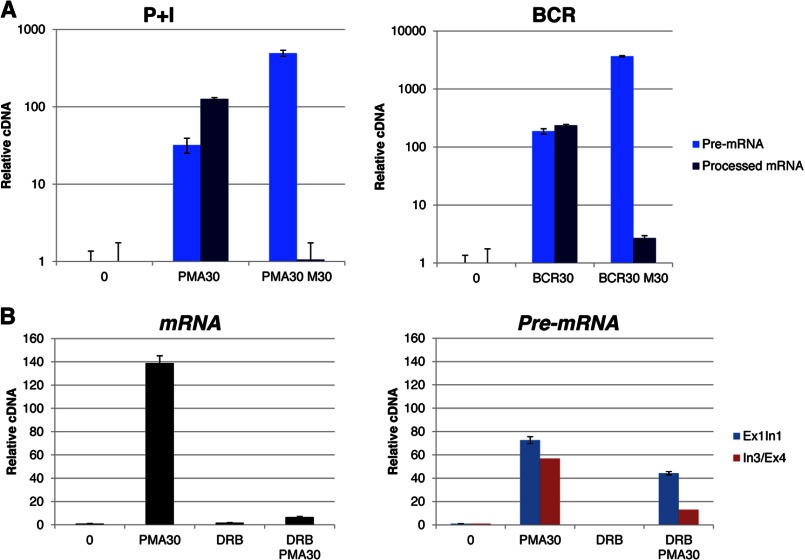
We analyzed the production of pre-mRNA by using primers specific for exon/intron junctions, which indicated that these are elongated transcripts and that the signals are not due to the production of short abortive transcripts. To further confirm our results, we also tested the effects of the splicing inhibitor meayamycin (18, 35) on both mRNA and pre-mRNA production. As expected, meayamycin drastically inhibited the production of spliced mRNA in response to both P+I and BCR, whereas it did not inhibit the production of unspliced pre-mRNA (Fig. 8A). In fact, meayamycin enhanced production of pre-mRNA in both experiments. Finally, we evaluated these pre-mRNA transcripts in the presence of DRB, which is a nucleoside analog that inhibits Pol II transcription (31). In the presence of DRB, synthesis of pre-mRNAs and mRNAs is strongly inhibited (31). Consistent with these observations, mRNA and pre-mRNA production was significantly inhibited in the presence of DRB (Fig. 8B). Interestingly, the production of mRNA was more dramatically reduced compared with that of pre-mRNA in the presence of the same concentration of DRB, indicating that a portion of the detectable pre-mRNA pool could perhaps represent short transcripts. Taken together, these results indicate that although the spliced c-fos mRNAs are produced following known kinetics and are rapidly extinguished between 30 and 60 min post-stimulation, production of unspliced transcripts continues long after this time point. Thus, the c-fos gene (and other PRGs, e.g. egr-2) is persistently transcribed, and at least a significant portion of transcription of these genes might be uncoupled from splicing, a phenomenon recently observed by Smale and co-workers (41).
FIGURE 8.
Analyses of mRNA versus pre-mRNA. A, to detect BAL17 c-fos pre-mRNA, primers spanning two different exon (Ex)/intron (In) junctions (exon 1/intron 1 and intron 3/exon 4) were employed, and the results are reported as relative cDNA. BAL17 cells were preincubated for 30 min with the splicing inhibitor meayamycin (M30) at a concentration of 10 nm prior to induction with phorbol 12-myristate 13-acetate (PMA30) or BCR for 30 min. Primers targeting c-fos mRNA were used to report total transcripts, whereas primers consisting of 5′ c-fos+1016 (exon 2) and 3′ c-fos+1694 (exon 3) were employed to monitor spliced c-fos pre-mRNA transcripts. Real-time PCR analysis was performed in triplicate, and the results were normalized to unstimulated cells. B, BAL17 cells were preincubated for 10 min with 100 μm DRB, followed by induction with P+I for 30 min. Isolated total mRNA was analyzed in triplicate by real-time PCR with primers specific for c-fos mRNA. As both meayamycin and DRB treatment affected the levels of β-actin mRNA, data are expressed relative to the amount of starting cDNA in the real-time PCR by dividing the starting amount of DNA by the inverse log of the number of cycles required to reach threshold: ng of cDNA/(POWER(2,Ct)). Data were normalized to unstimulated cells and expressed as the mean ± S.D. of triplicate analyses.
DISCUSSION
Post-embryonic cells, in a non-proliferating quiescent state (G0), require mitogenic signaling to drive them into cell cycle entry (G1). A characteristic of G0 cells stimulated with growth factors is the induction of PRGs that are often turned on within minutes after stimulation (8). Because of such rapid kinetics of PRG induction, it has always been a challenge to interrogate the changes in the chromatin landscape of these genes in the absence and presence of signaling. Chen and Allfrey (15) were the first to provide a correlation between alterations in chromatin architecture, histone acetylation, and PRG (c-fos and c-myc) transcription. Since then, numerous studies have addressed specific chromatin changes in eukaryotic genes, including PRGs (42–45). Although the mRNA-encoding PRGs usually constitute ∼1% of the total message in the growing cell, they are necessary to drive cells to re-enter the cell cycle (1). However, given that many PRGs are proto-oncogenes, whose sustained expression can have profound effects on cellular growth, the regulation of PRG expression in response to inductive signals is very tightly regulated at multiple levels, including transcriptional initiation and elongation and co-transcriptional and post-transcriptional events (1, 8).
c-fos is one such PRG whose rapid but transient expression is associated with cellular proliferation (8, 15). Stimulation of mature B cells with anti-Ig promotes transition from the resting G0 state into the G1 phase of the cell cycle and rapidly induces mRNA expression of a set of genes, including c-fos, egr-1, egr-2, c-myc, and junB (9–11). Because induction of c-fos transcription is one of the early hallmarks of B cell activation, studying c-fos epigenetic and transcriptional regulation might provide mechanistic insights to early events during B cell activation (11, 46). Toward this goal, we undertook a detailed study of c-fos regulation in response to a strong but generic signal (P+I) as well as a weaker but highly B cell-specific signal (anti-Ig/BCR). Consistent with previous studies (9–11), P+I stimulation led to the production of steady-state mRNA that persisted for up to 4 h, suggesting a more sustained response. In comparison, BCR produced a more robust signal but sharply defined mRNA peak at ∼30 min (Fig. 1), indicating a more transient signaling event. Although the precise mechanistic basis for this difference is unclear at present, it has been noted that different signals produce different extents of antisense transcription from the c-fos locus in murine B cells (10). Because we measured only total steady-state RNA, whether our assay conditions also reflect such a difference or possible transcription originating from the 3′-end is unclear at present.
The chromatin marks that we tested did not reveal any significant distinctions between the two signals. Consistent with previous studies, c-fos exhibited substantial pre-existing H3K4me3 as well as total acetylated histone 3 marks (Fig. 2, A and B). In both cases, the marks were higher around the promoter region spanning the TSS and significantly trailed off at the 3′-end. However, both marks were significantly higher in response to P+I than BCR, suggesting that P+I stimulation results in a more open chromatin structure. Similar to prolonged mRNA production, these marks also persisted longer with P+I stimulation than with BCR stimulation.
Consistent with the mRNA production and activating histone marks, the total Pol II recruitment was slightly higher, especially around the promoter region, in response to P+I (Fig. 2C). Although the recruitment of Pol II to the promoter region was substantially reduced in a time-dependent fashion in response to P+I, it remained high in response to BCR stimulation. Interestingly, despite the fact that the Pol II recruitment was reduced at downstream regions, it was still noticeable at the 3′-end particularly in response to P+I. This was most apparent when the Ser5-phosphorylated form of Pol II was assayed (Fig. 2D). In general, the Ser5-phosphorylated form of Pol II exhibited much higher signal in response to P+I compared with BCR. It is known that phospho-Ser5 Pol II levels remain high as Pol II transcribes the first few hundred nucleotides of genes but decline farther downstream (26, 27). As Pol II elongates farther downstream, the levels of phospho-Ser5 Pol II drop, and phospho-Ser2 Pol II levels increase. However, lower levels of phospho-Ser5 Pol II do persist throughout elongation (27). Consistent with an enhanced recruitment of Pol II at the 3′-end as well as persistent mRNA production in response to P+I, the phospho-Ser5 Pol II levels also showed a spike at the 3′-end, indicating persistence of active Pol II at downstream regions. Given that the ChIP signals of acetylated histone 3 as well as Pol II and phospho-Ser5 Pol II appear in general to be lower at exon 3 than at exon 4, there might be another transcript detected at exon 4 (such as an overlapping transcript).
As a marker for transcriptional elongation, we analyzed recruitment of Spt5 as well as enrichment of the H3K36me3 histone mark. Not surprisingly, Spt5 recruitment in general tracked that of Pol II in response to both signals, although the total Spt5 recruitment was slightly higher in response to P+I, particularly at the 5′-end of the gene (Fig. 3A). However, given that the ChIP signals were relatively low with anti-Spt5 antibody, we suspect that the sensitivity of this antibody is low and that any signal at the 3′-end is below the detection limit. Although H3K4me3 is high near promoters, H3K36me3 marks are high along transcribed regions (42–45). Consistent with its association with transcribed regions, indicating elongating Pol II, H3K36me3 marks were higher at the downstream regions, especially in response to P+I (Fig. 3B). Interestingly, the signals were higher at later time points at most regions tested in response to P+I. The H3K36me3 signals persisted throughout the transcribed regions in response to BCR and remained relatively unchanged (Fig. 3B). Because these experiments indicated that transcriptional elongation persisted beyond 30 min time when the mRNA signal was highest, we tested whether long (and presumably full-length) pre-mRNA transcripts were being generated. Indeed, long pre-mRNA transcripts were detected in response to both signals (Fig. 4A). Surprisingly, no pre-mRNA transcripts were detected in the absence of any signaling, although a noticeable amount of Pol II was associated with the c-fos gene under these conditions. Robust levels of pre-mRNAs were detected post-signaling at both the 5′- and 3′-ends up to 4 h in response to P+I. In contrast, BCR signaling generated pre-mRNAs primarily at 30 min, which coincided with mRNA production, although a low level was also detected at later time points. That c-fos pre-mRNAs are indeed produced in response to BCR stimulation at later time points is better illustrated when analyzed in primary splenic B cells (Fig. 5B). In addition to c-fos, egr-2 pre-mRNA expression also persisted at later time points when the mRNA expression was severely reduced (Fig. 6, A and B). Although the c-fos kinetics was sharper compared with egr-2 (Fig. 6), this is not unexpected, given that c-fos is one of the most rapidly and tightly regulated genes. Moreover, the total levels of both mRNA and pre-mRNA were much higher for c-fos than observed for egr-2. Our preliminary RNA-Seq results performed under identical conditions also suggest that several PRGs are indeed regulated in a similar fashion (data not shown). We also showed that not all PRGs were regulated in a similar fashion, as exemplified by c-myc (Fig. 7). This is not totally unexpected given that c-myc plays a crucial role in B cells and that deregulation in myc is associated with lymphoid malignancies (2–5). Nevertheless, although this regulatory step is not observed in all PRGs, it is clear that significant transcription continues for hours for some PRGs when mRNA production is sharply reduced.
Because PRGs can be regulated at the level of splicing (28) and because pre-mRNA splicing can occur co-transcriptionally (35–40), we tested the recruitment of the important spliceosome factor U2AF65 in response to both signals. Surprisingly, the recruitment of U2AF65 was not substantially enhanced after 30 min of stimulation with P+I but was enhanced in response to BCR (Fig. 4B). Moreover, U2AF65 recruitment was observed at 4 h post-stimulation in response to both stimuli. However, recruitment of U2AF65 was substantially reduced almost to the background level at downstream regions. If U2AF65 recruitment is indicative of splicing activity, our results suggest that although a significant level of transcription persists after mRNA subsides (particularly in response to P+I stimulation), a proportion of these transcripts escape splicing. In a recent elegant study, Smale and co-workers (41) show by employing high-resolution deep sequencing that full-length yet incompletely spliced transcripts accumulate in macrophages in response to LPS stimulation, suggesting that splicing often occurs after transcription has been completed, with transcripts retained on the chromatin until fully spliced. Although we did not determine whether the pre-mRNAs we observed were indeed full-length, they were sensitive to DRB (Fig. 8B), thereby indicating that they require elongating Pol II. Moreover, unlike mRNAs, pre-mRNAs were insensitive to the splicing inhibitor meayamycin (Fig. 8A). Although the increase in pre-mRNA production in the presence of meayamycin could be directly at the expense of mRNA production, it remains to be proven.
In summary, our results suggest that regulation of c-fos (and perhaps other PRGs) in B cells occurs at multiple levels, including transcription, splicing, and message stability. They also show that depending on the nature of the stimulus, the locus can remain more active (exhibiting activating histone marks as well as engaging elongating Pol II) well after the functional effects (in this case, mRNA production) of the stimulus are extinguished. Thus, the mitogenic stimulus appears to be stronger transcriptionally, but the maximum transcript levels are determined post-transcriptionally. So the fact that P+I produces more pre-mRNA at later time points might reflect that there is also detectable mRNA at these times. Hence, the mRNA levels are proportional to the amount of pre-mRNAs but only up to some maximum levels (threshold effects). Accordingly, it remains possible that a significant portion of the c-fos mRNA under our experimental conditions was produced concomitant with pre-mRNA but that they were rapidly degraded at later time points. All together, our results might explain the deleterious effects of mitogenic and/or tumor-promoting signals, which can lead to prolonged locus opening and aberrant transcription and splicing. In this regard, it is interesting to note that splicing factor mutations have recently been found in several hematological malignancies (46). Future studies will indicate the precise regulatory steps and signaling intermediates involved in regulation of PRGs in response to antigenic and mitogenic signals in B cells.
Acknowledgment
We thank Dr. Ranjan Sen for valuable discussions and critically reading the manuscript.
This work was supported, in whole or in part, by National Institutes of Health Grant AI079206 (to A. L. R.). This work was also supported by American Heart Association Grant 12GRNT12180023 (to A. L. R.).
- BCR
- B cell receptor
- PRG
- primary response gene
- P+I
- phorbol 12-myristate 13-acetate + ionomycin
- DRB
- 5,6-dichloro-1-β-d-ribofuranosyl-1H-benzimidazole
- Pol II
- RNA polymerase II
- TSS
- transcription start site.
REFERENCES
- 1. Fowler T., Sen R., Roy A. L. (2011) Regulation of primary response genes. Mol. Cell 44, 348–360 [DOI] [PMC free article] [PubMed] [Google Scholar]
- 2. Kurosaki T., Shinohara H., Baba Y. (2010) B cell signaling and fate decision. Annu. Rev. Immunol. 28, 21–55 [DOI] [PubMed] [Google Scholar]
- 3. Richards S., Watanabe C., Santos L., Craxton A., Clark E. A. (2008) Regulation of B-cell entry into the cell cycle. Immunol. Rev. 224, 183–200 [DOI] [PMC free article] [PubMed] [Google Scholar]
- 4. Herzog S., Reth M., Jumaa H. (2009) Regulation of B-cell proliferation and differentiation by pre-B-cell receptor signalling. Nat. Rev. Immunol. 9, 195–205 [DOI] [PubMed] [Google Scholar]
- 5. Damdinsuren B., Zhang Y., Khalil A., Wood W. H., 3rd, Becker K. G., Shlomchik M. J., Sen R. (2010) Single round of antigen receptor signaling programs naive B cells to receive T cell help. Immunity 32, 355–366 [DOI] [PMC free article] [PubMed] [Google Scholar]
- 6. Galbraith M. D., Espinosa J. M. (2011) Lessons on transcriptional control from the serum response network. Curr. Opin. Genet. Dev. 21, 160–166 [DOI] [PMC free article] [PubMed] [Google Scholar]
- 7. Glauser D. A., Schlegel W. (2006) Mechanisms of transcriptional regulation underlying temporal integration of signals. Nucleic Acids Res. 34, 5175–5183 [DOI] [PMC free article] [PubMed] [Google Scholar]
- 8. Herschman H. R. (1991) Primary response genes induced by growth factors and tumor promoters. Annu. Rev. Biochem. 60, 281–319 [DOI] [PubMed] [Google Scholar]
- 9. Huo L., Rothstein T. L. (1995) Receptor-specific induction of individual AP-1 components in B lymphocytes. J. Immunol. 154, 3300–3309 [PubMed] [Google Scholar]
- 10. Klemsz M. J., Justement L. B., Palmer E., Cambier J. C. (1989) Induction of c-fos and c-myc expression during B cell activation by IL-4 and immunoglobulin binding ligands. J. Immunol. 143, 1032–1039 [PubMed] [Google Scholar]
- 11. Mittelstadt P. R., DeFranco A. L. (1993) Induction of early response genes by cross-linking membrane Ig on B lymphocytes. J. Immunol. 150, 4822–4832 [PubMed] [Google Scholar]
- 12. Monroe J. G., Kass M. J. (1985) Molecular events in B cell activation. I. Signals required to stimulate G0 to G1 transition of resting B lymphocytes. J. Immunol. 135, 1674–1682 [PubMed] [Google Scholar]
- 13. Gururajan M., Simmons A., Dasu T., Spear B. T., Calulot C., Robertson D. A., Wiest D. L., Monroe J. G., Bondada S. (2008) Early growth response genes regulate B cell development, proliferation, and immune response. J. Immunol. 181, 4590–4602 [DOI] [PMC free article] [PubMed] [Google Scholar]
- 14. Thompson C. B., Humphries E. H., Carlson L. M., Chen C. L., Neiman P. E. (1987) The effect of alterations in myc gene expression on B cell development in the bursa of Fabricius. Cell 51, 371–381 [DOI] [PubMed] [Google Scholar]
- 15. Chen T. A., Allfrey V. G. (1987) Rapid and reversible changes in nucleosome structure accompany the activation, repression, and superinduction of murine fibroblast protooncogenes c-fos and c-myc. Proc. Natl. Acad. Sci. U.S.A. 84, 5252–5256 [DOI] [PMC free article] [PubMed] [Google Scholar]
- 16. Clayton A. L., Hazzalin C. A., Mahadevan L. C. (2006) Enhanced histone acetylation and transcription: a dynamic perspective. Mol. Cell 23, 289–296 [DOI] [PubMed] [Google Scholar]
- 17. Edmunds J. W., Mahadevan L. C., Clayton A. L. (2008) Dynamic histone H3 methylation during gene induction: HYPB/Setd2 mediates all H3K36 trimethylation. EMBO J. 27, 406–420 [DOI] [PMC free article] [PubMed] [Google Scholar]
- 18. Albert B. J., McPherson P. A., O'Brien K., Czaicki N. L., Destefino V., Osman S., Li M., Day B. W., Grabowski P. J., Moore M. J., Vogt A., Koide K. (2009) Meayamycin inhibits pre-messenger RNA splicing and exhibits picomolar activity against multidrug-resistant cells. Mol. Cancer Ther. 8, 2308–2318 [DOI] [PMC free article] [PubMed] [Google Scholar]
- 19. Doyle S. L., O'Neill L. A. (2006) Toll-like receptors: from the discovery of NFκB to new insights into transcriptional regulations in innate immunity. Biochem. Pharmacol. 72, 1102–1113 [DOI] [PubMed] [Google Scholar]
- 20. Lim K. H., Staudt L. M. (2013) Toll-like receptor signaling. Cold Spring Harb. Perspect. Biol. 5, a011247. [DOI] [PMC free article] [PubMed] [Google Scholar]
- 21. Adelman K., Lis J. T. (2012) Promoter-proximal pausing of RNA polymerase II: emerging roles in metazoans. Nat. Rev. Genet. 13, 720–731 [DOI] [PMC free article] [PubMed] [Google Scholar]
- 22. Collart M. A., Tourkine N., Belin D., Vassalli P., Jeanteur P., Blanchard J. M. (1991) c-fos gene transcription in murine macrophages is modulated by a calcium-dependent block to elongation in intron 1. Mol. Cell. Biol. 11, 2826–2831 [DOI] [PMC free article] [PubMed] [Google Scholar]
- 23. Fivaz J., Bassi M. C., Pinaud S., Mirkovitch J. (2000) RNA polymerase II promoter-proximal pausing upregulates c-fos gene expression. Gene 255, 185–194 [DOI] [PubMed] [Google Scholar]
- 24. Pinaud S., Mirkovitch J. (1998) Regulation of c-fos expression by RNA polymerase elongation competence. J. Mol. Biol. 280, 785–798 [DOI] [PubMed] [Google Scholar]
- 25. Sims R. J., 3rd, Belotserkovskaya R., Reinberg D. (2004) Elongation by RNA polymerase II: the short and long of it. Genes Dev. 18, 2437–2468 [DOI] [PubMed] [Google Scholar]
- 26. Buratowski S. (2003) The CTD code. Nat. Struct. Biol. 10, 679–680 [DOI] [PubMed] [Google Scholar]
- 27. Buratowski S. (2009) Progression through the RNA polymerase II CTD cycle. Mol. Cell 36, 541–546 [DOI] [PMC free article] [PubMed] [Google Scholar]
- 28. Hargreaves D. C., Horng T., Medzhitov R. (2009) Control of inducible gene expression by signal-dependent transcriptional elongation. Cell 138, 129–145 [DOI] [PMC free article] [PubMed] [Google Scholar]
- 29. Ramirez-Carrozzi V. R., Braas D., Bhatt D. M., Cheng C. S., Hong C., Doty K. R., Black J. C., Hoffmann A., Carey M., Smale S. T. (2009) A unifying model for the selective regulation of inducible transcription by CpG islands and nucleosome remodeling. Cell 138, 114–128 [DOI] [PMC free article] [PubMed] [Google Scholar]
- 30. Core L. J., Lis J. T. (2008) Transcription regulation through promoter-proximal pausing of RNA polymerase II. Science 319, 1791–1792 [DOI] [PMC free article] [PubMed] [Google Scholar]
- 31. Chiba K., Yamamoto J., Yamaguchi Y., Handa H. (2010) Promoter-proximal pausing and its release: molecular mechanisms and physiological functions. Exp. Cell Res. 316, 2723–2730 [DOI] [PubMed] [Google Scholar]
- 32. Hartzog G. A., Basrai M. A., Ricupero-Hovasse S. L., Hieter P., Winston F. (1996) Identification and analysis of a functional human homolog of the SPT4 gene of Saccharomyces cerevisiae. Mol. Cell. Biol. 16, 2848–2856 [DOI] [PMC free article] [PubMed] [Google Scholar]
- 33. Wada T., Takagi T., Yamaguchi Y., Ferdous A., Imai T., Hirose S., Sugimoto S., Yano K., Hartzog G. A., Winston F., Buratowski S., Handa H. (1998) DSIF, a novel transcription elongation factor that regulates RNA polymerase II processivity, is composed of human Spt4 and Spt5 homologs. Genes Dev. 12, 343–356 [DOI] [PMC free article] [PubMed] [Google Scholar]
- 34. Sims R. J., 3rd, Reinberg D. (2009) Processing the H3K36me3 signature. Nat. Genet. 41, 270–271 [DOI] [PubMed] [Google Scholar]
- 35. de Almeida S. F., Grosso A. R., Koch F., Fenouil R., Carvalho S., Andrade J., Levezinho H., Gut M., Eick D., Gut I., Andrau J. C., Ferrier P., Carmo-Fonseca M. (2011) Splicing enhances recruitment of methyltransferase HYPB/Setd2 and methylation of histone H3 Lys36. Nat. Struct. Mol. Biol. 18, 977–983 [DOI] [PubMed] [Google Scholar]
- 36. Kim S., Kim H., Fong N., Erickson B., Bentley D. L. (2011) Pre-mRNA splicing is a determinant of histone H3K36 methylation. Proc. Natl. Acad. Sci. U.S.A. 108, 13564–13569 [DOI] [PMC free article] [PubMed] [Google Scholar]
- 37. Listerman I., Sapra A. K., Neugebauer K. M. (2006) Cotranscriptional coupling of splicing factor recruitment and precursor messenger RNA splicing in mammalian cells. Nat. Struct. Mol. Biol. 13, 815–822 [DOI] [PubMed] [Google Scholar]
- 38. Bentley D. L. (2005) Rules of engagement: co-transcriptional recruitment of pre-mRNA processing factors. Curr. Opin. Cell Biol. 17, 251–256 [DOI] [PubMed] [Google Scholar]
- 39. David C. J., Boyne A. R., Millhouse S. R., Manley J. L. (2011) The RNA polymerase II C-terminal domain promotes splicing activation through recruitment of a U2AF65-Prp19 complex. Genes Dev. 25, 972–983 [DOI] [PMC free article] [PubMed] [Google Scholar]
- 40. Jurica M. S., Moore M. J. (2003) Pre-mRNA splicing: awash in a sea of proteins. Mol. Cell 12, 5–14 [DOI] [PubMed] [Google Scholar]
- 41. Bhatt D. M., Pandya-Jones A., Tong A. J., Barozzi I., Lissner M. M., Natoli G., Black D. L., Smale S. T. (2012) Transcript dynamics of proinflammatory genes revealed by sequence analysis of subcellular RNA fractions. Cell 150, 279–290 [DOI] [PMC free article] [PubMed] [Google Scholar]
- 42. Black J. C., Van Rechem C., Whetstine J. R. (2012) Histone lysine methylation dynamics: establishment, regulation, and biological impact. Mol. Cell 48, 491–507 [DOI] [PMC free article] [PubMed] [Google Scholar]
- 43. Lee J. S., Smith E., Shilatifard A. (2010) The language of histone crosstalk. Cell 142, 682–685 [DOI] [PMC free article] [PubMed] [Google Scholar]
- 44. Rando O. J. (2012) Combinatorial complexity in chromatin structure and function: revisiting the histone code. Curr. Opin. Genet. Dev. 22, 148–155 [DOI] [PMC free article] [PubMed] [Google Scholar]
- 45. Suganuma T., Workman J. L. (2011) Signals and combinatorial functions of histone modifications. Annu. Rev. Biochem. 80, 473–499 [DOI] [PubMed] [Google Scholar]
- 46. Maciejewski J. P., Padgett R. A. (2012) Defects in spliceosomal machinery: a new pathway of leukaemogenesis. Br. J. Haematol. 158, 165–173 [DOI] [PMC free article] [PubMed] [Google Scholar]


