Abstract
Systematic toxicological study is still required to fully understand the hazard potentials of gold nanoparticles (AuNPs). Because their biomedical applications are rapidly evolving, we investigated developmental toxicity of AuNPs in an in vivo embryonic zebrafish model at exposure concentration ranges from 0.08 to 50mg/l. Exposure of zebrafish embryos to 1.3nm AuNPs functionalized with a cationic ligand, N,N,N-trimethylammoniumethanethiol (TMAT-AuNPs), resulted in smaller malpigmented eyes. We determined that TMAT-AuNPs caused a significant increase of cell death in the eye, which was correlated with an increase in gene expression of p53 and bax. Expression patterns of key transcription factors regulating eye development (pax6a, pax6b, otx2, and rx1) and pigmentation (sox10) were both repressed in a concentration-dependent manner in embryos exposed to TMAT-AuNPs. Reduced spatial localization of pax6a, rx1, sox10, and mitfa was observed in embryos by whole-mount in situ hybridization. The swimming behavior of embryos exposed to sublethal concentrations of TMAT-AuNPs showed hypoactivity, and embryos exhibited axonal growth inhibition. Overall, these results demonstrated that TMAT-AuNPs disrupt the progression of eye development and pigmentation that continues to behavioral and neuronal damage in the developing zebrafish.
Key Words: eye defect, pigmentation, gold nanoparticles, behavior, neuronal toxicity, zebrafish.
Gold nanoparticles (AuNPs) exhibit unique optical and electrical properties which are of great interest for drug delivery, cellular imaging, diagnostics, and therapeutic agents (Giljohann et al., 2010; Murphy et al., 2008). The size, shape, and surface chemistry of AuNPs can be widely and systematically tuned for various biomedical applications. There have been concerns about the potential for human health hazard from AuNPs because of their ability to penetrate and translocate in biological compartments. As with any new pharmaceutical or other health technology, it is imperative to understand the full scope of AuNP biocompatibility and to ensure that hazard potential is minimized (Giljohann et al., 2010; Murphy et al., 2008).
Studies in vitro have demonstrated that AuNPs induce cellular toxicity through oxidative stress (Pan et al., 2009), disruption to cell membranes (Lin et al., 2010), inflammation (Bartneck et al., 2010), and DNA damage (Schaeublin et al., 2011), all of which depend upon size, shape, and surface chemistry of the AuNPs. Surface chemistry plays a crucial role in determining toxicity of AuNPs (Goodman et al., 2004; Hauck et al., 2008; Lin et al., 2010). The negative charge of the cell membrane appears to facilitate internalization, and possibly the toxicity, of positively charged AuNPs over negatively and neutrally charged AuNPs (Goodman et al., 2004; Lin et al., 2010). But, uptake may be less dependent on surface charge in long-term exposure (Bartneck et al., 2010) where the uptake of positively charged AuNPs can be less than that of negatively charged AuNPs (Schaeublin et al., 2011). Though little has emerged from in vitro studies in the way of predictive structure-toxicity profiles for AuNPs, knowledge of toxicity mechanisms and targets has been gained. Compared with the accumulating in vitro toxicity data available, relatively few in vivo toxicological studies have been conducted on AuNPs. And, although both approaches are necessary for a comprehensive AuNP safety assessment, we believe that in vivo model observations will ultimately be more predictive of hazard potential for humans.
The developing zebrafish (Danio rerio) is an established model for in vivo toxicity testing, offering the efficiency to identify toxicity mechanisms (Hill et al., 2005). Zebrafish are small and highly fecund, and they develop quickly. An added benefit is that development is entirely external, and the developing embryos are transparent. Chemically induced malformations in the brain, jaw, eye, heart, yolk sac, notochord, trunk, and tail are directly observable under a dissecting microscope. Only small quantities of test material are required for developmental exposure of zebrafish, a big advantage for compounds under development, for which sample quantity available for testing may be limited to only a few milligrams. Developmental toxicity assays in zebrafish have also been successfully automated for high throughput (Mandrell et al., 2012). As a consequence of these advantages, toxicity mechanisms of nanoparticles (NPs) and other chemicals can be pursued more rapidly in zebrafish than any other vertebrate model. Research investigating how NPs and other new chemicals affect zebrafish development is both efficient in the zebrafish model and more translatable to human biology (Parng, 2005) than in vitro approaches.
In a previous study, we demonstrated the suitability of the embryonic zebrafish as a rapid model to probe the effects of multivariate physicochemical properties of AuNPs on biological responses (Harper et al., 2011). In that study, we examined the role of surface charge and size on toxicity and found that the surface functionalization dictated toxicity outcomes with embryos. Specifically, we found that AuNPs (0.8–1.6nm) functionalized with a monolayer of the cationic ligand, N,N,N-trimethylammoniumethanethiol (TMAT), were the most developmentally toxic, causing embryo lethality and numerous morphological effects. We observed a distinctive malformation in which embryos exposed to TMAT-AuNPs consistently developed eyes that were pale gray, rather than black, and smaller than normal. The objective of this study was to explore the mechanism underlying this difference in eye development. We evaluated apoptotic patterns and the expressions of putative transcription factors involved in apoptosis, eye embryogenesis, and pigmentation. We also tested simple photomotor behavior responses of larvae exposed to TMAT-AuNPs to determine whether the central nervous system (CNS) was affected, and axon morphology was examined for TMAT-AuNP-induced damage.
MATERIALS AND METHODS
Chemicals.
Hydrogen tetrachloroaurate (HAuCl4·H2O) was purchased from Strem (Newburyport, MA) and was used as received. Dichloromethane was purchased from Mallinckrodt Chemicals (St Louis, MO). Thiocholine (TMAT) trifluoroacetate was synthesized according to known procedures with some modifications (Supplementary data) (Warner and Hutchison, 2003). All other compounds were purchased from Sigma-Aldrich (St Louis, MO) and used as received. Nanopure water (18.2 MΩ·cm resistivity) was prepared with a Barnstead Nanopure filtration system and used for all aqueous samples. Polyethersulfone diafiltration membranes Omega TI10K were obtained from Pall Life Sciences (Port Washington, NY). Carboxylic acid–functionalized SMART grids for transmission electron microscopy (TEM) imaging were purchased from Dune Sciences.
TMAT-AuNP synthesis and characterization
Water-soluble, TMAT-stabilized AuNPs were prepared through interfacial ligand exchange reaction between triphenylphosphine-stabilized AuNPs (Au101(PPh3)21Cl5) dissolved in dichloromethane with thiocholine trifluoroacetate in water using a published procedure (Woehrle et al., 2005). Briefly, a solution of 60mg of Au101(PPh)21Cl5 in 20ml of dichloromethane was added to a solution of 35mg of thiocholine trifluoroacetate in 25ml water. Prior to use, the thiocholine trifluoroacetate solution was passed through a poly(4-vinylpyridine) column to remove any residual acid contaminants. The biphasic reaction mixture was stirred rapidly at room temperature (RT) for 23h. The reaction was complete when dark-colored NPs were transferred from the organic to aqueous phase. The layers were then separated, and organic impurities were removed by washing the aqueous layer with dichloromethane (3×30ml). Traces of organic solvents were removed under reduced pressure at RT, and the crude material was purified by diafiltration using 10kDa membrane with 80 volumes of nanopure water. After lyophilization, the powdered material was obtained and thoroughly characterized.
We used proton nuclear magnetic resonance (1H NMR), UV-vis, TEM, and small-angle x-ray scattering (SAXS) to characterize TMAT-AuNPs synthesized. The presence of free ligand, unwanted byproduct, and excess reactants was tested using 1H NMR. Spectra were collected at 25°C on a Varian Unity Inova 300 MHz instrument in D2O, and chemical shifts were reported in δ units (ppm) with residual solvent peak (D2O δ4.65) as the internal standard. UV-vis spectra were used to monitor the stability of TMAT-AuNPs in water and embryo medium (EM) over 5 days of toxicity test. UV-vis spectra were obtained on a Hewlett-Packard 8453 diode array instrument with a fixed slit width of 1nm using 1-cm quartz cuvettes. The NP core sizes were determined by TEM and SAXS. TEM images were collected at 300kV with an FEI Titan using Cs aberration corrector. The NP samples were prepared on carboxylic acid–functionalized SMART grids by soaking the grid in a dilute NP solution (0.2mg/ml) and then rinsing by soaking in nanopure water for 2min each. The grid was then air dried. Particle size analysis of TEM images was performed using ImageJ software from the NIH Website. The NP sizes in solution were determined by SAXS. Details were provided in our recent study (McKenzie et al., 2010). Briefly, NP samples were prepared at about 250–500mg/l and exposed to monochromated x-rays from a long fine focal spot–sealed x-ray tube (Cu 1.54 Å) powered by a generator at 2 kW focused by multilayer optics, measured with a Roper CCD in a Kratky camera. The Anton Paar SAXSess, in line-collimation mode, was set to average 50 scans of 50 s for particles greater than 1nm and less than 3nm in diameter. For particles less than 1nm, 100 scans of 100 s exposure were used. The corresponding dark current and background scans were subtracted from the data before desmearing using the beam profile in Anton Paar SAXSQuant software. Upon importing into IGOR Pro, the desmeared data were reduced to 200 points (with a 5-data point boxcar average) matching the number of bins to be fit. The size distribution of the sample was then determined using the size distribution macro in the IRENA package (Ilavsky and Jemian, 2009). The SAXS patterns were fit using the non-negative least squares method, assuming spherical particles, to yield a histogram of volume distribution binned by diameter. For each sample, polydispersity and average core size were determined by fitting a Gaussian function to the histogram distribution.
Zebrafish maintenance and embryo toxicity test
The wild-type 5D line of zebrafish (D. rerio) was housed at standard laboratory conditions in Sinnhuber Aquatic Research Laboratory (SARL) at Oregon State University: 28°C and a pH of 7.0 with a 14:10 light:dark photocycle in reverse osmosis water supplemented with 0.6% Instant Ocean. Embryos were staged accordingly as previously described (Kimmel et al., 1995) and collected by hand for all experiments. The chorion was enzymatically removed using pronase (Sigma-Aldrich) at 4h postfertilization (hpf) in the automated dechorionation system to obviate any potential for it to act as a barrier to bioavailability (Mandrell et al., 2012). Dechorionated embryos at 6 hpf were individually exposed to 100 μl of nominal concentrations of TMAT-AuNPs (0.08, 0.4, 2, 10, 20, 30, 40, and 50mg/l) in 96-well plates. The desired concentrations of TMAT-AuNPs were prepared in EM: 15mM NaCl, 0.5mM KCl, 1mM CaCl2, 1mM MgSO4, 0.15mM KH2PO4, 0.05mM Na2HPO4, and 0.7mM NaHCO3 (Westerfield, 2000). Nonrenewal exposures were continued in sealed well plates until 120 hpf. Mortality, developmental progression, and spontaneous tail flexion were recorded at 24 hpf. Incidence of mortality and a battery of morphological endpoints were recorded daily in a binary manner until 120 hpf. The percent incidence of morbidity and mortality was graphed for at least four replicates, each using eight embryos.
In vivo cellular death.
The apoptosis of embryos was evaluated using acridine orange (AO) staining and a terminal deoxynucleotidyl transferase-mediated dUTP nick-end labeling (TUNEL) assay at 24 and 72 hpf, respectively. AO is a nucleic acid–selective metachromatic stain. For AO staining, embryos exposed to 1, 10, and 30mg/l TMAT-AuNPs at 24 hpf were pooled and washed with fish water (FW) three times, followed by incubation in the AO solution (5 μg/ml in FW) for at least 1h at RT. The embryos were anesthetized with tricaine (4mg/ml in FW) for imaging with an inverted Zeiss microscope (Carl Zeiss, NY).
A TUNEL assay using a peroxidase (POD) (Roche Diagnostics GmbH, Mannheim, Germany), in situ cell death detection kit, was modified as previously described (Shi et al., 2008). Embryos exposed to 1, 10, and 30mg/l TMAT-AuNPs were fixed at 72 hpf in 4% paraformaldehyde (PFA) overnight at 4°C. After washing twice with PBS, larvae were incubated in 3% hydrogen peroxide in methanol for 15min at RT, washed with PBS again, and incubated in a TUNEL Label and Enzyme mixture provided by manufacturer for 60min at 37°C. Larvae were then rinsed with PBS and incubated in converter POD solution for 30min at 37°C. Following another wash with PBS, the apoptotic cells were treated with prewarmed diaminobenzidine substrate and were imaged for brown discoloration with a microscope.
Flow cytometry analysis was employed to assess the apoptosis of embryos exposed to 1 and 30mg/l TMAT-AuNPs through DNA content analysis of single cells. Flow cytometry methods were modified as previously described (Shi et al., 2008). One hundred 24 hpf embryos from each treatment were pooled and washed with PBS twice. Embryos were incubated in trypsin solution (0.25mg/ml trypsin in PBS) for 30min and disintegrated with 3.2-mm stainless steel beads (Next advance, Averill Park, NY) for about 5 s at RT in a bullet blender (Next advance). The completed digestion was confirmed under a dissecting microscope. The homogenates were centrifuged at 1000 × g for 7min at 4°C. After removing the supernatant, the cell pellet was resuspended with 100 μl of PBS, followed by fixation with 1ml of cold 70% ethanol on ice for 30min. Another centrifugation was carried out at 1000 × g for 7min at 4°C. Following resuspension of the cell pellet in 800 μl of PBS, 100 μl of 400 μg/ml propidium iodide (PI) solution (Sigma-Aldrich) and 100 μl of RNase (1mg/ml) (Sigma-Aldrich) were added. Finally, the suspensions were incubated at 28°C for 30min. Cell suspensions were then filtered using a 70-μm nylon mesh (BD Biosciences, San Jose, CA) to remove the clumps that would interfere with the flow cytometric analysis. Approximately 1×10⁴ cells were used in a Cytomix FC500 analyzer (Beckman-Coulter). The quantitative measurements for sub-G1 populations were made postacquisition using CXP softwater (Beckman-Coulter) to analyze listmode data files. Cell cycle analysis was determined using MultiCycle software (Phoenix Flow Systems).
Gene expression.
Total RNA was extracted from 20 zebrafish larvae per each treatment at 96 hpf using Trizol Reagent (Invitrogen, Carlsbad, CA). Pooled larvae exposed to 1, 10, and 30mg/l TMAT-AuNPs were homogenized in a bullet blender using a small scoop of 1.0-mm glass beads (Next advance) in a lock-top microcentrifuge tube. A 200-μl aliquot of chloroform (Mallinckrodt Chemicals) was added to homogenates and manually mixed. The homogenates were then placed for 2min at RT before centrifuging at 12,000 × g for 15min at 4°C. After transferring the supernatant to a fresh tube, 500 μl of isopropanol (J.T. Baker, Phillipsburg, NJ) was added and gently mixed for 10min at RT. Centrifugation was carried out at 12,000 × g for 10min at 4°C to pellet the RNA. The RNA pellet was washed twice with 1ml of 75% ethanol, with a centrifugation following each wash at 7600 × g for 5min at 4°C. The air-dried pellet was suspended with 30 μl of water, followed by RNA quality measurement (260/280 ≥ 1.8) using a microplate reader (Synergy 2, Bio Tek, Weinooski, VT).
The complementary DNA (cDNA) was synthesized from 2 μg total RNA using Superscript III First-Strand Synthesis System (Invitrogen) according to the manufacturer’s instructions. Quantitative real-time PCR (qRT-PCR) was performed on an ABI Step One Plus (Applied Biosystems, Carlsbad, CA) using the 2 × SYBR Green PCR master mix (Applied Biosystems). Cycling conditions were as follows: (1) 95°C for 10min and (2) 40 cycles of 95°C for 15 s, the optimized temperature for each target gene for 30 s, 72°C for 30 s, 95°C for 15 s, 72°C for 1min, and 95°C for 15 s. We selected several putative transcription factors that play critical roles in apoptosis (p53 and bax), eye embryogenesis (paired-box transcription factors; pax6, orthodenticle-related homeobox; otx2 and retinal homeobox; and rx1), and pigmentation (SRY box containing transcription factor; sox10, microphthalmia-associated transcription factor; mitfa and tyrosinase; and tyrp). The primer sequences, genebank accession numbers, and optimized temperature for PCR of each target gene are shown in Supplementary table S1. The fold changes of gene expression were calculated using the 2−∆∆Ct method based on the threshold cycle (CT) number. At least three biological replicates were used, and the relative expression was normalized to β-actin expression.
Whole-mount in situ hybridization.
Whole-mount in situ hybridization (WISH) was carried out for the detection of localized gene transcripts during embryonic development in both unexposed embryos and the embryos at 24 and 48 hpf. The detailed procedures were optimized in our laboratory by modifying the protocols of Barthel and Raymond (2000) and Thisse and Thisse (2008). Digoxigenin (DIG)-labeled antisense cRNA probes were transcribed with T7 RNA polymerase (Promega). Some cRNA probes were provided by Dr. H. Kim (University of Utah). Primers were purified using QIAquick PCR purification kit (Qiagen, Valencia, CA). The hybridized probes were visualized in a blue precipitate using anti-DIG with substrate of tetrazoliun salt/5-bromo-4-chloro-3 idolyl-phosphate (NBT/BCIP). WISH with Fast red was also employed to increase the sensitivity and reduce noise background. For Fast red staining, the same procedures as with NBT/BCIP were done until day 2. At day 3, embryos were split into two plates for both NBT/BCIP and Fast red staining. Briefly, embryos were rinsed two times with Fast red buffer and stained with Fast red Tablet (Sigma-Aldrich) dissolved in Fast red buffer. The red precipitates in embryos were fluorescently visualized by Z-stack imaging with a rhodamine filter set.
Behavioral activity assessment.
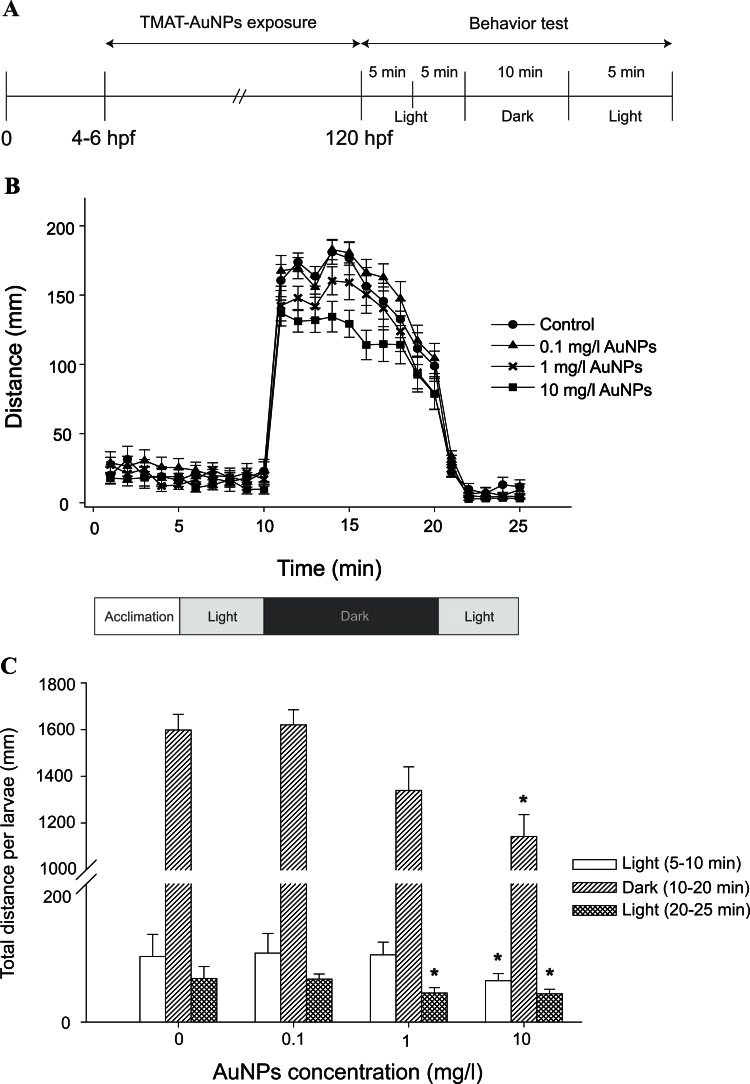
Behavioral responses of larvae exposed 0.1, 1, and 10mg/l TMAT-AuNPs showing no mortality were measured at 5 days postfertilization (dpf) in a Viewpoint Zebrabox (software version 3.0, Viewpoint Life Sciences, Lyon, France) using the tracking setting. Larvae were acclimated to the light for 5min and recorded for 5min in the light, 10min in the dark, and 5min in the light. This photo cycle, modified as previously described (MacPhail et al., 2009), has been extensively used in our laboratory. We confirmed no effect of modified photocycle on behavior activity of zebrafish in the previous study (Truong et al., 2012). The behavioral profile was based on the distances moved between the light and dark periods. A custom perl script was used to calculate the total distance moved per minute. Behavioral assessment was run in triplicate for each of 24 larvae of the three exposure concentrations of TMAT-AuNPs and EM for controls.
Immunohistochemistry.
Whole-mount immunohistochemistry (IHC) was carried out to visualize specific neurons and axons as previously described (Svoboda et al., 2002). Briefly, embryos exposed to 1, 10, and 30mg/l TMAT-AuNPs from 6 to 48 hpf stored in PBS after fixing in 4% PFA overnight at −4°C were washed with PBST (PBS containing 0.1% Tween 20). Embryos were washed with acetone at −20°C for 20min and incubated in collagenase (0.001g collagenase/1ml PBST) for 30min, followed by two washes with PBST and treatment with blocking solution (10% normal goat serum in PBST) for 2h. Embryos were then incubated in primary antibody of znp-1 (Developmental Studies Hybridoma Bank, University of Iowa) at 1:500, Zn-5 (Developmental Studies Hybridoma Bank) at 1:250, and antiacetylated tubulin (α-AT) at 1:4000 in blocking solution overnight on the rocker at 4°C. The following day, after embryos were washed with PBST twice for 90min, they were incubated for another 90min in goat antimouse IgG secondary antiserum conjugated to Alexa Fluor 555 (Molecular Probe, Eugene, OR) at 1:1000 dilution in PBST. Before imaging, embryos were rinsed in PBST three times and rested for at least 30min. Twenty embryos per each treatment were threshold scored for IHC.
Statistical analysis.
All statistical analyses were carried out using SigmaStat/Plot 11 (SPSS Inc, Chicago, IL). The significant differences in gene expression were determined by one-way ANOVA (p < 0.05), followed by Tukey’s post hoc test. The gene expression data were expressed as the mean ± SE. The significant differences in larval swimming activities in each of the three light cycles were determined by two-way ANOVA and Tukey’s post hoc test. The behavioral activity data were expressed as the mean ± SD.
RESULTS
TMAT-AuNP Synthesis and Characterization
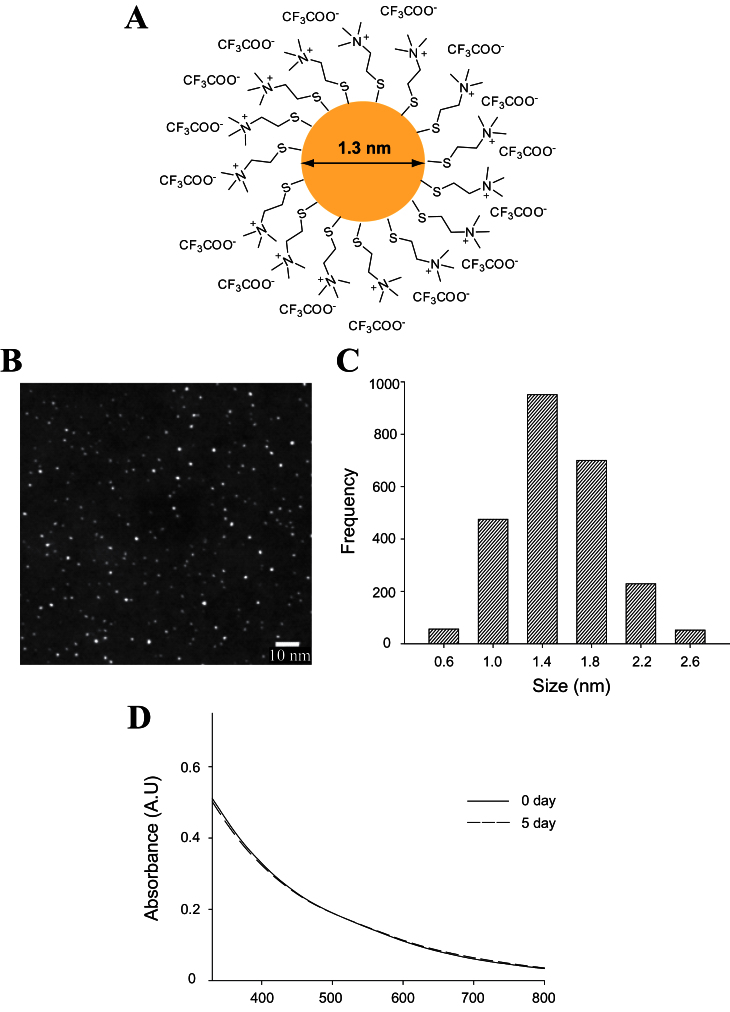
Spherical 1.3-nm AuNPs were synthesized and functionalized with positively charged TMAT ligands that are covalently bound to the NP surface through sulfur (TMAT-AuNP, Fig. 1A). X-ray photoelectron spectra confirm that the counterions are trifluoroacetate. (A small amount, less than 5%, of iodide was also detected.) The proton NMR spectra indicated the absence of free ligands after purification (Supplementary fig. S1). Before conducting the toxicity assessment, we completed a full characterization of TMAT-AuNPs in order to confirm their stability and ensure a reproducible toxicity study. Figure 1 and Table 1 illustrate the physicochemical properties of the TMAT-AuNPs prepared. From dark-field TEM images, the average core size of TMAT-AuNPs was determined to be 1.3±0.4nm (Figs. 1B and C). We employed SAXS to measure the diameter of TMAT-AuNPs in solution (Table 1 and Supplementary fig. S2). We reported that SAXS exhibited high instrumental resolution for measuring the primary diameter of single nanosized AuNPs in solution in real time (McKenzie et al., 2010). The average diameter of TMAT-AuNPs determined from SAXS is 1.3±0.4nm in both nanopure water and EM. These measurements indicate that TMAT-AuNPs remain stable without significant agglomeration in standard zebrafish EM. There was no decrease or shift of UV-vis absorbance spectra and no plasmon at 520nm generated by particles greater than 2nm, either in nanopure water or in EM over 5 days (Fig. 1D). These characteristics demonstrated that the prepared TMAT-AuNPs were highly stable over the entire duration of embryonic toxicity assessment.
Fig. 1.
Structure and characteristics of TMAT-AuNPs. (A) Schematic diagram of TMAT-AuNPs. (B) Dark-field TEM images of TMAT-AuNPs. (C) A histogram illustrating the size distribution of TMAT-AuNPs determined by TEM. (D) UV-vis spectra that demonstrate the stability of TMAT-AuNPs in embryo medium over 5 days.
Table 1.
Characteristics of TMAT-AuNPs
| Primary size (nm)a | ε at 400nm (ml/mg/cm)b | |||
|---|---|---|---|---|
| TEM | SAXS | |||
| Nanopure | EM | Nanopure | EM | |
| 1.3±0.4 | 1.3±0.4 | 1.3±0.4 | 5.8 | 6.0 |
aPrimary core size was obtained by TEM deposited on SMART grids. Core size in solution was determined by SAXS in nanopure water (Nanopure) and standard zebrafish embryo medium (EM).
bExtinction coefficients were determined for 50mg/l TMAT-AuNPs dispersed in Nanopure and EM at 400nm.
Developmental Toxicity of TMAT-AuNPs
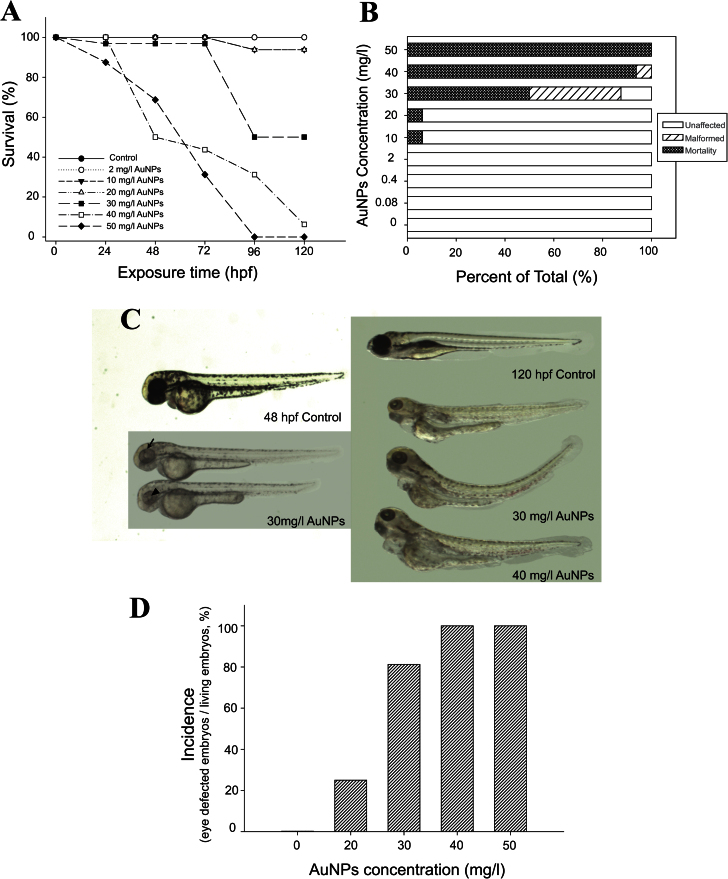
Exposure to TMAT-AuNPs induced embryonic mortality and malformations. Exposure to TMAT ligand alone or bare AuNPs resulted in no toxicity (data not shown), suggesting that covalent addition of the positively charged ligand to the AuNPs surface dramatically increased the developmental toxicity. Figure 2A illustrates the mortality over 5 days of exposure; the LC50 (the concentration showing 50% mortality) was determined to be 30mg/l at 120 hpf. Living larvae exposed to concentrations of 30mg/l TMAT-AuNPs and higher (i.e., 40 and 50mg/l) were immobile with low heart rate and strikingly sluggish blood flow at 120 hpf. The incidence of malformation at 30mg/l was 80% among living organisms at 120 hpf (Fig. 2B). Typically, screened malformations were bent spine; pericardial and yolk sac edema; and jaw and eye abnormalities.
Fig. 2.
(A) Concentration-response relationship (n = 32). (B) The percentage of unaffected, malformed, and mortality at 120 hpf (n = 32). (C) Examples of malformations at 30 and 40mg/l at 48 and 120 hpf. Eye defects were observed from 48 hpf, and other malformations such as pericardial edema, yolk sac edema, and bent spine were observed at 120 hpf. Black arrow and black arrowhead indicate the boundary of neural retina and the lens, respectively. (D) The percentage of incidence of eye defects over various concentrations of TMAT-AuNPs at 48 hpf (n = 100).
We noted that smaller than normal and pale gray eyes were consistently observed in embryos exposed to TMAT-AuNPs (Fig. 2C). At concentrations below 10mg/l, where no mortality had occurred, smaller and hypopigmented eyes were not observed. At concentrations higher than 30mg/l, the incidence of eye defects was 100% in living embryos at 120 hpf. Eye defects were observed at 48 hpf (Fig. 2D) where 80 and 100% of larvae exposed to 30 and 50mg/l TMAT-AuNPs, respectively, displayed small and pale gray eyes. The absence of pigment was apparent at 48 hpf in the neural retina and the lens area, but some pigmentation developed in the boundary between the neural retina and the lens remained distinguishable (Fig. 2C).
In Vivo Cellular Death
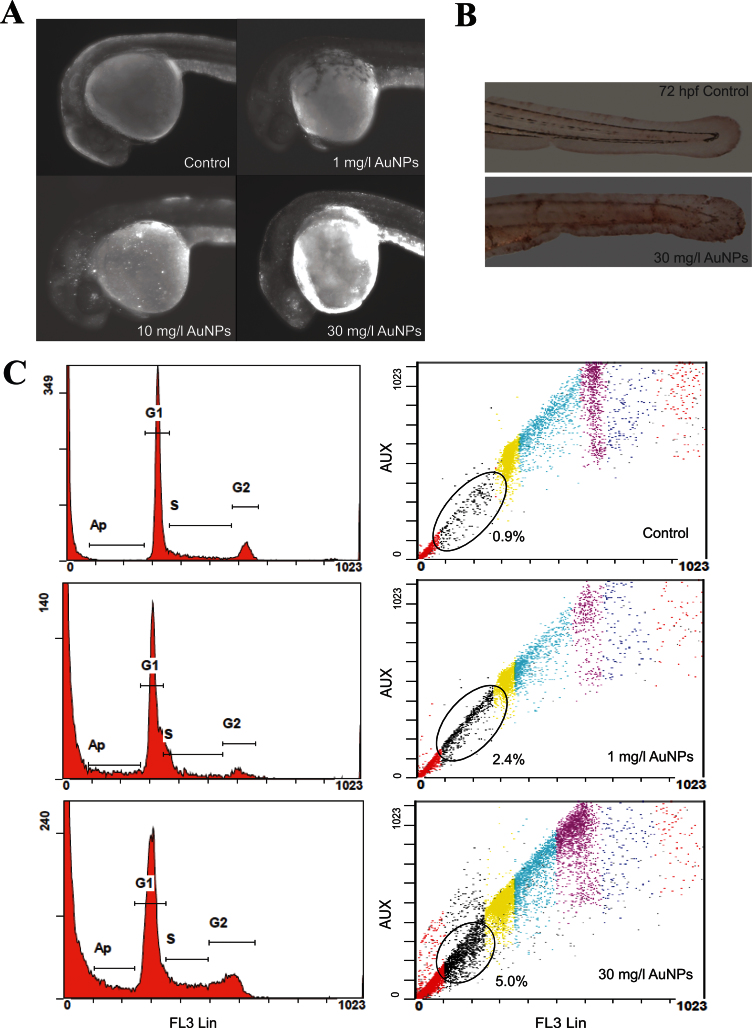
We first investigated the occurrence of ectopic apoptosis in embryos exposed to TMAT-AuNPs using AO staining, the TUNEL assay, and flow cytometric analysis. Figure 3A shows increased apoptotic cells expressed as bright dots under AO staining, especially in the eye region, when exposure concentrations increased from 1 to 30mg/l. More apoptotic cells were detected in the lens rather than in the neural retinal region, consistent with the eye pigmentation pattern elicited by TMAT-AuNPs. Apoptosis in the eye was obvious at 10mg/l TMAT-AuNPs, but no eye defects were visually distinguishable at this concentration. We conducted TUNEL assay to see if the apoptosis occurred in other parts at the later developmental stage. An increase of apoptotic cells in the body trunk was similarly observed by TUNEL assay (Fig. 3B). Flow cytometric analysis exhibited a concentration-dependent increase of the percentage of apoptotic cells, from 0.9% in the control to 2.4 and 5.0% in embryos exposed to 1 and 30mg/l of TMAT-AuNPs, respectively (Fig. 3C). TMAT-AuNPs induced apoptosis and DNA damage in the eye region of zebrafish embryos, which appeared to be associated with developmental eye defects.
Fig. 3.
In vivo cellular death. (A) AO staining at 24 hpf. (B) TUNEL assay at 72 hpf. (C) Flow cytometry at 24 hpf. Left column: the histograms of DNA content. Right column: DNA content stained by PI. The percentage of apoptosis is analyzed by width and area of FL3 signal.
Gene Expression for Eye Embryogenesis and Pigmentation
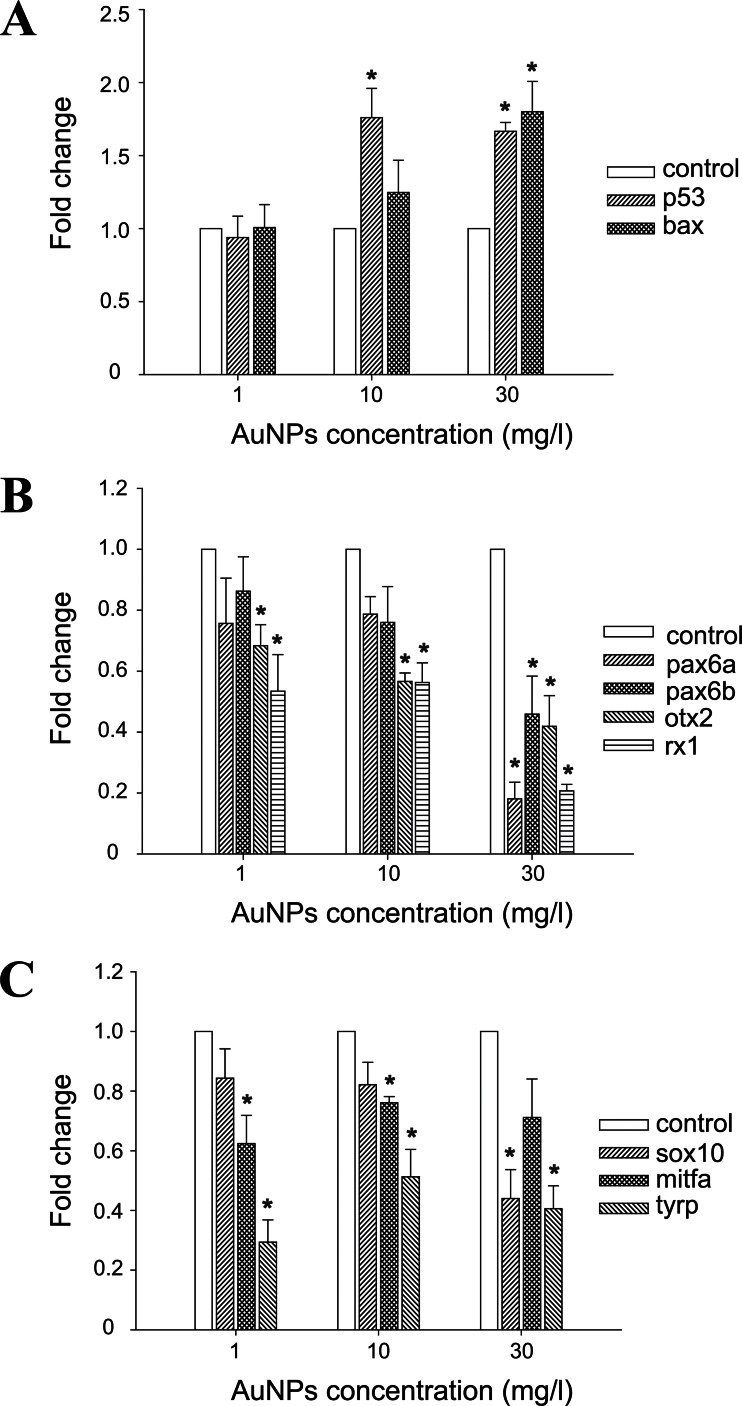
Expression changes were measured by qRT-PCR after exposure to 1, 10, and 30mg/l TMAT-AuNPs until 96 hpf. Apoptosis related to p53 and bax was significantly upregulated in response to TMAT-AuNPs exposure compared with the control (Fig. 4A). Significant repression of transcription factors controlling eye development (pax6a, pax6b, otx2, and rx1) was observed after exposure to TMAT-AuNPs compared with the control (Fig. 4B). Expression of pigmentation transcription factor sox10 was significantly decreased in embryos exposed to 30mg/l TMAT-AuNPs, whereas mitfa expression was decreased at 1 and 10mg/l, and tyrp expression was reduced at all three concentrations. There was no significant change in the expression of mitfa and tyrp with TMAT-AuNPs dose (Fig. 4C).
Fig. 4.
Real-time quantitative PCR analysis of (A) p53 and bax for apoptosis; (B) pax6a, pax6b, otx2, and rx1 for eye embryogenesis; and (C) sox10, mitfa, and tyrp for pigmentation at the exposure of 0, 1, 10, and 30mg/l TMAT-AuNPs at 96 hpf, respectively. Error bars represent as mean ± SE of at least three replicates. Asterisks represent the significant difference to the control by one-way ANOVA, followed by Tukey’s post hoc test (*p < 0.05).
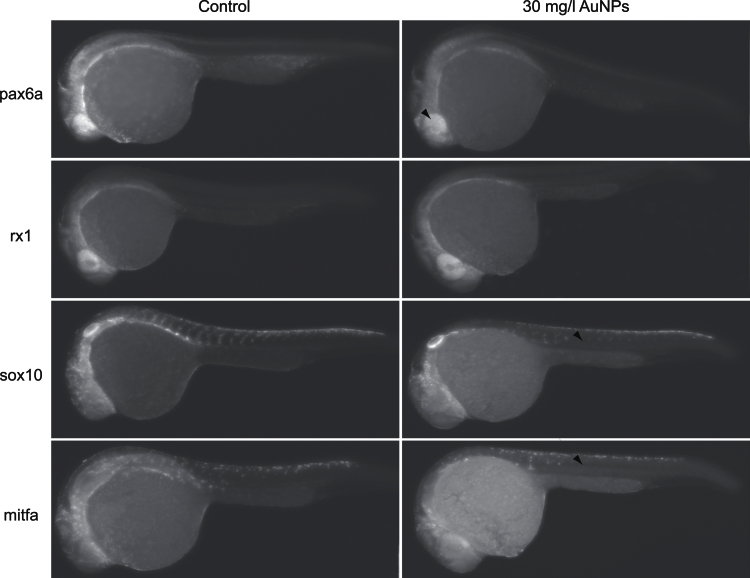
We investigated the spatial distribution of pax6a, rx1, sox10, and mitfa transcripts during development after exposure to 30mg/l TMAT-AuNPs. Figure 5 shows the results of WISH with Fast red staining at 24 hpf. BCIP/NBT at 24 hpf and Fast red at 48 hpf are shown in Supplementary figures S3 and S4. In control embryos, pax6a was expressed in the eye and hind brain; rx1 was mainly localized in the eye; sox10 was detected in somatic tissue neighboring the notochord in an orderly segmental fashion; and mitfa was present in neural crest cells and along the trunk. In contrast, the transcripts were missing or reduced in embryos exposed to TMAT-AuNPs (Fig. 5). The reduction was obvious for sox10 and mitfa. The WISH results suggest the initiation of eye defects at the earlier developmental stages than the other deformities noted.
Fig. 5.
In situ hybridization with Fast red at 24 hpf for pax6a, rx1, sox10, and mitfa. Left column: unexposed control; right column: the embryos exposed to 30mg/l TMAT-AuNPs.
Behavior Activity Assessment
We hypothesized that eye defects in embryos exposed to TMAT-AuNPs were linked to CNS damage and that the visual perception of the larvae would be affected. The ability of larvae exposed to TMAT-AuNPs (0.1, 1, and 10mg/l) to mount a swim response to sudden light-to-dark transition was investigated. The total distance moved during a cycle of alternating light and dark periods was averaged across a 25-min test conducted after terminating the exposure at 120 hpf (Fig. 6A). Larvae exposed to 1 and 10mg/l TMAT-AuNPs swam a significantly shorter average distance during the 10- to 15-min dark period than did unexposed larvae (Fig. 6B), and the total distance moved by larvae exposed to 10mg/l TMAT-AuNPs was significantly lower during all phases of the test (Fig. 6C). The eye defect did appear to alter visual perception or the ability to mount an appropriate swim response, suggesting that the developing CNS may be targeted by TMAT-AuNPs.
Fig. 6.
Behavioral activity of larvae after 120 hpf exposure to TMAT-AuNPs. (A) The overview of behavior test. (B) Distance of larvae exposed to 0.1, 1, and 10mg/l TMAT-AuNPs in alternating light and dark cycles. (C) Total distance of larvae at each light and dark cycle. Error bars represent as mean ± SD. Asterisks represent the significant difference to the control by two-way ANOVA, followed by Tukey’s post hoc test (*p < 0.05).
Motor Neurons and Neuronal Morphology
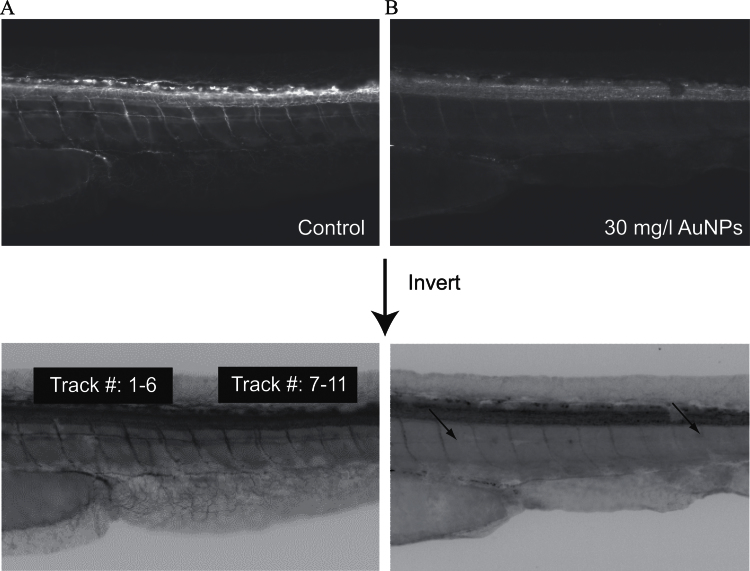
We sought the evidence for CNS damage by TMAT-AuNPs in motor neuron axon growth. Embryos were immunolabeled with znp-1, zn-5, and α-AT at 48 hpf to visualize primary and secondary motor neurons, as well as axon morphology. Among znp-1- and zn-5-labeled neurons in the larval trunk, there was no obvious difference between control and 30mg/l TMAT-AuNP treatments (Supplementary fig. S5). TMAT-AuNPs were not associated with striking evidence of abnormal patterning of primary and secondary motor neurons in the trunk region, such as aberrant morphology, projection at aberrant angles, or abnormal branching over all exposure concentrations. But α-AT-labeled neurons exhibited truncation, absence of dorsal and ventral axons, and abnormal innervations of neighboring segments (Fig. 7). To quantify the proportion of embryos having axonal growth inhibition, the 11 axons in the trunk region of larvae exposed to 30mg/l TMAT-AuNPs were threshold scored (Table 2). Axons closer to the caudal fin (i.e., 7–11 axon tract numbers in Table 2) were more likely to exhibit aberrant development than those closer to the head.
Fig. 7.
Antiacetylated tubulin (α-AT) labeling by IHC in unexposed control (A) and the embryo exposed to 30mg/l TMAT-AuNPs (B) at 48 hpf. Below images are the inverted images from above original images.
Table 2.
Incidence of Truncation and Absence of Dorsal Axons and Ventral Axons, and Inhibition of Dorsal Segment Innervations
| Number of axon tracts | Truncation and absence of | Inhibition of segment innervations (%)a | |
|---|---|---|---|
| Dorsal axons (%)a | Ventral axons (%)a | ||
| 1–6 | 30 | 20 | 75 |
| 7–11 | 70 | 55 | |
aThe incidence was observed among embryos exposed to 30mg/l TMAT-AuNPs from 6 to 48 hpf. Values represent the % of embryos exhibiting the defects (n = 20 per group).
DISCUSSION
Spherical AuNPs with 1.3nm cores were positively functionalized with cationic TMAT ligands covalently bound to their surface. Previous researchers have used cetyltrimethyl-ammoniumbromide (CTAB) (Hauck et al., 2008), polymers (Cho et al., 2009), and alkyl thiols (Goodman et al., 2004) to make cationic AuNPs. However, CTAB was proven to be toxic itself (Alkilany et al., 2009); polymers drove agglomeration; and functionalization by thiol exchange was inefficient. Among these, agglomeration in the test medium is an often overlooked but insidious characteristic of NPs that, when not controlled, obfuscate the toxicity of NPs (Albanese and Chan, 2011). We demonstrated by several analytical tools that the prepared TMAT-AuNPs were highly stable over the experimental conditions of zebrafish developmental toxicity testing. TMAT-AuNPs were stably dispersed in other biological media used to assess cytotoxicity (Schaeublin et al., 2011). The use of well-dispersed materials is essential to understand the toxicity of AuNPs in each test medium.
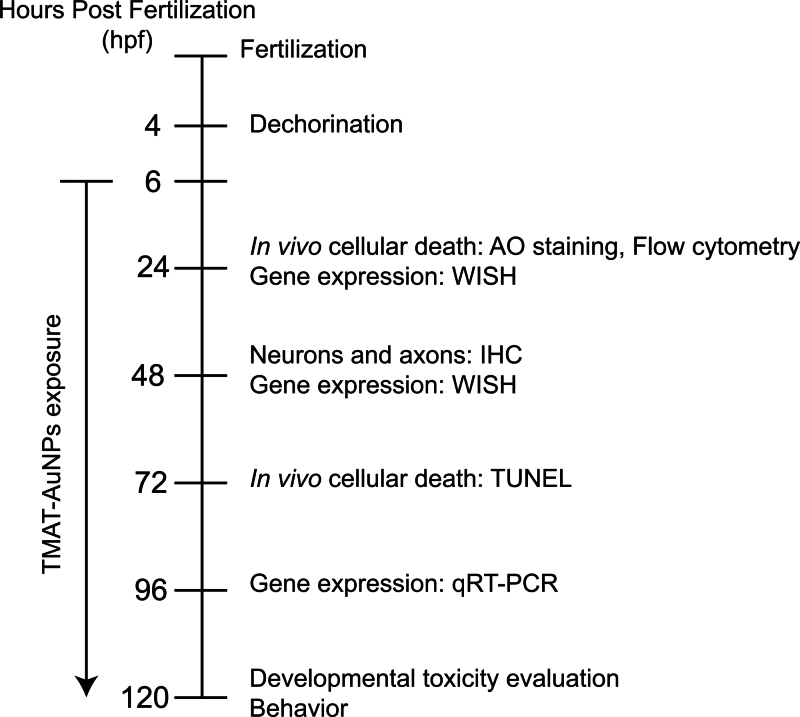
Zebrafish embryos exposed to TMAT-AuNPs developed smaller than normal eyes that were pale gray rather than the normal black. Figure 8 illustrates the schematic diagram of time points of each assay conducted to gain an understanding of the underlying causes of aberrant eye development induced by TMAT-AuNPs. Expression changes in genes governing apoptosis were examined. p53 and bax were sharply upregulated, suggesting that the cell death observed in the abnormally developing eye of embryos exposed to TMAT-AuNPs was via p53 activation of bax, followed by mitochondrial outer membrane permeabilization and initiation of a caspase cascade (Levine, 1997; Shi et al., 2008). Among genes specific to eye development, we observed that TMAT-AuNPs induced downregulation of pax6a, pax6b, otx2, and rx1. Studies using gene knockdown approaches identified the endogenous functions of pax6a, otx2, and rx1 as necessary to cue proper eye morphogenesis of vertebrates (Kleinjan et al., 2008; Martínez-Morales et al., 2004; Vopalensky and Kozmik, 2009). The homeodomain-containing transcription factor pax initiates critical steps in the differentiation of lens and photoreceptor cells (Kleinjan et al., 2008; Vopalensky and Kozmik, 2009). Otx is responsible for the terminal differentiation of photoreceptor cells, and it cooperates with pax and rx in regulating rhabdomeric and ciliary photoreceptors (Vopalensky and Kozmik, 2009). The observed downregulation of sox10, mitfa, and tyrp was consistent with the reduced eye pigmentation seen in embryos exposed to TMAT-AuNPs. Sox10 positively regulates the promoter of mitfa in neural crest and, in turn, tyrp is a downstream target of mitfa, a highly conserved transcription factor in melanin production (Martínez-Morales et al., 2004; Silver et al., 2006; Vopalensky and Kozmik, 2009). However, no significant reduction of mitfa in embryos exposed to 30mg/l TMAT-AuNPs as shown in Figure 5C was observed. This variation in gene expression reduction is probably because of the presence of various genes or pathways regulating pigmentation. Among the transcription factors necessary for eye development, pax is responsible for pigment cell development, otx regulates the pigmentation by binding the promoter of mitf, and rx is mostly required for phototransduction (Martinez-Morales et al., 2004; Vopalensky and Kozmik, 2009). The results of our gene expression and in situ RNA localization queries, though not exhaustive, plausibly suggested that TMAT-AuNPs both spatially and temporally modulated genes consistently with the malformed eye phenotype. Future studies will define the impacts of TMAT-AuNPs specifically in the retinal, photoreceptor, and ganglion cell layers using finer scale histological approaches.
Fig. 8.
A schematic diagram for toxicological assays and time points.
Below the threshold dose for TMAT-AuNP-induced malformations, swimming behavior was significantly affected. At 10mg/l, TMAT-AuNPs significantly decreased the average swim distance during the dark (most active) period. This is due solely to the likelihood that the eye defects caused visual impairment or that motor neuron development appeared to be damaged. A mutant zebrafish study showed that the disruption of genes mediating visual function resulted in abnormal behavioral output (Muto et al., 2005). To our knowledge, axon developmental damage is a novel effect of TMAT-AuNPs in the developing zebrafish. The disruption of neurons and axons caused by chemical exposure during embryonic development is a critical determinant of neuronal connectivity, which leads to neurobehavioral defects (Sylvain et al., 2010; Yang et al., 2011).
Eye malformations and pigmentation deficits have been reported with growing frequency from test species exposed to silver NPs (AgNPs) because Lee et al. (2007) first reported the eyeless phenotype caused by AgNPs in zebrafish. AgNPs have inhibited pigmentation in Drosophila (Panacek et al., 2011) and caused hypopigmented gray eyes and microphthalmia in medaka and zebrafish (Asharani et al., 2011; Wu et al., 2010). Oral administration of AgNPs to rats has induced aberrant pigmentation in the liver and intestines (Kim et al., 2010). Negative and neutral AuNPs did not cause eye defects (Harper et al., 2011) possibly because anionic surface functionalization has been generally observed to be less developmentally toxic. A wide range of NPs have been developed as therapeutic agents for the eye. The weight of evidence now indicates the potential for harm to the developing eye and that testing is warranted for a range of well-characterized formulations in pregnant rodent models (Prow, 2010) and in cells (Sanders et al., 2012).
In conclusion, we sought linkage between toxicological outcomes in vivo and molecular responses for a deeper understanding of cationic functionalized AuNP toxicology. We demonstrated that cationic functionalized TMAT-AuNPs induced abnormally small and underpigmented eyes in the developing zebrafish. Through molecular and immunohistochemical tools, we linked this phenotypic response to hyperapoptosis in the eye and aberrant expression of transcript factors that regulate eye and pigmentation development. These outcomes were also linked to axon morphology deficits that may have caused the abnormal behavioral activity. For now, our study indicates that TMAT-AuNPs may pose a developmental hazard to mammals.
SUPPLEMENTARY DATA
Supplementary data are available online at http://toxsci.oxfordjournals.org/.
FUNDING
National Institute of Environmental Health Sciences (NIEHS) (R01 ES016896, P30 ES000210); the Air Force Research Laboratory (FA8650-05-1-5041); Basic Science Research Program through the National Research Foundation of Korea (NRF) funded by the Ministry of Education, Science and Technology (357-2011-1-D00130).
Supplementary Material
ACKNOWLEDGMENTS
The authors would like to acknowledge the staff of the Sinnhuber Aquatic Research Laboratory for the embryos, Dr. Erik K. Richman for TEM imaging, Zachary C. Kennedy and Edword W. Elliot, III for SAXS analysis, and the assistance from the Flow Cytometry Facility of the Environmental Health Sciences Core Center at Oregon State University. All authors declare not to have any conflicts of interest.
REFERENCES
- Albanese A., Chan W. C. (2011). Effect of gold nanoparticle aggregation on cell uptake and toxicity. ACS Nano 5, 5478–5489 [DOI] [PubMed] [Google Scholar]
- Alkilany A. M., Nagaria P. K., Hexel C. R., Shaw T. J., Murphy C. J., Wyatt M. D. (2009). Cellular uptake and cytotoxicity of gold nanorods: Molecular origin of cytotoxicity and surface effects. Small 5, 701–708 [DOI] [PubMed] [Google Scholar]
- Asharani P. V., Lianwu Y., Gong Z., Valiyaveettil S. (2011). Comparison of the toxicity of silver, gold and platinum nanoparticles in developing zebrafish embryos. Nanotoxicology 5, 43–54 [DOI] [PubMed] [Google Scholar]
- Barthel L. K., Raymond P. A. (2000). In situ hybridization studies of retinal neurons. Methods Enzymol. 316, 579–590 [DOI] [PubMed] [Google Scholar]
- Bartneck M., Keul H. A., Singh S., Czaja K., Bornemann J., Bockstaller M., Moeller M., Zwadlo-Klarwasser G., Groll J. (2010). Rapid uptake of gold nanorods by primary human blood phagocytes and immunomodulatory effects of surface chemistry. ACS Nano 4, 3073–3086 [DOI] [PubMed] [Google Scholar]
- Cho E. C., Xie J., Wurm P. A., Xia Y. (2009). Understanding the role of surface charges in cellular adsorption versus internalization by selectively removing gold nanoparticles on the cell surface with a I2/KI etchant. Nano Lett. 9, 1080–1084 [DOI] [PubMed] [Google Scholar]
- Giljohann D. A., Seferos D. S., Daniel W. L., Massich M. D., Patel P. C., Mirkin C. A. (2010). Gold nanoparticles for biology and medicine. Angew. Chem. Int. Ed. Engl. 49, 3280–3294 [DOI] [PMC free article] [PubMed] [Google Scholar]
- Goodman C. M., McCusker C. D., Yilmaz T., Rotello V. M. (2004). Toxicity of gold nanoparticles functionalized with cationic and anionic side chains. Bioconjug. Chem. 15, 897–900 [DOI] [PubMed] [Google Scholar]
- Harper S. L., Carriere J. L., Miller J. M., Hutchison J. E., Maddux B. L., Tanguay R. L. (2011). Systematic evaluation of nanomaterial toxicity: Utility of standardized materials and rapid assays. ACS Nano 5, 4688–4697 [DOI] [PMC free article] [PubMed] [Google Scholar]
- Hauck T. S., Ghazani A. A., Chan W. C. (2008). Assessing the effect of surface chemistry on gold nanorod uptake, toxicity, and gene expression in mammalian cells. Small 4, 153–159 [DOI] [PubMed] [Google Scholar]
- Hill A. J., Teraoka H., Heideman W., Peterson R. E. (2005). Zebrafish as a model vertebrate for investigating chemical toxicity. Toxicol. Sci. 86, 6–19 [DOI] [PubMed] [Google Scholar]
- Ilavsky J., Jemian P. R. (2009). Irena: Tool suite for modeling and analysis of small-angle scattering. J. Appl. Crystallogr. 42, 347–353 [Google Scholar]
- Kim Y. S., Song M. Y., Park J. D., Song K. S., Ryu H. R., Chung Y. H., Chang H. K., Lee J. H., Oh K. H., Kelman B. J., et al. (2010). Subchronic oral toxicity of silver nanoparticles. Part. Fibre Toxicol. 7, 20 [DOI] [PMC free article] [PubMed] [Google Scholar]
- Kimmel C. B., Ballard W. W., Kimmel S. R., Ullmann B., Schilling T. F. (1995). Stages of embryonic development of the zebrafish. Dev. Dyn. 203, 253–310 [DOI] [PubMed] [Google Scholar]
- Kleinjan D. A., Bancewicz R. M., Gautier P., Dahm R., Schonthaler H. B., Damante G., Seawright A., Hever A. M., Yeyati P. L., van Heyningen V., et al. (2008). Subfunctionalization of duplicated zebrafish pax6 genes by cis-regulatory divergence. PLoS Genet. 4, e29 [DOI] [PMC free article] [PubMed] [Google Scholar]
- Lee K. J., Nallathamby P. D., Browning L. M., Osgood C. J., Xu X. H. (2007). In vivo imaging of transport and biocompatibility of single silver nanoparticles in early development of zebrafish embryos. ACS Nano 1, 133–143 [DOI] [PMC free article] [PubMed] [Google Scholar]
- Levine A. J. (1997). p53, the cellular gatekeeper for growth and division. Cell 88, 323–331 [DOI] [PubMed] [Google Scholar]
- Lin J., Zhang H., Chen Z., Zheng Y. (2010). Penetration of lipid membranes by gold nanoparticles: Insights into cellular uptake, cytotoxicity, and their relationship. ACS Nano 4, 5421–5429 [DOI] [PubMed] [Google Scholar]
- MacPhail R. C., Brooks J., Hunter D. L., Padnos B., Irons T. D., Padilla S. (2009). Locomotion in larval zebrafish: Influence of time of day, lighting and ethanol. Neurotoxicology 30, 52–58 [DOI] [PubMed] [Google Scholar]
- Mandrell D., Truong L., Jephson C., Sarker M. R., Moore A., Lang C., Simonich M. T., Tanguay R. L. (2012). Automated zebrafish chorion removal and single embryo placement: Optimizing throughput of zebrafish developmental toxicity screens. J. Lab. Autom. 17, 66–74 [DOI] [PMC free article] [PubMed] [Google Scholar]
- Martínez-Morales J. R., Rodrigo I., Bovolenta P. (2004). Eye development: A view from the retina pigmented epithelium. Bioessays 26, 766–777 [DOI] [PubMed] [Google Scholar]
- McKenzie L. C., Haben P. M., Kevan S. D., Hutchinson J. E. (2010). Determining nanoparticle size in real time by small-angle X-ray scattering in a microscale flow system. J. Phys. Chem. C. 114, 22055–22063 [Google Scholar]
- Murphy C. J., Gole A. M., Stone J. W., Sisco P. N., Alkilany A. M., Goldsmith E. C., Baxter S. C. (2008). Gold nanoparticles in biology: Beyond toxicity to cellular imaging. Acc. Chem. Res. 41, 1721–1730 [DOI] [PubMed] [Google Scholar]
- Muto A., Orger M. B., Wehman A. M., Smear M. C., Kay J. N., Page-McCaw P. S., Gahtan E., Xiao T., Nevin L. M., Gosse N. J., et al. (2005). Forward genetic analysis of visual behavior in zebrafish. PLoS Genet. 1, e66 [DOI] [PMC free article] [PubMed] [Google Scholar]
- Pan Y., Leifert A., Ruau D., Neuss S., Bornemann J., Schmid G., Brandau W., Simon U., Jahnen-Dechent W. (2009). Gold nanoparticles of diameter 1.4nm trigger necrosis by oxidative stress and mitochondrial damage. Small 5, 2067–2076 [DOI] [PubMed] [Google Scholar]
- Panacek A., Prucek R., Safarova D., Dittrich M., Richtrova J., Benickova K., Zboril R., Kvitek L. (2011). Acute and chronic toxicity effects of silver nanoparticles (NPs) on Drosophila melanogaster. Environ. Sci. Technol. 45, 4974–4979 [DOI] [PubMed] [Google Scholar]
- Parng C. (2005). In vivo zebrafish assays for toxicity testing. Curr. Opin. Drug Discov. Dev. 3, 533–539 [PubMed] [Google Scholar]
- Prow T. W. (2010). Toxicity of nanomaterials to the eye. Wiley Interdiscip. Rev. Nanomed. Nanobiotechnol. 2, 317–333 [DOI] [PubMed] [Google Scholar]
- Sanders K., Degn L. L., Mundy W. R., Zucker R. M., Dreher K., Zhao B., Roberts J. E., Boyes W. K. (2012). In vitro phototoxicity and hazard identification of nano-scale titanium dioxide. Toxicol. Appl. Pharmacol. 258, 226–236 [DOI] [PubMed] [Google Scholar]
- Schaeublin N. M., Braydich-Stolle L. K., Schrand A. M., Miller J. M., Hutchison J., Schlager J. J., Hussain S. M. (2011). Surface charge of gold nanoparticles mediates mechanism of toxicity. Nanoscale 3, 410–420 [DOI] [PubMed] [Google Scholar]
- Shi X., Du Y., Lam P. K., Wu R. S., Zhou B. (2008). Developmental toxicity and alteration of gene expression in zebrafish embryos exposed to PFOS. Toxicol. Appl. Pharmacol. 230, 23–32 [DOI] [PubMed] [Google Scholar]
- Silver D. L., Hou L., Pavan W. J. (2006). The genetic regulation of pigment cell development. Adv. Exp. Med. Biol. 589, 155–169 [DOI] [PubMed] [Google Scholar]
- Svoboda K. R., Vijayaraghavan S., Tanguay R. L. (2002). Nicotinic receptors mediate changes in spinal motoneuron development and axonal pathfinding in embryonic zebrafish exposed to nicotine. J. Neurosci. 22, 10731–10741 [DOI] [PMC free article] [PubMed] [Google Scholar]
- Sylvain N. J., Brewster D. L., Ali D. W. (2010). Zebrafish embryos exposed to alcohol undergo abnormal development of motor neurons and muscle fibers. Neurotoxicol. Teratol. 32, 472–480 [DOI] [PubMed] [Google Scholar]
- Thisse C., Thisse B. (2008). High-resolution in situ hybridization to whole-mount zebrafish embryos. Nat. Protoc. 3, 59–69 [DOI] [PubMed] [Google Scholar]
- Truong L., Saili K. S., Miller J. M., Hutchison J. E., Tanguay R. L. (2012). Persistent adult zebrafish behavioral deficits results from acute embryonic exposure to gold nanoparticles. Comp. Biochem. Physiol. C. Toxicol. Pharmacol. 155, 269–274 [DOI] [PMC free article] [PubMed] [Google Scholar]
- Vopalensky P., Kozmik Z. (2009). Eye evolution: Common use and independent recruitment of genetic components. Philos. Trans. R. Soc. Lond. B. Biol. Sci. 364, 2819–2832 [DOI] [PMC free article] [PubMed] [Google Scholar]
- Warner M. G., Hutchison J. E. (2003). Linear assemblies of nanoparticles electrostatically organized on DNA scaffolds. Nat. Mater. 2, 272–277 [DOI] [PubMed] [Google Scholar]
- Westerfield M. (2000). The Zebrafish Book. University of Oregon Press, Eugene, OR: [Google Scholar]
- Woehrle G. H., Brown L. O., Hutchison J. E. (2005). Thiol-functionalized, 1.5-nm gold nanoparticles through ligand exchange reactions: Scope and mechanism of ligand exchange. J. Am. Chem. Soc. 127, 2172–2183 [DOI] [PubMed] [Google Scholar]
- Wu Y., Zhou Q., Li H., Liu W., Wang T., Jiang G. (2010). Effects of silver nanoparticles on the development and histopathology biomarkers of Japanese medaka (Oryzias latipes) using the partial-life test. Aquat. Toxicol. 100, 160–167 [DOI] [PubMed] [Google Scholar]
- Yang D., Lauridsen H., Buels K., Chi L. H., La Du J., Bruun D. A., Olson J. R., Tanguay R. L., Lein P. J. (2011). Chlorpyrifos-oxon disrupts zebrafish axonal growth and motor behavior. Toxicol. Sci. 121, 146–159 [DOI] [PMC free article] [PubMed] [Google Scholar]
Associated Data
This section collects any data citations, data availability statements, or supplementary materials included in this article.


