

Abstract
A characterization method based on Rayleigh wave propagation was developed for the quantification of the frequency-dependent viscoelastic properties of soft materials at high frequencies; i.e., up to 4 kHz. Planar harmonic surface waves were produced on the surface of silicone rubber samples. The phase and amplitude of the propagating waves were measured at different locations along the propagation direction, which allowed the calculation of the complex Rayleigh wavenumbers at each excitation frequency using a transfer function method. An inverse wave propagation problem was then solved to obtain the complex shear/elastic moduli from the measured wavenumbers. In a separate, related investigation, dynamic indentation tests using atomic force microscopy (AFM) were performed at frequencies up to 300 Hz. No systematic verification study is available for the AFM-based method, which can be used when the dimensions of the test samples are too small for other existing testing methods. The results obtained from the Rayleigh wave propagation and AFM-based indentation methods were compared with those from a well-established method, which involves the generation of standing longitudinal compression waves in rod-shaped test specimens. The results were cross validated and qualitatively confirmed theoretical expectations presented in the literature for the frequency-dependence of polymers.
INTRODUCTION
The viscoelastic properties of soft biomaterials and tissue are needed to understand their behavior in biological conditions. For example, the mechanical properties of hydrogels used in cell culture and tissue engineering should approximately match those of the tissue they replace (Vanderhooft et al., 2009; Heris et al., 2012). The need to characterize the frequency-dependent properties of soft materials is especially important in the field of voice production. The fundamental frequency of vocal fold vibrations can reach up to a few kHz in singing (Titze, 1994). Laser Doppler velocimetry of the human vocal folds during phonation has revealed significant vibration energy at frequencies up to 3 kHz (Chan et al., 2013). Therefore, the mechanical properties of vocal fold tissue and injectable biomaterials used for vocal fold repair need to be characterized at frequencies up to 3 kHz. These biomaterials are mostly gel-like materials, thus standard measurement techniques such as tensile testing and dynamic mechanical analysis are not suitable for mechanical characterization. Parallel-plate rheometry has been mostly used to characterize the viscoelastic properties of this type of materials (Chan and Titze, 1998; 1999; Klemuk and Titze, 2004; Titze et al., 2004; Caton et al., 2007; Kimura et al., 2010; Miri et al., 2012). This method is limited to frequencies below 250 Hz, and thus does not cover the entire phonation frequency range.
Characterization methods based on wave propagation have been recently introduced to measure the viscoelastic properties of soft materials (Catheline et al., 2004; Chen et al., 2004; Chen et al., 2009; Nenadic et al., 2011a; Nenadic et al., 2011b). For example, Chen et al. (2004) developed a method to calculate the shear elasticity and viscosity of homogeneous materials through shear wave dispersion ultrasound vibrometry (SDUV). Cylindrical shear waves at different frequencies were generated in a medium using an ultrasound transducer. The propagation speed was determined from the phase distribution of the propagating shear wave. The complex stiffness of the medium was determined using the Voigt viscoelastic model. Chen et al. (2009) used a pulse echo ultrasound to perform SDUV in vitro in bovine muscle. In vivo SDUV measurements were also performed in a swine liver using an intermittent pulse sequence. In these methods, only the phase of the propagating wave was measured at different locations along the propagation direction. The decrease in the amplitude of the propagating wave with distance, which takes place in viscoelastic media due to dissipation, was not measured nor included in the model. Thus real values were obtained for the wave propagation speeds. The wave speeds and consequently the wavenumbers in viscoelastic media should be complex (Borcherdt, 2009). In the end, an approximate rheological model was used to perform the regression of the measured data to obtain the complex shear modulus of the medium. This yields only a constant value for the shear elasticity and viscosity over the frequency range of interest.
In the present study, a novel model-independent characterization method based on Rayleigh wave propagation was developed for the quantification of frequency-dependent viscoelastic properties of soft biomaterials. Planar harmonic Rayleigh waves were launched on the surface of a silicone rubber sample using an actuator. In contrast with previous studies, both the phase and amplitude of the propagating surface (Rayleigh) wave were measured at different locations. These two independent parameters were simultaneously considered in the modeling via the transfer function method, and thus complex values for the Rayleigh wavenumber (or propagation speed) were obtained at each excitation frequency. The complex wavenumber includes information about both the propagation and dissipation of the wave at different frequencies. Eventually, the frequency-dependent complex shear/elastic moduli were calculated using a dispersion relation obtained from the solution of the inverse wave propagation problem.
Atomic force microscopy (AFM) is a well-known technique for imaging surface topography and capturing forces with sub-nanoscale resolution. The atomic force microscope can be used as a nano- and micro-indentor to characterize the mechanical properties of materials. It has been used to measure the local elasticity of soft materials including hydrogels, living cells and soft tissues (Dimitriadis et al., 2002; Mahaffy et al., 2004; Stolz et al., 2004). The advantages of AFM-based indentation over conventional indentation and other techniques include (1) a greater signal-to-noise ratio, required to capture indentation curves for very soft materials; (2) dimensional sensitivity to characterize samples with hierarchical structures at different scales; (3) the ability to correlate topography with the local elasticity; and (4) the need for only a small volume of material, on the order of few micro-liters; and (5) the capability for high throughput characterizations.
One main challenge of using AFM for soft material characterization is to identify the exact point of contact, especially in the presence of van der Waals forces (Rahmat and Hubert, 2010). These forces can induce non-contact interaction stresses between the contacting bodies over distances on the order of a few nanometers. Contact stresses are dominant for larger indentation depths, where non-contact interaction stresses are negligible (Rahmat et al., 2012). Models based on Hertz theory were found to be applicable for predictions of the relationship between indentation force and probe depth, yielding errors of less than 2% (Rahmat et al., 2012). Dynamic viscoelastic properties can be measured by applying sinusoidal indentation at higher frequencies with small oscillation amplitudes (Mahaffy et al., 2004).
AFM has been previously used to characterize the viscoelastic properties of biomaterials and tissues through nano-indentation. However, the accuracy of this method has not been carefully tested over other independent dynamic measurement methods. Therefore, AFM-based nano-indentation was implemented in the present study to measure the viscoelastic properties of the same rubber materials tested with the Rayleigh wave propagation method through Hertz contact theory in the frequency range from 20 to 300 Hz. Unlike wave propagation based methods, AFM allows of viscoelastic measurements for very small tissue and biomaterial samples in different media.
For evaluation purposes, a third characterization method, which involves the generation of standing longitudinal compression waves in a rod-shaped test specimen, was adopted from an earlier study (Park et al., 2003). The transfer function between the velocities at the two ends of the sample was used to determine the complex wavenumber. The complex elastic modulus was calculated analytically from the measured complex wavenumber. The longitudinal wave propagation method was evaluated qualitatively via investigation of the variations of obtained viscoelastic properties of silicone rubber samples by frequency, composition, and pre-tension. The consistency and quality of the results, presented in the following sections, suggested the use of results from this method to verify the accuracy of the other two methods. Therefore, the results obtained from the Rayleigh wave propagation and AFM-based nano-indentation methods were compared quantitatively with those obtained from the longitudinal wave propagation method and cross validated.
METHODS
Rayleigh wave propagation method
Theoretical background
Rayleigh waves are surface waves which are confined near stress-free boundaries in half spaces. They involve interactions between compressional and shear waves (Achenbach, 1973). To model their propagation in viscoelastic materials, the medium is assumed to be linear, isotropic, and macroscopically homogeneous. The constitutive equations may be written as
| (1) |
where σij and εij are stress and strain tensor components, δij is the Kronecker delta symbol, and (ω) and (ω) are complex, frequency-dependent Lame functions. These are determined according to the relations
| (2a) |
| (2b) |
in which (ω) = G′(ω) + i(ω) is the complex shear modulus, and ν is the Poisson's ratio of the medium. Wave motion in the medium is governed by Navier's equation (Achenbach, 1973)
| (3) |
subject to the appropriate boundary conditions. Here, ρ is the density of the specimen, and u is the displacement vector that can advantageously be expressed as the sum of the gradient of a scalar potential and the curl of a vector potential
| (4) |
with the condition . Because of the two-dimensional nature of the problem; i.e., the translational invariance of the problem geometry along the x3-axis of the coordinate system (see Fig. 1), we may assume ψ = (0,0,ψ). Applying the above decomposition, Eq. 4, into Eq. 3 allows separation of the governing equation of motion into the classical Helmholtz equations
where the quantities ϕ and ψ are the compressional and the shear wave potentials (Graff, 1975). The complex wavenumbers, and , are expressed as (Graff, 1975)
| (6) |
in which and are complex compressional and shear wave speeds, respectively. The relevant displacement components in a Cartesian coordinate system are expressed in terms of these potentials through
and the corresponding stresses in the viscoelastic medium are
| (8a) |
| (8b) |
| (8c) |
where
Figure 1.

(Color online) Schematic of the Rayleigh wave propagation concept. The interactions between compressional and shear waves propagating inside the medium cause Rayleigh waves near stress-free boundaries. Because of the dissipative behavior of the medium, the amplitude of the propagating surface wave decreases with distance.
The quantities ϕ and ψ must satisfy the boundary conditions on the surface of the medium. One proper set of potentials is (Kundu, 2004)
in which A1 and A2 are the amplitudes of the existing potentials, and is the complex Rayleigh wavenumber. Harmonic time variation was assumed with the e−iωt factor omitted for simplicity. Note that ϕ and ψ decrease as x2 increases, which satisfies the requirement that the Rayleigh waves must be confined to regions near the medium surface. Substitution of Eq. 9 into Eq. 5 yields
| (10a) |
| (10b) |
The specific boundary conditions that need to be satisfied on the stress-free boundary (i.e., at x2 = 0) are σ12 = 0 and σ22 = 0. Consequently, utilization of the stress relations in the boundary conditions yields
| (11a) |
| (11b) |
Manipulation and simplification of Eqs. 11a and 11b lead to the following dissipation equation, ensuring nontrivial solutions for A1 and A2:
| (12) |
where
| (13) |
and .
The Poisson's ratio of the silicone rubber, ν, was assumed to be 0.4 (Zörner et al., 2010). It can easily be shown that if ξ = ξR < 1, then k1 and k2 are real values. In this case, a Rayleigh wave with a velocity propagates near the free surface of the medium. From the Rayleigh wavenumber, and after substitution of Eq. 9 into Eq. 7, the displacement components at the free surface of the medium (x2 = 0) are obtained as
| (14a) |
| (14b) |
The transfer function method
A schematic of the experimental apparatus designed and built to investigate the Rayleigh wave propagation method is shown in Fig. 2. An actuator connected to a shaker was used to generate a planar Rayleigh wave on the surface. The actuator motion was measured using a PCB accelerometer attached to the shaker. The sample surface motion was measured with a Polytec laser Doppler vibrometer (LDV). The amplitude and phase of the propagating waves were measured at several locations along the propagation direction. The real and imaginary parts of the Rayleigh wavenumber, , were calculated from the transfer function between the vertical displacements, u2, at two different locations along the propagation direction, x1, on the surface of the sample, as
where L is the distance between two locations on the surface of the sample (i.e., ), and and φ are the amplitude and phase of the transfer function which is defined as
| (16) |
Figure 2.
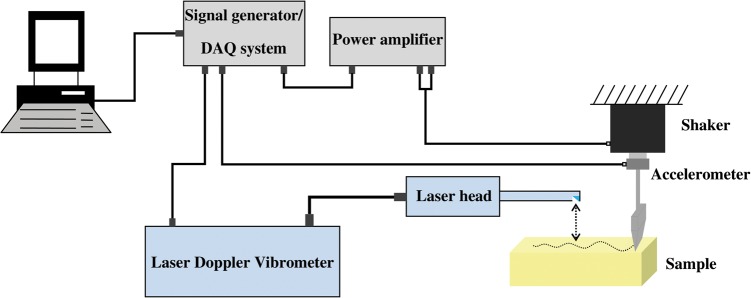
(Color online) Schematic of the test setup for the Rayleigh wave propagation experiments. A linear actuator was used to produce planar Rayleigh waves on the surface of a rubber sample. The sample is fixed to the superior surface of an optical table to minimize extraneous disturbances. The input vibrations of the actuator and the motion of the sample surface were measured using an accelerometer and a laser Doppler vibrometer, respectively.
The shear wavenumber was obtained from Eqs. 12, 13 in terms of the Rayleigh wavenumber. Finally, the complex shear and elastic moduli and the loss factor of the medium were calculated from
| (17a) |
| (17b) |
| (17c) |
Atomic force microscopy (AFM)
The experiments were performed using a Veeco multimode atomic force microscope with a NanoScope V controller. Thin layers of silicone rubber samples were fabricated on microscope glasses. The thickness of the samples was approximately 30 μm. Stiff and soft colloidal probes were used. The stiff probe had a silicone cantilever with a nominal spring constant of k = 1.79 N/m and a polystyrene spherical tip of 10 μm radius. The soft probe had a Si3N4 cantilever with a nominal spring constant of k = 0.06 N/m and a polystyrene spherical tip of 4.5 μm radius. The probes were purchased from Novascan Technologies, Inc. (Ames, IA). The deflection sensitivity of the piezoelectric actuator was defined by probing the hard surface of the glass substrates. The spring constant of the soft tip cantilevers was calibrated using the thermal noise method. The spring constant of the stiffer probe was calibrated using an indirect method (Sader et al., 1999).
Figure 3 shows a schematic of the AFM operating in contact mode. A constant voltage was initially applied to the piezoelectric actuator to move the probe to a specific indentation depth. Subsequently, an input triangular waveform voltage signal of small amplitude with a fundamental frequency ranging from 1 to 300 Hz was applied to the piezoelectric actuator, causing oscillations of the cantilever of the AFM probe at the same frequency. The output voltage signal, which indicated the cantilever deflection, was recorded using photodiodes that capture the laser beam reflected from the cantilever. The indentation depth was calculated from the input and output signals, and the applied force was calculated from the output signal. The measurements could only be performed at frequencies up to 300 Hz due to hardware limitations. The frequency of excitation can be extended to several kHz using an additional module. High frequency characterization using the AFM will be the subject of future work.
Figure 3.
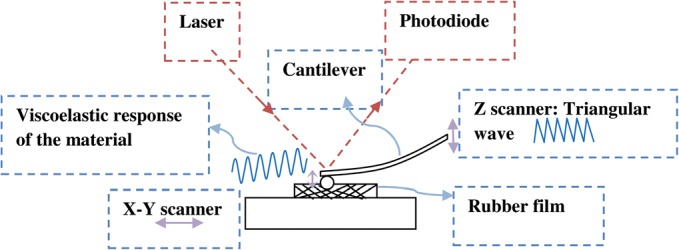
(Color online) Schematic of the operation of the AFM in contact mode. The base of the cantilever oscillated within the amplitude range of 10–30 nm and the frequency range of 10–300 Hz. The material response to the oscillatory deformation resulted in deflection of the cantilever. This was measured using a laser beam reflected from the back of the cantilever to a photodiode detector. The amplitude of the cantilever deflection is correlated with the dynamic elastic modulus of the indented material. The phase difference between the input triangular signal and cantilever deflection was used to measure the loss modulus of the material.
The Hertzian contact theory was used to extract the viscoelastic properties. The model relates the deformation force to the indentation depth. The Hertz formulation for spherical tips was used (Mahaffy et al., 2004)
| (18) |
where R is the radius of the tip, δ is the indentation depth, and K, which depends on the Young's modulus, E, and the Poisson's ratio, ν, of the cantilever, is defined as
| (19) |
This model is valid if the indenter shape is paraboloid and the indentation depth is less than 10% of the sample thickness (Mahaffy et al., 2000). To carry out the frequency-dependent measurements, an oscillation signal (f > 10 Hz) with low amplitude (δ* = 10–30 nm) was fed to the piezoelectric actuator, which was connected to the base of the cantilever. The sample deformation amplitude and phase was measured to determine the viscoelastic properties of the sample. The total indentation, δ, was calculated from
| (20) |
where δ0 is the static indentation depth.
The force, F, in Eq. 18, was decomposed into a steady component, F0, and an oscillatory component, . The dynamic complex elastic modulus was obtained at each frequency, f, from a Taylor series expansion of Eq. 18,
| (21) |
The Poisson's ratio of the silicone rubber under study, ν, was assumed to be 0.4. The characterizations were performed for oscillation amplitudes of 10 nm (small amplitude) and 30 nm (large amplitude).
Validation
A longitudinal wave propagation method was implemented for evaluation purposes. A schematic of the experimental apparatus is shown in Fig. 4. Rod-shaped samples with a square cross-section were attached at one end of a PCB accelerometer, which was connected to a linear actuator. The actuator generated longitudinal compressional waves in the sample at a known frequency. A LDV was used to measure the velocity of a lumped mass attached to the other end of the sample. The effect of the attached mass on the vibration of the sample was taken into consideration through the use of the appropriate boundary conditions in the analytical model.
Figure 4.
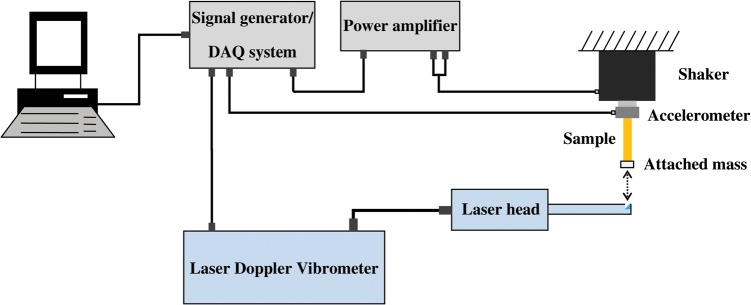
(Color online) Schematic of the test setup for the longitudinal wave propagation experiments. A linear actuator produced longitudinal waves in rod-shaped rubber samples with a square cross section at a known frequency. The vibrations of the two ends of thesample were measured using an accelerometer and a laser Doppler vibrometer.
In this method, a standing longitudinal compression wave is considered. A uniform displacement is assumed in the direction transverse to that of wave propagation (Pritz, 1982; Madigosky and Lee, 1983). The solution of the longitudinal wave propagation problem with appropriate boundary conditions relates the measured transfer function to the imaginary and real parts of the wavenumber through (Pritz, 1982)
where is the complex wavenumber, is the transfer function between the velocity at the two ends of the sample, L is the length of the sample, and m and M are the specimen and termination masses, respectively. The iterative Newton-Raphson method was used to solve Eq. 22 to calculate the imaginary and real parts of the wavenumber.
Based on the definition of the wavenumber, the frequency-dependent relation between the complex wavenumber and the elastic modulus may be written as
| (23) |
in which is the complex longitudinal wave speed, , and is the frequency-dependent complex elastic modulus (dynamic modulus) of the viscoelastic sample, determined using
| (24) |
The loss factor is proportional to the ratio of the energy dissipated and the energy stored for dynamic loading (Lakes, 2009). It was calculated as the ratio of the imaginary part of the complex elastic modulus to its real part as follows:
| (25) |
To minimize noise, the measurements were performed independently at single frequencies. Small experimental errors (i.e., noise) may cause large deviations in the measured viscoelastic properties (Park et al., 2003). Mechanical vibrations were generated by the actuator and transmitted through the set-up structure. This contaminated the LDV-measured motion of the sample bottom, especially at high frequencies. To address this problem, the LDV was decoupled from the experimental set-up through the use of a vibration isolation support. Because of wave dissipation within the material, the length of the sample did not exceed a few wavelengths to obtain a sufficiently high vibration signal at the mass end. With no external mass attached, the vibration amplitude decreases exponentially with distance as . The relationship between sample length and vibration amplitude is more complex when an external mass is attached to the sample.
RESULTS AND DISCUSSION
Homogeneous silicone rubber was used as the working medium for verification purposes. Ecoflex 10 Platinum Cure Silicone Rubber, one part A to one part B, was used. The mixing ratio of these two parts was unity. Silicone thinner was added to achieve a bulk modulus similar to values reported for commercial phonosurgical biomaterials and cadaveric human vocal fold cover; i.e., a few kPa over the low frequency range (Chan and Rodriguez, 2008; Kimura et al., 2010). The mixture was evacuated to remove air bubbles. Then, it was molded and cured at room temperature. The cure time needed increased as the amount of silicone thinner used increased.
In the following subsections, the results obtained from the longitudinal wave propagation method are first evaluated qualitatively versus trends reported in the literature for the frequency-dependent properties of polymers. This is performed through the investigation of the variations of obtained viscoelastic properties of silicone rubber samples by frequency, composition, and pre-tension. Afterwards, the results obtained from the Rayleigh wave propagation and AFM-based nano-indentation methods are compared quantitatively with those obtained from the longitudinal wave propagation method and cross validated. Wave propagation experiments were repeated at least five times for each sample. AFM experiments were repeated three times for each sample. The mean value and standard deviation of the results were calculated. For wave propagation methods, standard deviation values were too small to be shown as error bars in Figs. 5678; thus they are presented in Tables 1, TABLE II..
Figure 5.

(a) Elastic modulus and (b) loss factor versus frequency for two different silicone rubber samples using the longitudinal wave propagation method. The results are for the case of zero pre-elongation in the frequency range from 20 Hz to 4 kHz. ◻: sample 1:1:0.5; △: sample 1:1:1; - - -: regression for sample 1:1:0.5; ⋯: regression for sample 1:1:1. (Regressions are to guide the eye.)
Figure 6.

(a) Elastic modulus and (b) loss factor versus frequency for a silicone rubber sample with component ratio of 1:1:0.5 using the longitudinal wave propagation method. The results are presented for different pre-elongations in the frequency range from 20 Hz to 4 kHz. ◻: zero pre-elongation; △: 3% pre-elongation; ◇: 7% pre-elongation; —: regression for zero pre-elongation; - - - : regression for 3% pre-elongation; ⋯: regression for 7% pre-elongation. (Regressions are to guide the eye.)
Figure 7.

(a) Elastic modulus and (b) loss factor versus frequency for silicone rubber samples with component ratio of 1:1:1. The viscoelastic properties were measured in the frequency range from 20 Hz to 4 kHz and 80 Hz to 4 kHz using the longitudinal and Rayleigh wave propagation methods, respectively. ◻: longitudinal wave propagation method, zero pre-elongation; ○: Rayleigh wave propagation method; —: regression for longitudinal wave propagation method, zero pre-elongation; ⋯: regression for Rayleigh wave propagation method. (Regressions are to guide the eye.)
Figure 8.

(a) Elastic modulus and (b) loss factor versus frequency for silicone rubber samples with component ratio of 1:1:0.5 using wave propagation methods and AFM. ◻: longitudinal wave propagation method, zero pre-elongation; •: Rayleigh wave propagation method; ○: AFM, stiff spherical tip, small amplitude oscillations (10 nm); △: AFM, stiff spherical tip, large amplitude oscillations (30 nm); ◇: AFM, soft spherical tip; —: regression for longitudinal wave propagation method, zero pre-elongation; : regression for Rayleigh wave propagation method; - - -: regression for AFM, stiff spherical tip, small amplitude oscillations; ⋯: regression for AFM, stiff spherical tip, large amplitude oscillations; : regression for AFM, soft spherical tip. (Regressions are to guide the eye.)
TABLE I.
Standard deviation values of the measured elastic modulus (kPa) using the wave propagation methods. The results of the longitudinal wave propagation method are for the case of zero pre-elongation.
| Frequency (Hz) | Rayleigh method, sample 1:1:1 | Longitudinal method, sample 1:1:0.5 | Longitudinal method, sample 1:1:1 |
|---|---|---|---|
| 20 | — | 0.764 | 0.355 |
| 40 | — | 0.665 | 0.453 |
| 60 | — | 0.729 | 0.250 |
| 80 | 3.007 | 0.518 | 0.267 |
| 100 | 2.589 | 0.543 | 0.282 |
| 200 | 3.119 | 1.222 | 0.623 |
| 300 | 2.145 | 1.533 | 1.402 |
| 400 | 2.400 | 3.016 | 2.277 |
| 500 | 3.282 | 3.842 | 3.683 |
| 600 | 4.550 | 4.274 | 4.033 |
| 700 | 4.623 | 6.060 | 5.720 |
| 800 | 5.805 | 5.905 | 5.938 |
| 900 | 6.432 | 7.586 | 7.575 |
| 1000 | 7.209 | 9.295 | 9.875 |
| 2000 | 15.86 | 27.17 | 42.99 |
| 3000 | 31.06 | 60.76 | 64.85 |
| 4000 | 52.17 | 110.7 | 115.9 |
TABLE II.
Standard deviation values of the measured loss factor using the wave propagation methods. The results of the longitudinal wave propagation method are for the case of zero pre-elongation.
| Frequency (Hz) | Rayleigh method, sample 1:1:1 | Longitudinal method, sample 1:1:0.5 | Longitudinal method, sample 1:1:1 |
|---|---|---|---|
| 20 | — | 0.0136 | 0.0182 |
| 40 | — | 0.0121 | 0.0177 |
| 60 | — | 0.0120 | 0.0092 |
| 80 | 0.0103 | 0.0084 | 0.0094 |
| 100 | 0.0120 | 0.0084 | 0.0096 |
| 200 | 0.0177 | 0.0186 | 0.0221 |
| 300 | 0.0250 | 0.0265 | 0.0393 |
| 400 | 0.0358 | 0.0431 | 0.0362 |
| 500 | 0.0490 | 0.0375 | 0.0372 |
| 600 | 0.0552 | 0.0311 | 0.0310 |
| 700 | 0.0657 | 0.0288 | 0.0291 |
| 800 | 0.0686 | 0.0218 | 0.0216 |
| 900 | 0.0731 | 0.0211 | 0.0210 |
| 1000 | 0.0744 | 0.0211 | 0.0204 |
| 2000 | 0.0628 | 0.0121 | 0.0171 |
| 3000 | 0.0516 | 0.0108 | 0.0105 |
| 4000 | 0.0527 | 0.0098 | 0.0097 |
Longitudinal wave propagation method
Two samples with component ratios 1:1:0.5 and 1:1:1 (i.e., part A:part B:silicone thinner) were used for the longitudinal wave propagation experiments. The specimens' dimensions, properties and attached mass values are listed in Table TABLE III..
TABLE III.
Sample dimensions, properties and attached mass values for the longitudinal wave propagation experiments.
| Sample | Length (L) [10−3 m] | Cross sectional area [10−6 m2] | Mass (m) [10−3 kg] | Density ρ [kg/m3] | External mass #1 (M1) [10−3 kg] | External mass #2 (M2) [10−3 kg] |
|---|---|---|---|---|---|---|
| 1:1:0.5 | 75 | 36 | 2.92 | 1082 | 0.55 | 1.82 |
| 1:1:1 | 75 | 36 | 2.76 | 1007 | 0.55 | 1.82 |
Figure 5 shows the elastic modulus and loss factor of the two silicone rubber samples. Measurements were done at frequencies up to 4 kHz with no external masses attached (i.e., zero pre-elongation). The viscoelastic behavior of rubbers is highly dependent on their molecular entanglement network, i.e., the coupled configurational motion of neighboring molecules (Lakes, 2009). The magnitude of rubber elastic moduli depends on the configurational rearrangements that occur within the time period of one dynamic loading cycle (Ferry, 1980). The loss factor peaks at a frequency within a region called the transition zone, during which an increase in frequency causes the material to undergo a transition from a rubber- to glass-like consistency. The elastic modulus increases rapidly during the transition, while the loss factor decreases after reaching a maximum value. At frequencies below the transition zone, polymer molecular chains move and slide alongside each other. At higher frequencies (i.e., in the glassy region), only minor molecular adjustment and thus energy dissipation can take place within the period of deformation. In this region, the mechanical behavior of the material is similar to that of elastic solids (Ferry, 1980). As shown in Fig. 5, the addition of silicone thinner yields a lower elastic modulus at low frequencies (below 300 Hz), as expected. Thinning also results in a slight decrease in the frequency of the peak loss factor, which coincides with a lower point of rapid elastic modulus increase. The elastic moduli of the two samples with different ratios are nearly equivalent at high frequencies (above 300 Hz). This is consistent with the fact that the viscoelastic properties in the transition region depend on the rearrangements of sufficiently short molecular segments. Thus, the cross links between the molecular chains, and consequently the molecular weight or its distribution, do not significantly affect the viscoelastic behavior of the rubber at high frequencies (Lakes, 2009).
The elastic modulus and loss factor of silicone rubber with a component ratio of 1:1:0.5 are shown in Fig. 6 for different pre-elongations. At low frequencies (below 300 Hz), the pre-elongation caused a small decrease in the elastic modulus because of the strain-softening behavior of the material. Greater pre-elongations caused the frequency of the peak loss factor to migrate at slightly lower frequencies. This resulted in inflection points of elastic modulus to occur at lower frequencies and therefore a greater elastic modulus at high frequencies (above 300 Hz). This is because the increasing pre-stress increases the viscoelastic relaxation time (Ferry, 1980), which is inversely related to the frequency of the peak loss factor. The segmental mobility of polymer molecular chains depends on the fractional free volume. As the free volume decreases with pre-stress, the mobility of the segments and thus the energy loss decreases within the loading cycle period. As a result, the overall loss factor decreased with increased pre-elongation.
Rayleigh wave propagation method
Silicone rubber with a component ratio of 1:1:1 was used for Rayleigh wave propagation experiments. Table TABLE IV. shows specimen dimensions and properties.
TABLE IV.
Sample dimensions and properties for the Rayleigh wave propagation experiments.
| Sample | Length [10−3 m] | Width [10−3 m] | Height [10−3 m] | Mass (m) [10−3 kg] | Density ρ[kg/m3] |
|---|---|---|---|---|---|
| 1:1:0.5 | 102 | 51 | 51 | 288.6 | 1088 |
| 1:1:1 | 102 | 51 | 51 | 268.2 | 1011 |
Figure 7 shows the elastic modulus and loss factor of silicone rubber samples obtained from both experimental methods. Results from the Rayleigh wave propagation method were obtained at frequencies between 80 Hz and 4 kHz. The elastic modulus and loss factor values were found to be in good agreement with those obtained from the longitudinal wave method. The discrepancies were less than 10% for the loss factor and 17% for the elastic modulus (except at 200 Hz). Silicone rubber with a component ratio of 1:1:0.5 was also tested. The differences between the results from the two methods were within the same range as for the previous case.
The amplitude of Rayleigh waves decreases exponentially with depth. The rate of decrease is a function of frequency and of the viscoelastic properties of the medium at the frequency of interest. At higher frequencies (greater Rayleigh wavenumbers) the amplitude of longitudinal and transverse motions corresponding to Rayleigh waves generally decreases faster with depth. For example, the calculated amplitude of the propagated Rayleigh waves in the silicone rubber sample under study at a location 1 cm below the sample surface is about 28, 10, and 8% of that of the surface at 100, 500, and 1000 Hz, respectively. The obtained overall (bulk) mechanical properties are representative over a depth commensurate with the Rayleigh waves penetration.
It is noteworthy that the real part of the wavenumber, calculated from the phase difference between any two locations from Eq. 15, was consistent. In contrast, the consistency was not as good for the imaginary part, which varied slightly for different measurement locations. To address this, an exponential decay function was fitted to the oscillation amplitudes at several locations along the propagation direction. The imaginary part of the wavenumber, which has a significant effect on the value of the imaginary part of the complex elastic modulus and loss factor, was found through the combined use of this function and Eq. 15. The results obtained using this method were in agreement with those from the longitudinal wave propagation method at low frequencies. Significant differences were found at high frequencies. The amplitude of the propagated surface waves was very small at high frequencies, and comparable to the rigid body motion amplitude of the sample with respect to the mold, which was caused by the actuator contact force. To account for this motion, the vibration amplitude at locations on the sample surface was measured far from the actuator. The oscillation amplitudes at distant locations were almost uniform and did not decay exponentially as do propagated surface waves near the actuator. Subtraction of the unwanted rigid body motion yields the imaginary part of the wavenumber. The resulting loss factor values were then found to be closer to those obtained from the longitudinal wave method.
An error analysis was performed to investigate the sensitivity of the results obtained from the wave propagation methods to the experimental errors from different sources such as the data acquisition system, accelerometer, LDV, scale, Vernier, and so on. As seen in Table TABLE V., the maximum error was about 12% at the lowest investigated frequency, 20 Hz, for the longitudinal wave method. As the frequency was increased, the error generally decreased for both methods and was less than 1% at frequencies greater than 100 Hz. This is because the error in frequency measurements (ω) was smaller at higher frequencies, where the sampling frequency was the same. Furthermore, the magnitudes of the measured vibrations were greater at higher frequencies, which reduced the error in measured velocities and accelerations from the LDV and accelerometer. The errors were slightly smaller for the Rayleigh wave method, due to smaller errors in the sample dimension and density measurements; i.e., samples had greater dimensions and weights in this case. The errors were comparable for other silicone compositions and sample pre-elongations.
TABLE V.
Measured complex elastic modulus and the possible experimentally induced error (kPa) using the wave propagation methods. The results of the longitudinal wave propagation method are for the case of zero pre-elongation.
| Frequency (Hz) | Rayleigh method, sample 1:1:1 | Longitudinal method, sample 1:1:1 |
|---|---|---|
| 20 | — | (8.898 + 4.059i) ± (0.623 + 0.499i) |
| 40 | — | (11.34 + 5.025i) ± (0.381 + 0.176i) |
| 60 | — | (12.54 + 5.794i) ± (0.339 + 0.222i) |
| 80 | (14.61 + 6.714i) ± (0.203 + 0.096i) | (13.37 + 6.345i) ± (0.225 + 0.070i) |
| 100 | (14.47 + 6.886i) ± (0.164 + 0.080i) | (14.10 + 6.835i) ± (0.193 + 0.102i) |
| 200 | (23.33 + 11.32i) ± (0.158 + 0.059i) | (15.57 + 8.627i) ± (0.115 + 0.092i) |
| 300 | (27.66 + 22.22i) ± (0.149 + 0.068i) | (28.05 + 22.07i) ± (0.169 + 0.075i) |
| 400 | (43.47 + 31.42i) ± (0.146 + 0.127i) | (45.55 + 33.02i) ± (0.172 + 0.146i) |
| 500 | (73.49 + 61.21i) ± (0.211 + 0.177i) | (73.67 + 54.83i) ± (0.129 + 0.124i) |
| 600 | (90.07 + 60.07i) ± (0.250 + 0.216i) | (100.8 + 78.14i) ± (0.277 + 0.240i) |
| 700 | (155.8 + 99.44i) ± (0.324 + 0.246i) | (143.0 + 104.2i) ± (0.385 + 0.304i) |
| 800 | (186.6 + 128.1i) ± (0.418 + 0.307i) | (197.9 + 142.9i) ± (0.474 + 0.377i) |
| 900 | (211.5 + 151.6i) ± (0.475 + 0.368i) | (252.5 + 177.3i) ± (0.522 + 0.427i) |
| 1000 | (274.6 + 176.1i) ± (0.558 + 0.434i) | (329.1 + 224.8i) ± (0.620 + 0.528i) |
| 2000 | (1192 + 600.7i) ± (1.841 + 1.264i) | (1433 + 819.4i) ± (2.094 + 1.473i) |
| 3000 | (3001 + 1352i) ± (3.097 + 2.853i) | (3242 + 170.2i) ± (3.525 + 3.250i) |
| 4000 | (5648 + 2642i) ± (5.483 + 5.379i) | (5795 + 2838i) ± (6.255 + 6.179i) |
Atomic force microscopy (AFM)
The viscoelastic properties of a silicone rubber sample with a component ratio of 1:1:0.5 were measured using the atomic force microscope at frequencies up to 300 Hz. The results were compared to those from the wave propagation methods, as shown in Fig. 8. The trends in elastic modulus and loss factor values obtained from AFM are in good agreement with those from the wave propagation methods. Variations were found in the results obtained from stiff and soft tips. The oscillation amplitude also affected the results. The average of the values obtained from the AFM-based indentation method using different probes and oscillation amplitudes (at each frequency) was compared to averages from the wave propagation methods. The differences between these values were less than 10% for the elastic modulus and 15% for the loss factor, except at 20 Hz where it was 40%.
The depths probed by the Rayleigh wave propagation and AFM-based indentation methods are different. Thus these two methods may not necessarily yield the same results for layered or anisotropic materials. The probing depth was generally in the range of several millimeters (at high frequencies) to a few centimeters (at low frequencies) for the Rayleigh wave propagation method, and few micrometers for the AFM method. However, the used silicone rubber was isotropic and macroscopically homogeneous. Therefore, the results were comparable regardless of the depth probed by these methods.
One of the main challenges of using AFM for micro-indentation is to identify the exact point of contact. Significant adhesion was observed in the force curve, which may have caused errors in the measurement of the elastic modulus. This may explain why the standard deviations of the results obtained from AFM were much larger than those obtained from wave propagation methods. A strategy of backward curve fitting was used to extract the depth of contact (δ0) (Lin et al., 2007).
The imposition of small oscillation amplitudes was not feasible for softer tips because of a low signal-to-noise (S/N) ratio. Therefore, the stiffer cantilever provided better results at low frequencies. At high frequencies, the sample material became stiffer, requiring larger oscillation amplitudes to obtain a sufficient S/N ratio. Results from soft and stiff cantilevers indicated that AFM-based indentation is sensitive to probe selection and oscillation amplitude due to unknown forces and interactions at nanoscale. The loss factor trends obtained with larger oscillation amplitudes appeared to be more accurate than for smaller oscillation amplitude.
A stiffer cantilever with larger oscillation amplitudes (30 nm) seems to be preferable. The errors for both the elastic modulus and loss factor increased with frequency. One major source of experimental error for the AFM originates from the force measurements. According to Hooke's law, the force depends on the stiffness and the deflection of the cantilever. The thermal tuning method used for the calculation of the stiffness of the softer beam is susceptible to 5%–10% error coming from the inaccuracy in positioning the laser beam at the trailing edge of the cantilever. This error is constant for all frequencies. The inverse method used for the calibration of the stiffer cantilever is also susceptible to errors greater than 10% (Kim et al., 2010). Another source of error arises from the measurement of the cantilever deflection. This error is due to AFM hardware limitations. The sampling frequency of the force measurements could not be varied and was constant for a period of a second. The number of samples per cycle at a frequency of 1 Hz was thus 1024, whereas it was only 64 at 300 Hz. This may explain the increased error at high frequencies.
The adhesiveness of the silicone-based samples caused significant errors in the elastic modulus estimates. Preliminary studies on porcine and rat vocal fold tissue, however, show very small adhesion between the probe and the sample. This suggests that the AFM based technique could possibly be applied without such adhesion problems for the characterization of the viscoelastic properties of tissue.
For biomaterials and tissue, however, the probe diameter should be modified to obtain more accurate results. For example, vocal fold tissue is very porous (pore size ∼5–10 μm) compared to silicone materials (<0.5 μm). Therefore, the probe diameter should be larger than 20 μm to ensure representative data. Since the required force increases with the diameter of the probe [see Eq. 18], a stiffer cantilever (k > 1 N/m) would be needed.
CONCLUSIONS AND PERSPECTIVES
Conclusions
A novel experimental method based on Rayleigh wave propagation was developed for the quantification of the frequency-dependent viscoelastic properties of soft biomaterials at high frequencies. Soft silicone materials with characteristics similar to phonosurgical biomaterials and cadaveric human vocal folds were used for evaluation purposes. The complex elastic modulus and loss factor were determined at frequencies up to 4 kHz. An AFM-based nano-indentation method, suitable for measurements of the viscoelastic properties of small tissues and biomaterials, was also investigated at frequencies up to 300 Hz.
A well-established longitudinal wave propagation method was used to evaluate the Rayleigh wave propagation and AFM-based methods. This method was first evaluated qualitatively. The influence of a static load and of the composition of the silicone rubber was investigated, and yielded results in excellent agreement with theoretical expectations for the class of polymers used. The results from the three methods were then quantitatively compared and cross-validated. The elastic modulus and loss factor trends were in very good agreement with established dynamic viscoelastic models such as the Havriliak-Negami model (Havriliak and Negami, 1966).
Perspectives for future works
The Rayleigh wave propagation method is useful for the characterization of gel-like injectable biomaterials used for vocal fold augmentation and repair such as commercial phonosurgical biomaterials (Cymetra, Radiesse, Juvederm, and Restylane) and hydrogels designed in our group (Heris et al., 2012). This method also offers the capacity for non-invasive measurements of the mechanical properties of human vocal fold tissue in vivo through the processing of high speed images of vibrating vocal folds. However, the experimental set-up developed in this study is not needed for in vivo measurements. Mucosal waves are generated on the surface of vocal folds during phonation. The mucosal wave is a surface wave that propagates on medial and superior surfaces of vocal folds (within the mucosa) during phonation, which has the same nature of Rayleigh waves and includes motion in both the longitudinal and transverse directions with respect to the propagation direction. The mucosal wave propagation speed is determined using the high speed images through an image processing procedure. Then, the Rayleigh wave dispersion equation presented in this study is used to obtain the mechanical properties of vocal fold tissue from the measured mucosal wave propagation speed.
The AFM-based indentation method is a relatively new technique for dynamic material characterization. Although AFM provides high precision data, it is not yet well engineered to obtain accurate elastic modulus values, e.g., the discrepancy between the results from the AFM and wave propagation methods. For a specific sample, optimization of the probe diameter, cantilever stiffness, and oscillation amplitude is critical, supported by the results presented in this paper. Furthermore, more sophisticated models should be developed to improve the accuracy of the calculations.
The results obtained from AFM featured larger variability and errors, but yielded correct trends. The purpose for investigating the AFM-based indentation method is that it requires only a small volume of sample material, and allows local viscoelastic measurements of tissues and biomaterials in different media. One application in the field of voice production is the characterization of viscoelastic properties of rat vocal fold tissue. Rats are commonly used animal models to study vocal fold biology and disease such as scarring and its treatments (Lim et al., 2006; Welham et al., 2008; Quinchia Johnson et al., 2010; Suehiro et al., 2010; Gugatschka et al., 2011). Characterization of the viscoelastic properties of rat tissue is difficult with other measurement methods such as tensile and rheology testing because of small sample size. The AFM-based nano-indentation method can also be used for the characterization of viscoelastic properties of the microgel particles used in injectable biomaterials (Heris et al., 2012).
ACKNOWLEDGMENTS
This research was supported by the National Institute on Deafness and Other Communication Disorders, Grants No. DC005788 and DC008290. The authors acknowledge the help of Professor Francois Barthelat and Dr. Meysam Rahmat for their assistance with the atomic force microscopy measurements. Thanks are also expressed to Alayne Moody for her help proofreading the manuscript.
References
- Achenbach, J. D. (1973). Wave Propagation in Elastic Solids (North-Holland, Amsterdam: ), Chaps. 1, 2, 3, 5. [Google Scholar]
- Borcherdt, R. D. (2009). Viscoelastic Waves in Layered Media (Cambridge University Press, New York: ), Chaps. 1, 2, 3, 8. [Google Scholar]
- Catheline, S., Gennisson, J. L., Delon, G., Fink, M., Sinkus, R., Abouelkaram, S., and Culioli, J. (2004). “ Measurement of viscoelastic properties of homogeneous soft solid using transient elastography: An inverse problem approach,” J. Acoust. Soc. Am. 116, 3734–3741. 10.1121/1.1815075 [DOI] [PubMed] [Google Scholar]
- Caton, T., Thibeault, S. L., Klemuk, S., and Smith, M. E. (2007). “ Viscoelasticity of hyaluronan and nonhyaluronan based vocal fold injectables: Implications for mucosal versus muscle use,” Laryngoscope 117, 516–521. 10.1097/MLG.0b013e31802e9291 [DOI] [PubMed] [Google Scholar]
- Chan, A., Mongeau, L., and Kost, K. (2013). “ Vocal fold vibration measurements using laser Doppler velocimetry,” J. Acoust. Soc. Am. 133, 1667–1676. 10.1121/1.4789937 [DOI] [PMC free article] [PubMed] [Google Scholar]
- Chan, R. W., and Rodriguez, M. L. (2008). “ A simple-shear rheometer for linear viscoelastic characterization of vocal fold tissues at phonatory frequencies,” J. Acoust. Soc. Am. 124, 1207–1219. 10.1121/1.2946715 [DOI] [PMC free article] [PubMed] [Google Scholar]
- Chan, R. W., and Titze, I. R. (1998). “ Viscosities of implantable biomaterials in vocal fold augmentation surgery,” Laryngoscope 108, 725–731. 10.1097/00005537-199805000-00019 [DOI] [PubMed] [Google Scholar]
- Chan, R. W., and Titze, I. R. (1999). “ Hyaluronic acid (with fibronectin) as a bioimplant for the vocal fold mucosa,” Laryngoscope 109, 1142–1149. 10.1097/00005537-199907000-00026 [DOI] [PubMed] [Google Scholar]
- Chen, S., Fatemi, M., and Greenleaf, J. F. (2004). “ Quantifying elasticity and viscosity from measurement of shear wave speed dispersion,” J. Acoust. Soc. Am. 115, 2781–2785. 10.1121/1.1739480 [DOI] [PubMed] [Google Scholar]
- Chen, S., Urban, M. W., Pislaru, C., Kinnick, R., Zheng, Y., Yao, A., and Greenleaf, J. F. (2009). “ Shearwave dispersion ultrasound vibrometry (SDUV) for measuring tissue elasticity and viscosity,” IEEE Trans. Ultrason. Ferroelectr. Freq. Control 56, 55–62. 10.1109/TUFFC.2009.1005 [DOI] [PMC free article] [PubMed] [Google Scholar]
- Dimitriadis, E. K., Horkay, F., Maresca, J., Kachar, B., and Chadwick, R. S. (2002). “ Determination of elastic moduli of thin layers of soft material using the atomic force microscope,” Biophys. J. 82, 2798–2810. 10.1016/S0006-3495(02)75620-8 [DOI] [PMC free article] [PubMed] [Google Scholar]
- Ferry, J. D. (1980). Viscoelastic Properties of Polymers (Wiley, New York), Chaps. 2, 10, 11, 12. [Google Scholar]
- Graff, K. F. (1975). Wave Motion in Elastic Solids (Ohio State University Press, Columbus: ), Chaps. 5, 6. [Google Scholar]
- Gugatschka, M., Kojima, T., Ohno, S., Kanemaru, S. I., and Hirano, S. (2011). “ Recruitment patterns of side population cells during wound healing in rat vocal folds,” Laryngoscope 121, 1662–1667. 10.1002/lary.21817 [DOI] [PubMed] [Google Scholar]
- Havriliak, S., and Negami, S. (1966). “ A complex plane analysis of α-dispersions in some polymer systems, in transitions and relaxations in polymers,” J. Polym. Sci., Part C: Polym. Symp. 14, 99–117. 10.1002/polc.5070140111 [DOI] [Google Scholar]
- Heris, H. K., Rahmat, M., and Mongeau, L. (2012). “ Characterization of a Hierarchical Network of Hyaluronic Acid/Gelatin Composite for use as a Smart Injectable Biomaterial,” Macromol. Biosci. 12, 202–210. 10.1002/mabi.201100335 [DOI] [PMC free article] [PubMed] [Google Scholar]
- Kim, M. S., Choi, J. H., Kim, J. H., and Park, Y. K. (2010). “ Accurate determination of spring constant of atomic force microscope cantilevers and comparison with other methods,” Measurement: J. Int. Meas. Confederation 43, 520–526. 10.1016/j.measurement.2009.12.020 [DOI] [Google Scholar]
- Kimura, M., Mau, T., and Chan, R. W. (2010). “ Viscoelastic properties of phonosurgical biomaterials at phonatory frequencies,” Laryngoscope 120, 764–768. 10.1002/lary.20816 [DOI] [PMC free article] [PubMed] [Google Scholar]
- Klemuk, S. A., and Titze, I. R. (2004). “ Viscoelastic properties of three vocal-fold injectable biomaterials at low audio frequencies,” Laryngoscope 114, 1597–1603. 10.1097/00005537-200409000-00018 [DOI] [PubMed] [Google Scholar]
- Kundu, T. (2004). Ultrasonic Nondestructive Evaluation: Engineering and Biological Material Characterization (CRC Press, Boca Raton: ), Chap. 1. [Google Scholar]
- Lakes, R. S. (2009). Viscoelastic Materials (Cambridge University Press, New York: ), Chaps. 3, 7, 8. [Google Scholar]
- Lim, X., Tateya, I., Tateya, T., Muñoz-Del-Río, A., and Bless, D. M. (2006). “ Immediate inflammatory response and scar formation in wounded vocal folds,” Ann. Otol. Rhinol. Laryngol. 115, 921–929. [DOI] [PubMed] [Google Scholar]
- Lin, D. C., Dimitriadis, E. K., and Horkay, F. (2007). “ Robust Strategies for Automated AFM Force Curve Analysis—II: Adhesion-Influenced Indentation of Soft, Elastic Materials,” J. Biomech. Eng. 129, 904–912. 10.1115/1.2800826 [DOI] [PubMed] [Google Scholar]
- Madigosky, W. M., and Lee, G. F. (1983). “ Improved resonance technique for materials characterization,” J. Acoust. Soc. Am. 73, 1374–1377. 10.1121/1.389242 [DOI] [Google Scholar]
- Mahaffy, R. E., Park, S., Gerde, E., Käs, J., and Shih, C. K. (2004). “ Quantitative analysis of the viscoelastic properties of thin regions of fibroblasts using atomic force microscopy,” Biophys. J. 86, 1777–1793. 10.1016/S0006-3495(04)74245-9 [DOI] [PMC free article] [PubMed] [Google Scholar]
- Mahaffy, R. E., Shih, C. K., MacKintosh, F. C., and Käs, J. (2000). “ Scanning probe-based frequency-dependent microrheology of polymer gels and biological cells,” Phys. Rev. Lett. 85, 880. 10.1103/PhysRevLett.85.880 [DOI] [PubMed] [Google Scholar]
- Miri, A. K., Mongrain, R., Chen, L. X., and Mongeau, L. (2012). “ Quantitative assessment of the anisotropy of vocal fold tissue using shear rheometry and traction testing,” J. Biomech. 45, 2943–2946. 10.1016/j.jbiomech.2012.08.030 [DOI] [PMC free article] [PubMed] [Google Scholar]
- Nenadic, I. Z., Urban, M. W., Aristizabal, S., Mitchell, S. A., Humphrey, T. C., and Greenleaf, J. F. (2011a). “ On Lamb and Rayleigh wave convergence in viscoelastic tissues,” Phys. Med. Biol. 56, 6723–6738. 10.1088/0031-9155/56/20/014 [DOI] [PMC free article] [PubMed] [Google Scholar]
- Nenadic, I. Z., Urban, M. W., Mitchell, S. A., and Greenleaf, J. F. (2011b). “ Lamb wave dispersion ultrasound vibrometry (LDUV) method for quantifying mechanical properties of viscoelastic solids,” Phys. Med. Biol. 56, 2245–2264. 10.1088/0031-9155/56/7/021 [DOI] [PMC free article] [PubMed] [Google Scholar]
- Park, J., Siegmund, T., and Mongeau, L. (2003). “ Viscoelastic properties of foamed thermoplastic vulcanizates and their dependence on void fraction,” Cell. Polym. 22, 137–156. [Google Scholar]
- Pritz, T. (1982). “ Transfer function method for investigating the complex modulus of acoustic materials: Rod-like specimen,” J. Sound Vib. 81, 359–376. 10.1016/0022-460X(82)90245-0 [DOI] [Google Scholar]
- Quinchia Johnson, B., Fox, R., Chen, X., and Thibeault, S. (2010). “ Tissue regeneration of the vocal fold using bone marrow mesenchymal stem cells and synthetic extracellular matrix injections in rats,” Laryngoscope 120, 537–545. 10.1002/lary.20782 [DOI] [PMC free article] [PubMed] [Google Scholar]
- Rahmat, M., Ghiasi, H., and Hubert, P. (2012). “ An interaction stress analysis of nanoscale elastic asperity contacts,” Nanoscale 4, 157–166. 10.1039/c1nr11294e [DOI] [PubMed] [Google Scholar]
- Rahmat, M., and Hubert, P. (2010). “ Interaction stress measurement using atomic force microscopy: A stepwise discretization method,” J. Phys. Chem. C 114, 15029–15035. 10.1021/jp104993f [DOI] [Google Scholar]
- Sader, J. E., Chon, J. W. M., and Mulvaney, P. (1999). “ Calibration of rectangular atomic force microscope cantilevers,” Rev. Sci. Instrum. 70, 3967–3969. 10.1063/1.1150021 [DOI] [Google Scholar]
- Stolz, M., Raiteri, R., Daniels, A. U., VanLandingham, M. R., Baschong, W., and Aebi, U. (2004). “ Dynamic elastic modulus of porcine articular cartilage determined at two different levels of tissue organization by indentation-type atomic force microscopy,” Biophys. J. 86, 3269–3283. 10.1016/S0006-3495(04)74375-1 [DOI] [PMC free article] [PubMed] [Google Scholar]
- Suehiro, A., Hirano, S., Kishimoto, Y., Tateya, I., Rousseau, B., and Ito, J. (2010). “ Effects of basic fibroblast growth factor on rat vocal fold fibroblasts,” Ann. Otol. Rhinol. Laryngol. 119, 690–696. [DOI] [PubMed] [Google Scholar]
- Titze, I. R. (1994). Principles of Voice Production (Prentice-Hall, Englewood Cliffs: ), Chap. 7. [Google Scholar]
- Titze, I. R., Klemuk, S. A., and Gray, S. (2004). “ Methodology for rheological testing of engineered biomaterials at low audio frequencies,” J. Acoust. Soc. Am. 115, 392–401. 10.1121/1.1631941 [DOI] [PubMed] [Google Scholar]
- Vanderhooft, J. L., Alcoutlabi, M., Magda, J. J., and Prestwich, G. D. (2009). “ Rheological properties of cross-linked hyaluronan-gelatin hydrogels for tissue engineering,” Macromol. Biosci. 9, 20–28. 10.1002/mabi.200800141 [DOI] [PMC free article] [PubMed] [Google Scholar]
- Welham, N. V., Lim, X., Tateya, I., and Bless, D. M. (2008). “ Inflammatory factor profiles one hour following vocal fold injury,” Ann. Otol. Rhinol. Laryngol. 117, 145–152. [DOI] [PubMed] [Google Scholar]
- Zörner, S., Kaltenbacher, M., Lerch, R., Sutor, A., and Döllinger, M. (2010). “ Measurement of the elasticity modulus of soft tissues,” J. Biomech. 43, 1540–1545. 10.1016/j.jbiomech.2010.01.035 [DOI] [PubMed] [Google Scholar]