Abstract
Several measures of sound source localization performance of 45 listeners with normal hearing were obtained when loudspeakers were in the front hemifield. Localization performance was not statistically affected by filtering the 200-ms, 2-octave or wider noise bursts (125 to 500, 1500 to 6000, and 125 to 6000 Hz wide noise bursts). This implies that sound source localization performance for noise stimuli is not differentially affected by which interaural cue (interaural time or level difference) a listener with normal hearing uses for sound source localization, at least for relatively broadband signals. This sound source localization task suggests that listeners with normal hearing perform with high reliability/repeatability, little response bias, and with performance measures that are normally distributed with a mean root-mean-square error of 6.2° and a standard deviation of 1.79°.
INTRODUCTION
With the introduction of bilateral cochlear implants (CIs) and the use by many patients of both hearing aids and CIs, more and more sound source localization studies are being conducted. These are in addition to studies involving listeners using hearing aids only and those studies testing listeners with normal hearing. Many listener populations are best studied when sounds are presented from loudspeakers in a free-field rather than over headphones. Many such studies use sound-source identification tasks in which listeners indicate which loudspeaker from an array of loudspeakers presented the sound. Often investigators are interested in the relative roles interaural time differences (ITDs), interaural level differences (ILDs), and/or both play in sound source localization (e.g., the finding that CI users use predominately ILD cues, e.g., see Grantham et al., 2007). A common method used in the free-field to implicate ITD or ILD processing is to filter the sounds, i.e., sound source localization of low-pass noise would presumably be based on ITD cues far more than on ILD cues, since ILD cues are small for low-frequency sounds; while sound source localization of high-pass filtered noise would more likely depend on ILD cues which are larger at high frequencies relative to low frequencies and ITD cues are based on fine-structure information which cannot be processed as well in high-frequency as in low-frequency regions. The present study describes sound source identification measures of sound source localization in the azimuthal plane in free field for filtered noises obtained from 45 listeners with normal hearing. One aim of the study is to present a statistical description of sound source localization by listeners with normal hearing in conditions that are similar to many used in the literature, and are likely to be used in the future to study sound source localization in different subject populations. That is, the study describes the type of sound source localization performance one might expect in the free field from listeners with normal hearing. A second aim is to determine the degree to which different filtering conditions effect sound source localization in a normal hearing population, and by inference the degree to which ITD and/or ILD processing differentially affect sound source localization performance. Such a large scale study of sound source localization by listeners with normal hearing using stimuli of different spectral content has not, to the best of our knowledge, been carried out before.
In some recent studies of sound source localization (e.g., Seber et al., 2004; Dunn and Tyler, 2005; Van den Bogaert et al., 2006; Grantham et al., 2007; Litovsky, 2011), listeners were tested in sound treated rooms with loudspeakers located in the front hemifield, with 30° or less separation between adjacent loudspeakers. Low-pass, high-pass, and broadband filtering conditions were sometimes used to implicate ITD (low-pass conditions), ILD (high-pass conditions), or both ITD and ILD (broadband conditions). Different sound source localization performance measures have been tabulated, including error, accuracy, bias, and/or reliability. These are the stimulus conditions and measures studied in this paper.
METHODS
Stimuli and test environment
Testing was done in an 15’ × 11’ acoustically treated room (all 6 surfaces and any other possible sound reflector in the room were lined with 4-in. acoustic foam with a noise reduction coefficient of 0.9) with broadband reverberation times (RT60) of less than 100 ms. Thirteen loudspeakers (Boston Acoustics 110×) were arranged in the front hemifield as shown in Fig. 1. The loudspeakers were located 1.67 m from the center of the listener's head and at the height of the listener's pinna. Loudspeakers #1 and #13 (at the ends of the array) did not produce sound (to reduce edge effects, see Rakerd and Hartmann, 1986), but the listeners did not know this. Thus, the loudspeakers were separated by 15° and filtered noises were presented from 11 locations (#2 to #12) within ±75° of midline (the center loudspeaker; #7).
Figure 1.
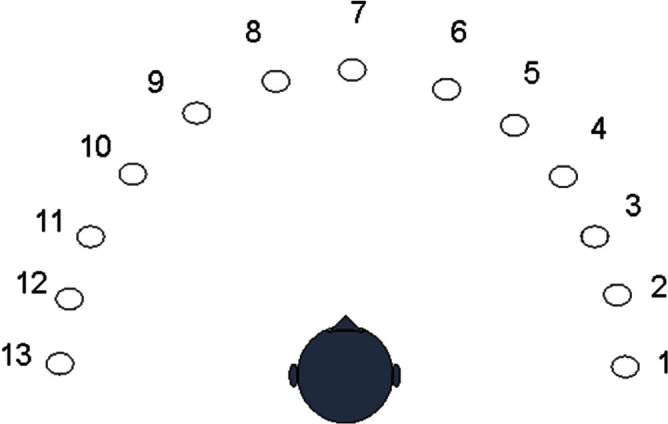
(Color online) Location of the 13 loudspeakers relative to the listener. Loudspeakers #1 and #13 did not produce sound.
White, Gaussian noise was filtered by 8-pole (∼48-dB/Octave) Butterworth bandpass filters (implemented in MATLAB) with cutoffs of 125 to 500 Hz (low-pass), 1500 to 6000 Hz (high- pass), and 125 to 6000 Hz (broadband).1 The noise bursts were 200-ms in duration and shaped with 20-ms raised cosine rise-decay times (to reduce the use of onset cues for sound source localization). The overall level was 65 dBA (measured with a Type 1 sound-level meter using the slow meter reading); the ambient noise level in the room was about 28 dBA. The filtered noise level was randomly roved over a 4-dB range across loudspeakers and stimulus presentations to reduce the effect that overall level differences among the loudspeakers might have on performance [the root-mean-square (rms) overall level difference across the 11 loudspeakers was approximately 2 dB]. Sounds were digitally generated and played from a 12-channel Digital-to-Analog converter (Echo Gina 12, Santa Barbara, CA) running at 44 100 cycles/s per channel.
Subjects
The 45 listeners were between the ages of 21 and 49, and there were 11 males and 34 females. Nineteen of the subjects participated in other experiments in the hearing programs in the department and 16 of those 19 had audiometric tests for hearing loss [these listeners had 25 dB hearing level (HL) or better thresholds at 250 to 8000 Hz in octave steps]. The remaining listeners self-reported that they had no hearing loss. The procedures were approved by the Arizona State University Institutional Review Board for the Protection of Human Subjects.
Procedure
A listener was seated in the center of the loudspeaker array (Fig. 1) and in front of the listener about 2 ft below their head was a computer monitor. The listener used a hand-held keypad to enter responses. A closed circuit video monitored the listener's head movements and the listener was instructed on each stimulus presentation to look straight ahead at the center loudspeaker (#7), and if the listener did not, the listener was reminded again to do so (such reminders were rarely required). After the presentation of a noise burst, listeners entered a number on the keypad between 1 and 13 indicating which loudspeaker presented the sound (the appropriate numbers appeared on each loudspeaker). Sounds from the 11 loudspeakers and the 3 filters were randomly presented in a block of 33 trials (11 loudspeakers × 3 filter conditions) and each loudspeaker and each filter condition was presented once in each block. Four such blocks were run, yielding 132 trials per listener (5940 total trials over the 45 listeners).2 Thus, there were 44 trials presented for each of the 3 filter conditions.
Sound source localization performance measures
The following measures of performance were calculated:
-
(1)
Percent Correct (P[C]): The percent of correct responses which is the number of times a listener correctly indicated the loudspeaker that presented the sound divided by the number of presentations multiplied times 100.
-
(2)
The rms error in degrees: The D calculation of Rakerd and Hartmann (1986) was used: , A is the angle, M is the number of responses, r is the response (1 to 13) on the ith trial, k is the loudspeaker number (#2 to #12). D is averaged over all k loudspeakers.
-
(3)
Signed Bias: The constant error measure E of Raked and Hartmann (1986) was used: ; [same terms as for D(k)].
E is the average over all k loudspeakers. E is an indicator of the bias in locating a loudspeaker sound source, i.e., E > 0 indicates a listener is biased toward indicating loudspeaker locations were left of the loudspeaker that actually presented the sound, E < 0 indicates a bias toward the right, and E = 0 indicates no bias.
-
(4)
Reliability/repeatability (P[C] and rms error): Mean P[C] and rms errors were tabulated for the first 22 presentations (1st-half) of the sounds for each filter condition and then subtracted from the mean measures during the last 22 presentations (2nd-half). This 2nd-1st half comparison is an indication of the degree to which the measures were reliable and repeatable and the degree to which any learning over trials may have occurred.
RESULTS
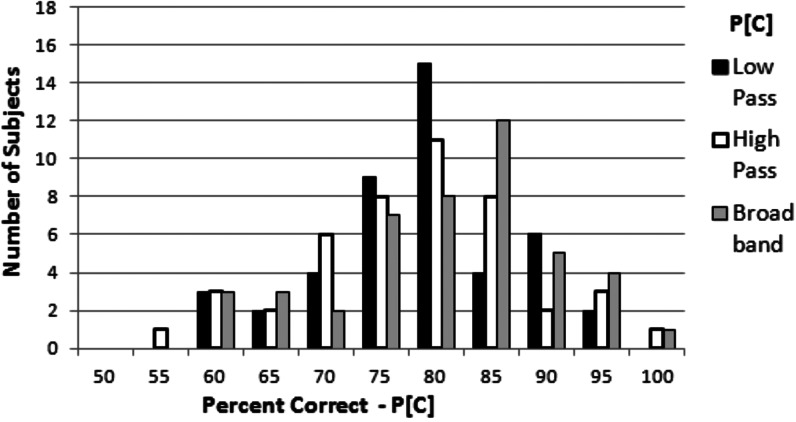
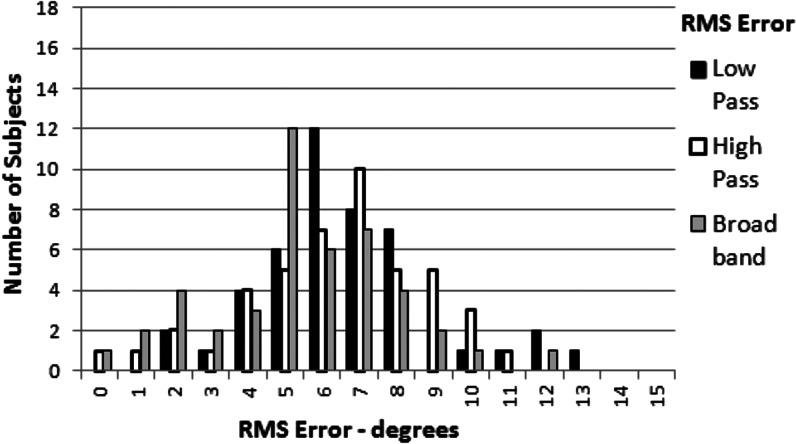
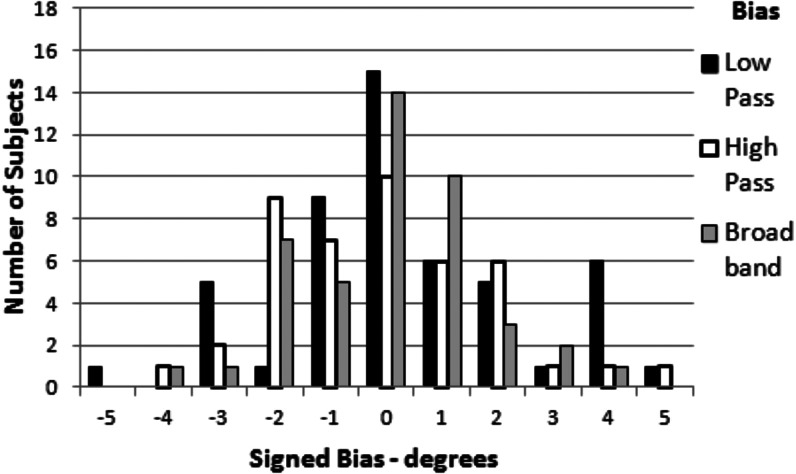
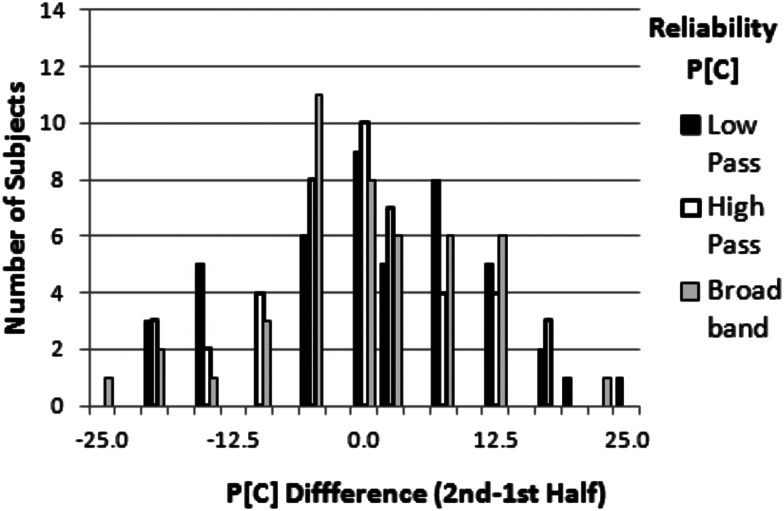
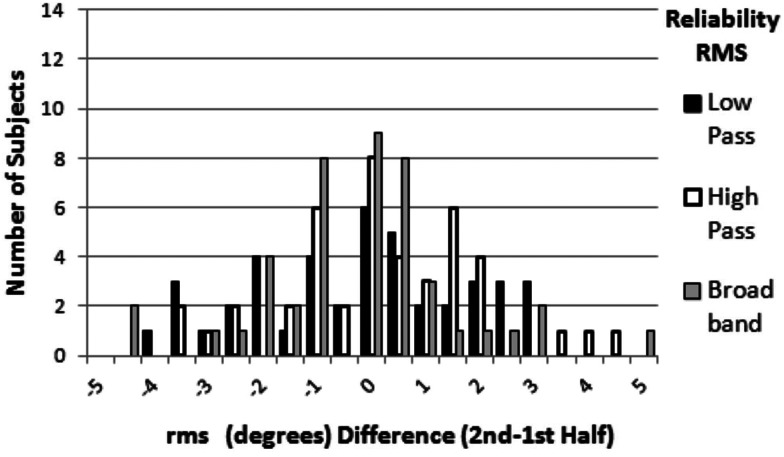
Figures 23456 show the frequency of occurrence distributions of the five measures across the 45 listeners: P[C] (Fig. 2); rms error (Fig. 3); Bias (Fig. 4); reliability of P[C] (Fig. 5), and reliability of the rms error (Fig. 6). In each figure the three filter conditions are represented by different bar colors (black for the low-pass filter condition, white for the high-pass filter condition, and gray for the broadband filter condition).
Figure 2.
Distribution of number of listeners vs P[C] sound source localization for the three filter conditions. Dark bars: Low-pass filter; White bars: High-pass filter; Gray bars: Broadband filter.
Figure 3.
Distribution of the number of listeners vs the rms error in degrees for the three filter conditions. Dark bars: Low-pass filter; White bars: High-pass filter; Gray bars: Broadband filter.
Figure 4.
Distribution of the number of listeners vs signed bias in degrees for the three filter conditions. Dark bars: Low-pass filter; White bars: High-pass filter; Gray bars: Broadband filter.
Figure 5.
Distribution of the number of listeners vs P[C] difference (Split, 2nd-1st half) for P[C] for the three filter conditions. Dark bars: Low-pass filter; White bars: High-pass filter; Gray bars: Broadband filter.
Figure 6.
Distribution of the number of listeners vs the rms (degrees) difference (split, 2nd-1st half) for the rms errors (degrees) for the three filter conditions. Dark bars: Low-pass filter; White bars: High-pass filter; Gray bars: Broadband filter.
The distributions of P[C], rms error, and Bias are about the same for each filter condition and each distribution is approximately unimodal, symmetric, and normal in shape. We used the two-sample Kolmogorov-Smirnov3 test to determine if the distributions for each of the five measures (P[C], rms error, Bias, reliability of P[C], and reliability of the rms error) differed as a function of the three filter conditions (low-pass, high-pass, broadband). The only pair out of the 15 pairwise comparisons (3 pairwise filter comparisons for each of the 5 measures) in which the distributions were statistically different at the 0.05 level of significance was the distributions for P[C] for the low-pass condition as compared to the distribution for P[C] for the broadband condition (this difference was not statistically significant at the 0.01 level of significance). That is, for all other comparisons the distributions of the number of listeners per each value of measurement (Figs. 23456) did not statistically differ across the three filter conditions for the other performance measures.
Table TABLE I. lists summary descriptive statistics for each of the five distributions (see Figs. 23456): mean, median, standard deviation, maximum value, and minimum value. The descriptive statistics of these three distributions suggest that P[C] and the rms error performance are very similar for the low- and high-pass conditions and slightly better in the broadband condition. The distributions and descriptive statistics suggest that Bias is very small, always less than ±5.5° and on average between 0.04° and 0.58° indicating a very small response bias toward the left side of the loudspeaker array for all three filter conditions. Three repeated measures analysis of variance [ANOVA, F(2,44)] were calculated: P[C], rms error, and Bias across the three filter conditions. No main effect of the filter condition was found for any of these three measures at a 0.05 level of significance. Three Pearson-Product correlations were computed for the rms error in degrees among the three filter conditions: The correlation of the rms error between the low- and high-pass filter conditions was 0.69, the correlation between the low-pass and broadband conditions was 0.59, and that between the high-pass and broadband condition was 0.62. All correlations were significantly greater than zero correlation at a 0.001 level of significance suggesting a moderate positive correlation in sound source localization accuracy across filter conditions.
TABLE I.
Descriptive statistics (mean, median, standard deviation, maximum value, and minimum value) are tabled for each of the five measures (P[C]; rms error in degrees; bias in degrees; split (2nd-1st half) for P[C]; and split (2nd-1st half) for rms error. The descriptive statistics are shown for each of the three filter conditions (low-pass, high-pass, and broadband).
| LOW-PASS | P[C] | rms-degs | Bias-degs | Split P[C] | Split rms error |
|---|---|---|---|---|---|
| Mean | 81% | 6.95° | 0.04° | 0.50% | −0.38° |
| Median | 82 | 6.52 | 0.00 | 0.00 | −0.70 |
| SD | 9 | 1.95 | 1.95 | 1.05 | 2.64 |
| Max | 95 | 13.82 | 5.20 | 18.00 | 3.40 |
| Min | 61 | 2.41 | −5.50 | −18.55 | −4.89 |
| HIGH-PASS | P[C] | rms-degs | Bias-degs | Split P[C] | Split rms error |
| Mean | 78% | 6.70° | 0.15° | 1.00% | 0.08° |
| Median | 84 | 7.40 | 0.00 | 0.00 | 0.22 |
| SD | 10 | 2.61 | 1.98 | 1.25 | 2.45 |
| Max | 100 | 11.66 | 5.45 | 23.00 | 3.20 |
| Min | 59 | 0.00 | −5.45 | −23.45 | −4.29 |
| BROADBAND | P[C] | rms-degs | Bias-degs | Split P[C] | Split rms error |
| Mean | 83% | 5.98° | 0.58° | 0.10% | −0.28° |
| Median | 84 | 5.81 | 0.34 | 0.00 | 0.00 |
| SD | 10 | 2.79 | 1.79 | 1.00 | 2.35 |
| Max | 100 | 12.01 | 5.48 | 23.85 | 3.20 |
| Min | 61 | 0.00 | −3.07 | −24.00 | −4.89 |
As indicated above the split 2nd-1st half results suggest no statistical differences in reliability/repeatability across the three filter conditions. The average differences (either means or medians) between P[C] and the rms error between the first half of the trials and the last half of the trials was very close to zero. The distributions were nearly symmetrical about zero difference, indicating minimal evidence that any learning occurred over the course of the experiment for the average listener. The largest absolute change in P[C] was 24% and for the rms error the largest absolute change was 4.89° (see Table TABLE I.).
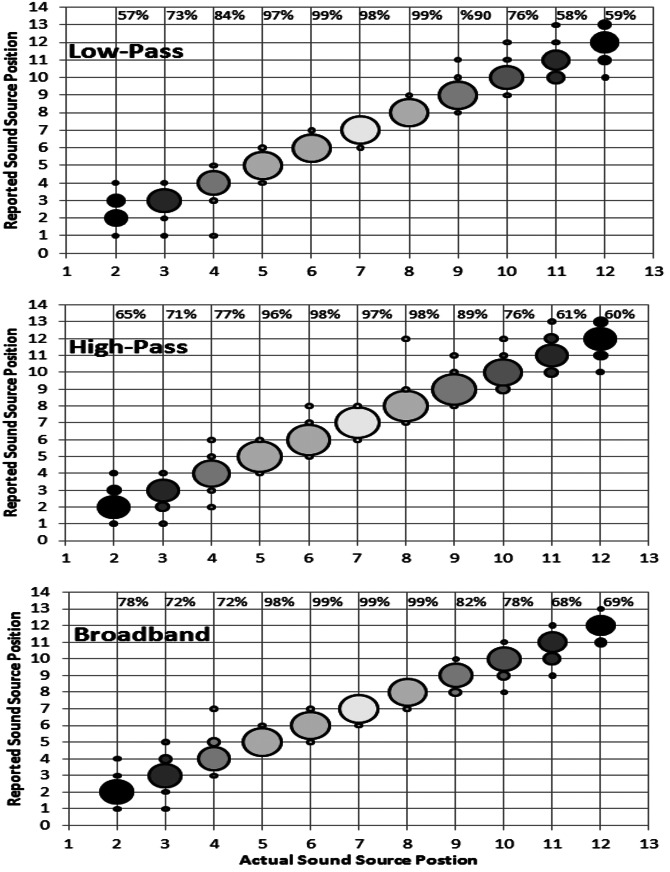
Figure 7 (top panel for the low-pass condition, middle panel for the high-pass condition, and bottom panel for the broadband condition) presents bubble plots of the reported loudspeaker locations for each actual loudspeaker location. The size of the bubble is proportional to the percent of responses for any one location. There were 8 bubble sizes each representing 12.5% of the distribution (e.g., the smallest bubble size represents responses when 12.5% or fewer of the listeners responded with a particular loudspeaker location). The actual percent correct localization responses for each loudspeaker is shown at the top of each panel of Fig. 7. Again there was very little difference in P[C] localizations across the three filter conditions. In all filter conditions listeners' best performance was for the loudspeakers located directly in front (#6 to #8) of the listener, with performance declining as the loudspeaker presenting the sound was further to the right or left of the center (#7) loudspeaker. The distribution of percent correct localizations was nearly left–right symmetrical. For instance, there were no statistical differences at the 0.05 level of significance between the mean P[C] or the mean rms error computed across the 5 loudspeakers that presented sounds from the left of the listener (loudspeakers #8 to #12) as compared to mean performance of the 5 loudspeakers that presented sound from the right of the listener (loudspeakers #2 to #6).
Figure 7.
Bubble plots indicating the percent of loudspeaker locations listeners reported as the sound source location vs the actual loudspeaker that presented the sound. Size of bubble proportional to percent reported (bubble sizes in 12.5% steps; smallest bubble on the plot is 0% to 12.5% and the largest bubble on the plot is 87.5% to 100%). Numbers at the top of each panel represent the percent correct localizations for the loudspeaker location indicated at the left of the percent measure. Data for the three filter conditions are shown (Top panel: Low-pass filter; Middle panel: High-pass filter; Bottom panel: Broadband filter).
Performance as measured by the rms error in degrees and Bias in degrees for all three filter conditions did not differ statistically (0.05 level of significance) as a function of age (i.e., the correlation with age was r = −0.101 for the rms error and r = 0.189 for Bias), gender, whether the listeners had an audiometric measure of their thresholds of hearing or self-reported their hearing loss, or between listeners who participated in other hearing experiments and those who did not. That is, the variability as indicated in Table TABLE I. is relatively small. Since no attempt was made to have a “balanced” listener pool for this study (e.g., balanced by age or gender or hearing loss), it would be difficult to compare in finer detail possible differences in performance based on subject characteristics given the large differences in the number of listeners in any category.
DISCUSSION
One of the objectives of this study was to determine if sound source localization performance for listeners with normal hearing differed as a function of filtering and by inference as a function of ITD and/or ILD processing. While the statistical analysis of the data did not reveal any statistically significant differences, the mean data in Table TABLE I. suggest that the rms error was smaller in the broadband condition than in the high-pass condition, and the rms error was especially smaller in the broadband condition as compared to the low-pass condition. However, the mean rms error difference between the low-pass and broadband conditions was 0.97°. This is less than a just noticeable difference in discriminating between the spatial location of two sound sources [i.e., less than the Minimal Audible Angle (MAA); Mills, 1972; Harris, 1972]. That is, an rms error difference of less than 1° is probably not perceptually significant. Thus, one conclusion of this research is that for the types of sound source localization performance measured in this study, filtering the sound does not affect sound source localization performance. To the degree that filtering influences the use of the interaural cues for sound source localization, ILD and ITD cues produce the same level of localization performance; and there is no perceptual advantage to having both cues available in localizing these sound sources (i.e., the broadband filter condition results are not perceptually different from those of either of the two other filter conditions).
When high-frequency tonal stimuli are presented over headphones with no ILDs, but are amplitude modulated at rates less than approximately 300 Hz, there is good evidence that listeners can use ITDs in the envelope of these amplitude-modulated, high-frequency tones to lateralize the stimuli and to discriminate ITDs (e.g., see Bernstein and Trahiotis, 2002, 2012). It is unlikely that microsecond envelope ITDs at the onsets and/or offsets of the noise bursts used in the present study could be used for sound source localization given that all stimuli were presented with 20-ms rise/fall times. Eberle et al. (2000) have shown that it is highly unlikely that listeners use ongoing ITDs in the envelope of broadband stimuli (similar to ones used in the present study) in sound source localization in the free-field. These data and the use of 20-ms rise–fall times make it unlikely that the listeners in the present study used envelope-ITD cues as a basis for sound source localization. In addition, in the free-field, unlike for headphone-presented stimuli, there are always ILD cues. Thus, in the free field any use of ITD-envelope cues at high frequencies would be in addition to the ILD cues. Very little is known about the extent to which ITD-envelope cues interact with ILD cues for sound source localization in the free field.
Van den Bogaert et al. (2006) found that the mean rms error for 10 normal hearing listeners was lower for a 1/3-octave noise band centered at 500 Hz (13.5° of the rms error) than it was for a 1/3-octave band centered at 5000 Hz (21.3° of the rms error). These rms errors are greater than those obtained in the present study when the noise bandwidths were 2-octaves or wider. However, when a very broadband “telephone” signal was used in the study by Van den Bogaert et al. (2006), the rms error was reduced to 6.8°. This broadband rms error is more consistent with the rms error for localizing the source of the 2-octave and wider noise bursts used in the present study (6.2° rms error). A comparison of the data of Van den Bogaert et al. (2006) and those of the present study suggests that stimulus bandwidth probably plays a role in the acuity of localizing sound sources in the free-field and the extent to which sound source localization performance depends on the frequency region. It appears as if acuity may be poorer when the bandwidth of noise is less than 2-octaves, e.g., for the 1/3 octave noises used by Van den Bogaert et al. (2006). There also may be a difference in sound source localization performance between high- and low-frequency stimuli when the bandwidth is narrow, e.g., when the bandwidth is 1/3 octave wide. These observations are reinforced by data indicating that free-field localization acuity for tonal stimuli is poor as compared to that for broadband stimuli such as clicks and noises, and sound source localization acuity is better for low-frequency tones as compared to high-frequency tones (Blauert, 1997).
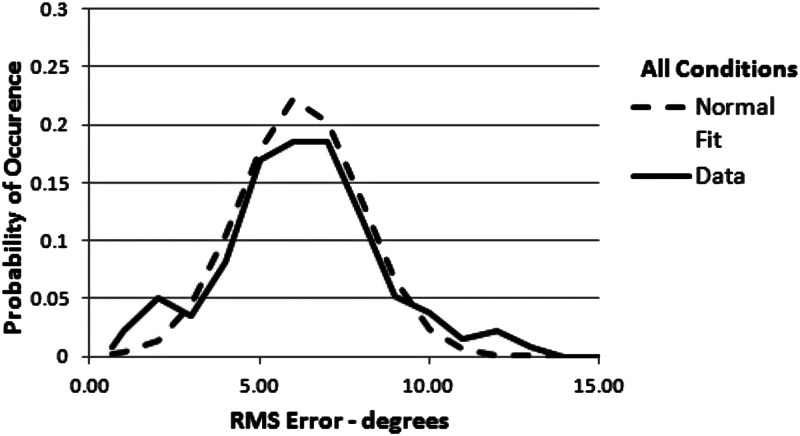
The rms error measure probably best represents sound source localization performance as it takes into account the distribution of errors across the sound sources. The rms error is especially useful if there is little response bias as there was in this study. The probability distribution of the rms error when all of the data from the three filter conditions are combined is shown in Fig. 8 (solid curve). The dotted curve is the best fitting normal distribution for these data (using a least squares' criterion with means determined to the first decimal point between 5.0° and 8.0° and standard deviations to the second decimal point between 0.50° and 3.00°). The goodness of the fit suggests that the rms error is well described by a normal distribution with a mean rms error of 6.2° and a standard deviation of 1.79°. The standard deviation is slightly larger than the smallest MAA of approximately 1.5° (Mills, 1972). A Chi-Square goodness of fit statistical test indicated no statistical difference (at a 0.01 level of significance) between the data and the fitted normal distribution with a probability value of essentially zero (the minimum least squares deviation was 0.00024). This suggests that in a population of people with normal hearing 95% would likely have an rms error between 2.6° and 9.8° (±two standard deviations from the mean). These results are consistent with other measures of sound source localization performance by listeners with normal hearing presented with broadband stimuli (see Middlebrooks and Green, 1991; Blauert, 1997; Van den Bogaert et al., 2006; Grantham et al., 2007). In terms of issues of statistical power based on the rms error, in order to achieve a power of 0.80 given a 0.05 level of significance, the number of listeners with normal hearing one would have to test for an expected sample mean greater than 1.5° (about the smallest measured MAA, see Mills, 1972) from the population mean of 6.2° would be 12 listeners.
Figure 8.
Comparison of the distribution of the rms errors in degrees from all of the data (combined across filter conditions; Data: Solid line) and the best fitting normal distribution (Normal fit: Dashed line). Best fitting normal distribution has a mean of 6.2° and a standard deviation of 1.79°.
In addition to the high reliability/repeatability of this sound source localization test, the test was efficient in that it used a relatively small number of trials (132) and took a relatively short amount of time (approximately 25 min) for any one listener. There was no trend for listeners to either improve their performance over time or for them to perform more poorly at the end of the experiment as compared to the beginning of the experiment. The changes in performance for most of the listeners were very small. For approximately 90% of the listeners P[C] varied by less than ±12.5% from the 1st to the 2nd half of the experiment, and for approximately 90% of the listeners rms error varied less than ±3°.
Listeners might have performed more poorly had head position and movement been more rigidly controlled. Video monitoring indicated that all listeners faced forward before each stimulus presentation. Since stimulus duration was 200 ms there would not have been enough time for a listener to turn and face any of the distal sound source loudspeakers while the sounds were presented. The data in Fig. 7 suggests that listeners did not turn to face these loudspeakers as performance declines as the loudspeaker locations are further from midline as has been reported before (Mills, 1972) when head movements were rigidly controlled. Thus, any differences in performance between the tests used in this study and ones involving more strict control of head movements is likely to be small.
All listeners who agreed to be in the experiment finished the experiment and their data are reported in this paper. There was one listener who made no mistakes in localizing the 11 loudspeakers in the high-pass and broadband filter conditions and the worst performing listener had an rms error of 13.82° (4.2 standard deviations from the mean) for the high-pass condition, and a P[C] of 59% in this condition. Neither the very good nor the poor listener performed outside the range of the distributions of the measures, i.e., they could not be considered outliers in terms of their performance. Thus, this sort of sound source localization test appears to be one that most listeners (∼95%) with normal hearing should be able to complete with an rms error performance between approximately 2.6° and 9.8°.
In summary this study describes the azimuthal sound source localization performance of listeners with normal hearing when the sound sources are in the free field producing a 2-octave or wider filtered noise. The study also suggests that filtering noise in a low-pass, high-pass, or broadband manner is likely to have little effect on sound source localization performance for listeners with normal hearing for relatively broadband stimuli. To the degree that filtering noises influences the use of the interaural cues (ILD and ITD cues), sound source localization for relatively broadband noises is about the same independent of whether or not listeners have access to ITD, ILD, or both interaural cues. If baseline sound localization performance is poorer than that measured for broadband stimuli (e.g., for 1/3 octave stimuli), then it might be that listeners could benefit from being able to use both ITD and ILD cues, but this appears not to be the case for stimuli that are 2 or more octaves wide. In this study, the rms error performance is normally distributed with a mean of 6.2 and a standard deviation of 1.79°.
ACKNOWLEDGMENTS
This research was supported by NIDCD grants to M.D., No. R01 DC 010821; to C.A.B., No. R01 DC 008329; to L.L., No. F31 DC 011684; and an AFOSR grant to W.A.Y. (No. FA9550-12-1-0312).
Footnotes
With an overall level of 65 dBA and a 4500-Hz bandwidth, the high-pass noise had a spectrum level of at most 24 dB sound pressure level (SPL). With a filter roll-off of approximately 48 dB/octave, the spectrum level of the noise at 1000 Hz (near the upper frequency limit for processing ITDs) would be approximately 0 dB SPL, at or below the threshold for detection at 1000 Hz. Thus, it is unlikely that there was any useable energy from the high-pass noise available in the low-frequency region for ITD processing.
Pilot work was done to determine the most efficient task that would produce reliable results in as short a period of time as possible, as this procedure is being used at ASU with several different populations of hearing impaired patients (see Dorman et al., 2012). Since these patients participate in several different experiments, it is important to keep the testing time in any one experiment to a minimum. We also wanted the procedure to be as easy as possible for listeners with normal hearing and yet not yield perfect performance. That is, we wanted to give listeners with hearing impairment the best possible chance at being able to localize sound sources in our testing environment. As the data from the present paper suggest, the procedure produced reliable estimates of performance for listeners with normal hearing.
The two-sample Kolmogorov-Smirnov test (Massey, 1951) is a nonparametric test which tests the null hypothesis that two empirical distributions were drawn from the same population distribution. The distributions need to be continuous, but are otherwise unrestricted.
References
- Bernstein, L. R., and Trahiotis, C. (2002). “ Enhancing sensitivity to interaural delays at high frequencies by using transposed stimuli,” J. Acoust. Soc. Am. 112, 1026–1036. 10.1121/1.1497620 [DOI] [PubMed] [Google Scholar]
- Bernstein, L. R., and Trahiotis, C. (2012). “ Lateralization produced by interaural temporal and insensitive disparities of high-frequency raised-sine stimuli: Data and modeling,” J. Acoust. Soc. Am. 131, 409–415. 10.1121/1.3662056 [DOI] [PMC free article] [PubMed] [Google Scholar]
- Blauert, J. (1997). Spatial Hearing (MIT Press, Cambridge, MA), 494 p. [Google Scholar]
- Dorman, M., Spahr, T., Gifford, R., Cook, S., Zhang, T., Loiselle, L., Yost, W., Cardy, L., Whittingham, J., and Schramm, D. (2012). “ Current research with cochlear implants at Arizona State,” J. Am. Acad. Audiol 23, 385–395. [DOI] [PMC free article] [PubMed] [Google Scholar]
- Dunn, C. C., and Tyler, R. S. (2005). “ Benefit of wearing a hearing aid on the unimplanted ear in adult users of a cochlear implant,” J. Speech Lang. Hear. Res. 48, 668–680. 10.1044/1092-4388(2005/046) [DOI] [PubMed] [Google Scholar]
- Eberle, G., McNally, K. I., Martin, R. L., and Flanagan, P. (2000). “ Localization of amplitude modulated high-frequency noise,” J. Acoust. Soc. Am. 107, 3568–3671. 10.1121/1.429428 [DOI] [PubMed] [Google Scholar]
- Grantham, D. W., Ashmead, D. H., Ricketts, T. A., Labadie, R. F., and Haynes, D. S. (2007). “ Horizontal-plane localization of noise and speech signals by postlingually deafened adults fitted with bilateral cochlear implants,” Ear Hear. 28, 524–541. 10.1097/AUD.0b013e31806dc21a [DOI] [PubMed] [Google Scholar]
- Harris, J. D. (1972). “ A florilegium of experiments on directional hearing,” Acta Oto-Laryngol., Suppl. 298, 1–26. [PubMed] [Google Scholar]
- Litovsky, R. Y. (2011). “ Review of recent work on spatial hearing skills in children with bilateral cochlear implant,” Cochlear Implants Int. 1, 30–34. 10.1179/146701011X13001035752372 [DOI] [PMC free article] [PubMed] [Google Scholar]
- Massey, F. J., (1951). “ The Kolmogorov-Smirnov test for goodness of fit,” J. Am. Stat. Assoc. 46, 68–78. 10.1080/01621459.1951.10500769 [DOI] [Google Scholar]
- Middlebrooks, J. C., and Green, D. M. (1991). “ Sound localization by human listeners,” Annu. Rev. Psychol. 42, 135–159. 10.1146/annurev.ps.42.020191.001031 [DOI] [PubMed] [Google Scholar]
- Mills, A. W. (1972). “ Auditory localization,” in Foundations of Modern Auditory Theory, edited by Tobias J. V. (Academic Press, New York: ), Vol. 2, pp. 301–345. [Google Scholar]
- Rakerd, B., and Hartmann, W. M. (1986). “ Localization of sound in rooms. III: Onset and duration effects,” J. Acoust. Soc. Am. 80, 1695–1706. 10.1121/1.394282 [DOI] [PubMed] [Google Scholar]
- Seeber, B. U., Baumann, U., and Fastl, H. (2004). “ Localization ability with bimodal hearing aids and bilateral cochlear implants,” J. Acoust. Soc. Am. 116, 1698–1710. 10.1121/1.1776192 [DOI] [PubMed] [Google Scholar]
- Van den Bogaert, T., Klasen, T. J., Moonen, M., Van Deun, L., and Wouters, J. (2006). “ Horizontal localization with bilateral hearing aids: Without is better than with,” J. Acoust. Soc. Am. 119, 515–526. 10.1121/1.2139653 [DOI] [PubMed] [Google Scholar]


