

Abstract
The influence of the thyroarytenoid (TA) and cricothyroid (CT) muscle activation on vocal fold stiffness and eigenfrequencies was investigated in a muscularly controlled continuum model of the vocal folds. Unlike the general understanding that vocal fold fundamental frequency was determined by vocal fold tension, this study showed that vocal fold eigenfrequencies were primarily determined by vocal fold stiffness. This study further showed that, with reference to the resting state of zero strain, vocal fold stiffness in both body and cover layers increased with either vocal fold elongation or shortening. As a result, whether vocal fold eigenfrequencies increased or decreased with CT/TA activation depended on how the CT/TA interaction influenced vocal fold deformation. For conditions of strong CT activation and thus an elongated vocal fold, increasing TA contraction reduced the degree of vocal fold elongation and thus reduced vocal fold eigenfrequencies. For conditions of no CT activation and thus a resting or slightly shortened vocal fold, increasing TA contraction increased the degree of vocal fold shortening and thus increased vocal fold eigenfrequencies. In the transition region of a slightly elongated vocal fold, increasing TA contraction first decreased and then increased vocal fold eigenfrequencies.
INTRODUCTION
Although vocal fold approximation has been generally considered a necessary condition to initiate phonation, it has been shown that stiffness conditions in the different layers of the vocal fold are more important in determining the actual vibration pattern (van den Berg and Tan, 1959; Hirano, 1974; Titze and Talkin, 1979; Hirano and Kakita, 1985; Zhang, 2011). This observation was summarized in the body-cover theory of phonation, which argues that different combinations of the contraction levels of the cricothyroid (CT) and thyroarytenoid (TA) muscles can produce different stress conditions in the vocal folds and different voice types. Despite this importance of vocal fold stiffness, there has been no systematic and quantitative investigation of how and to what extent activation of laryngeal muscles, particularly the interaction of the CT and TA muscles, affects the stiffness of the different layers of the vocal folds, and the resulting vibration, acoustics, and voice quality. Our current understanding, based on the body-cover theory, remains largely qualitative. A more quantitative and physically based description of laryngeal muscle activation that is capable of predicting simultaneous changes in vocal fold geometry and stress distribution is necessary to fully understand the role of individual and coordinated laryngeal muscle activation in vocal fold posturing and control of phonation.
Such quantitative and physically based understanding of the muscular regulation of vocal fold geometry and stiffness is particularly important to understanding the pitch control mechanisms during phonation. Although it is generally accepted that activation of the CT muscle increases fundamental frequency (F0), the role of the TA muscle in F0 control still remains controversial. Despite many previous experimental and theoretical investigations, it still remains unclear under what conditions F0 will rise, fall, or stay constant with increasing activity of the TA muscle in humans (Titze et al., 1988). Early models of pitch control are based on the ideal string model of the vocal fold (Titze, 1994), which states that the fundamental frequency of vibration increases with vocal fold tension but decreases with vocal fold elongation. The string model was later extended to a beam model taking into consideration of the effects of bending stiffness (Titze and Hunter, 2004) and hyperelasticity and viscous effects (Zhang et al., 2006b, 2007b). In order to relate fundamental frequency to contractions of the CT/TA muscles, Titze et al. (1988) extended the string model to a body-cover two-layer vocal fold model. In this modified model, although the vocal fold was still simplified as a string, the vocal fold stress now had contributions from both the body and cover layers. In addition to the passive stress, the active stress due to TA contraction was multiplied by an effective vibration depth ratio of the TA muscle and added to the passive stress. With this modified model, they showed that increasing TA activities can either increase or decrease vocal fold eigenfrequencies, depending on the depth of the body layer involved in vibration. However, the effective depth of vibration is a dynamic variable and cannot be determined a priori. It is still unknown how much control humans have over the effective depth of vibration (Titze et al., 1988). In another study, Titze and Story (2002) developed rules that relate muscle activation to the model constants of a bar-plate and a three mass model, and used this model to investigate the influence of CT and TA contraction on the model eigenmodes. This rule-based model was later coupled with a one-dimensional flow model to investigate the influence of CT/TA contraction on vocal fold vibration and acoustics (Lowell and Story, 2006). However, model constants of lumped-element models are difficult to relate to realistic directly measurable variables, and the rules are difficult to translate to vocal fold models of realistic geometry and material properties.
Furthermore, these pitch models may have oversimplified the physics involved in vocal fold vibration. Both the ideal string model and the beam model consider only the anterior-posterior (AP) tension and neglect other stress components, particularly the stress distribution within the transverse plane (the plane perpendicular to the AP direction). The vocal fold length is on average only about 2–3 times of the transverse dimension of the vocal fold so that the dynamics in the transverse plane may not be negligible. Indeed, vocal fold vibration is known to involve deformation primarily in the transverse plane. On the other hand, the lumped-element models such as the two-mass model or the bar-plate model, by design, neglect dynamics along the AP direction. To properly model the complete physics involved, an approach based on continuum mechanics is required. Based on continuum mechanics, three-dimensional continuum models capture the dynamics of vocal fold vibration without making oversimplifying assumptions about the stress conditions during vocal fold vibration. Such an approach was used in previous studies to investigate the in vacuo eigenmodes of the vocal folds (Titze and Strong, 1975; Berry and Titze, 1996; Cook and Mongeau, 2007; Cook et al., 2008; Xue et al., 2011; Zhang, 2011; Bhattacharya and Siegmund, 2012). In these studies, the vocal fold was modeled as a linear elastic material, and the material constants were given as an input variable and were not related to laryngeal muscle contraction. Thus, although vocal fold dynamics in all three dimensions were properly modeled, the influence of laryngeal muscle activation on vocal fold eigenfrequencies was not investigated.
The goal of this study was to develop a continuum finite-element model of laryngeal muscle activation. Although finite-element continuum models have been developed to investigate laryngeal muscle activation (Hunter et al., 2004; Gommel et al., 2007), these studies focused on the influence of muscle activation on vocal fold posturing rather than its influence on vocal fold geometry and stress distribution within the vocal folds. Such changes in vocal fold geometry and stress distribution were investigated in Deguchi et al. (2011), but the effects of CT and TA muscle contraction were modeled as an imposed strain in the AP direction and only the passive stress in vocal fold was calculated. In this study, we focused on the effects of laryngeal muscle activation on vocal fold geometry, stress distribution, and stiffness. We particularly focused on the effects of CT and TA contraction as these two muscles are generally considered the primary regulators of vocal fold geometry and stiffness. A constitutive law of the vocal folds that included both a passive and an active component was developed so that changes in vocal fold geometry and stress distribution within the vocal folds due to muscle activation can be directly calculated. This model was then used to investigate the influence of CT and TA contraction on the in vacuo eigenmodes of the vocal fold. Because phonation onset results from synchronization of the first few eigenmodes (Zhang et al., 2007a; Zhang, 2010), investigation of how muscle activation affects the first few eigenfrequencies would provide insights toward the muscular control mechanisms of phonation frequency.
NUMERICAL METHOD
A sketch of the vocal fold model is shown in Fig. 1. Although the real vocal folds are known to have multiple layers with complex geometry, there has been little data available in the literature, particularly regarding the geometry and material properties of each layer of the vocal folds. Therefore, in this study, a body-cover two-layer simplification of the vocal fold with uniform cross section along the AP direction was used. Unlike the traditional body-cover structure of Hirano (1974), the body layer in this study consisted only of the TA muscle fibers, whereas the cover layer consisted of all other passive soft tissues. The lateral surface of the TA muscle is connected to the thyroid cartilage through a soft tissue layer, accurate modeling of which would require inclusion of this soft tissue layer in the vocal fold model. For simplicity, and in order to study elongation and shortening of the vocal fold, in this study the lateral surface of the vocal fold was constrained in the medial-lateral and inferior-superior directions but was able to slide in the AP direction. As this study focused on the effects of CT/TA contraction, the posterior surface of the vocal fold was fixed, simulating the condition of strong contraction of the lateral cricothyroid muscle and the interarytenoid muscle. The vocal fold was attached anteriorly to a rigid thyroid cartilage layer which was also under the influence of the CT muscle on the other end. The side surfaces of the cartilage layer were constrained in the transverse plane but were allowed to slide in the AP direction.
Figure 1.
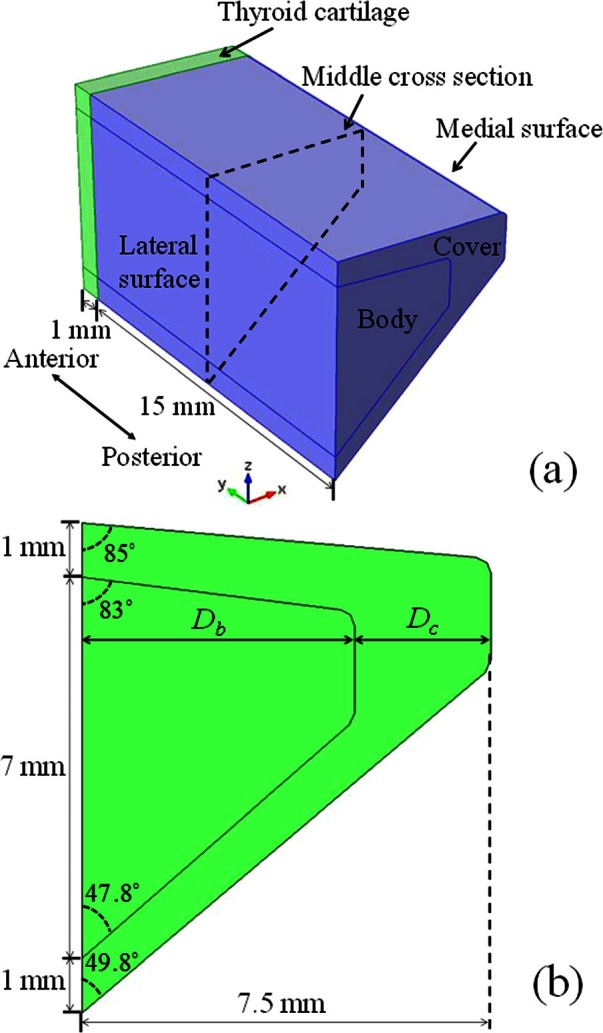
(Color online) A sketch of (a) the vocal fold model and (b) its cross section.
Constitutive equations of the vocal fold
The stress-strain relation of the vocal folds was defined using a strain energy function
| (1) |
where W is the strain energy function, S is the second Piola-Kirchhoff stress tensor, and E is the Lagrangian strain tensor. The strain energy function includes both a passive and an active component
| (2) |
In this study, the passive stress-strain relation of the vocal fold was described using a five-parameter Mooney-Rivlin model
| (3) |
where (i = 1,2) are the modified principal invariants of the deformation tensor (Holzapfel et al., 2000), J is the Jacobian or the volume ratio between the deformed and undeformed vocal fold, and the coefficients c and κ are model constants. For this study, both the vocal fold cover and body layers were assumed nearly incompressible, with κ = 3 MPa. The model constants in Eq. 3 were estimated by curve fitting the experimentally measured stress-strain curve as reported in Zhang et al. (2007a), which was obtained in a tensile testing experiment using an excised human vocal fold cover. The stress-strain curve from the curve-fitted five-parameter Mooney-Rivlin model is shown in Fig. 2a. The estimated model constants are listed in Table TABLE I.. Previous studies have shown that the passive material properties of vocal fold body and cover are comparable (Alipour-Haghighi and Titze, 1991; Chhetri et al., 2011). In this study, for simplicity, the same passive stress-strain relation as in Fig. 2a was used for the whole vocal fold volume including both the CT and TA muscles and the cover layer.
Figure 2.
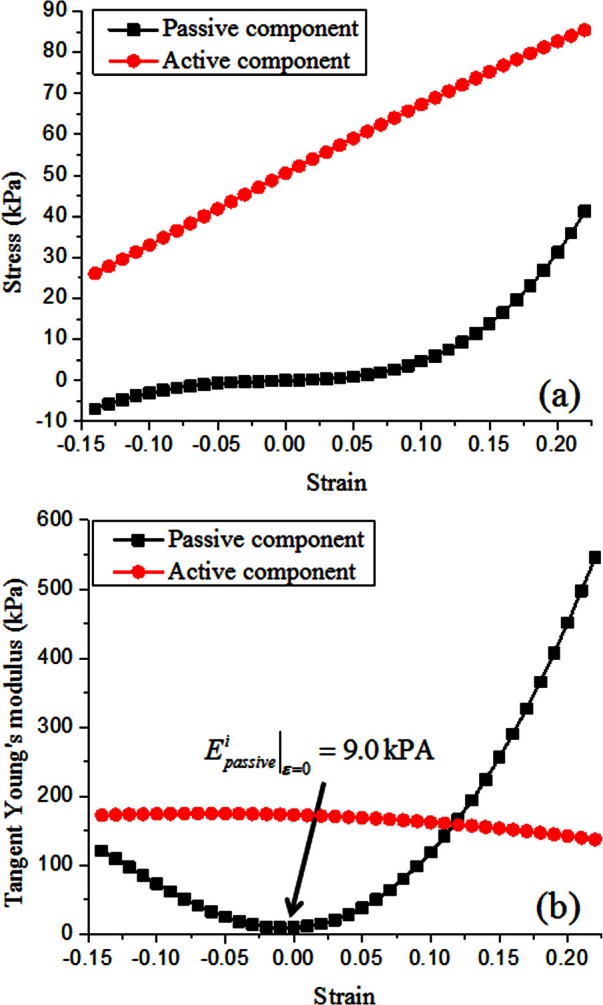
(Color online) (a) The active and passive stress-strain curve of the vocal fold; (b) the active and passive equivalent tangent Young's moduli of the vocal fold as defined in Eq. 15.
TABLE I.
| Parameter value | |
|---|---|
| c10 | 104 Pa |
| c01 | −8.5 × 10³ Pa |
| c11 | −2.5 × 10⁴ Pa |
| c20 | 1.8 × 10⁵ Pa |
| c02 | −7 × 10⁴ Pa |
| 1.05 × 10⁵ Pa | |
| λofl | 1.4 |
The active component of the strain energy function was derived by considering a uniaxial motion due to the activation of an incompressible muscle fiber, in which case the active stress along the fiber direction is related to the fiber stretch as
| (4) |
where λ is the muscle fiber stretch along the fiber direction, and is related to the Cauchy-Green deformation tensor by
| (5) |
where is the direction of muscle fibers. For muscles oriented along the y-direction [e.g., the TA muscle in Fig. 1a], Eq. 5 becomes
| (6) |
In general, the active stress depends on both the strain and strain rate. As this paper focused on the steady-state vocal fold deformation and stress distribution under a given CT/TA activation condition and its influence on vocal fold eigenfrequencies, the active stress was assumed to be independent of the strain rate and scale linearly with the activation level α as
| (7) |
where λofl is the optimal stretch of muscle fiber at which maximum active stress σmax occurs, and is the normalized function of muscle active force. In this study, the normalized function of active force as described in Blemker et al. (2005) was used
| (8) |
In this study, the value of λofl was set to 1.4 as in Blemker et al. (2005). Thus, for a given activation level, the active stress first increases with increasing strain, and reaches the maximum value at the optimal stretch, which occurs at a strain of 0.4 in this study, and then decreases with further increase in strain. The value for was taken from the measurement by Alipour-Haghighi et al. (1989) on canine vocalis muscle. In the simulations of this study, the strain of the TA muscle was found to be less than 0.4. Thus, for a given level of TA contraction, the active stress increased with elongation of the TA muscle [Fig. 2a], which is similar to that experimentally observed for vocal folds (Alipour-Haghighi et al., 1989).
The active component of the strain energy function was obtained by substituting Eqs. 7, 8 into Eq. 4, noting that the active stress is uniaxial along the fiber direction
| (9) |
It should be pointed out that although the passive part is an isotropic constitutive model, the active part is anisotropic. Thus the body layer becomes anisotropic with TA activation.
CT muscle model
Although the CT muscle is oriented primarily in the vertical direction in humans (note that the combined direction vectors of the pars recta and pars oblique are not purely vertical but have a horizontal component), contraction of the CT muscle produces primarily a horizontal force to elongate the vocal fold (Titze, 1994, p. 13). Thus, for simplicity, the effect of CT contraction was modeled in this study as an external distributed force applied horizontally to the anterior surface of the thyroid cartilage layer. Similarly to the TA muscle, the external force exerted on the anterior surface due to CT activation was modeled as
| (10) |
where SA is the cross section area of the CT muscle, αCT is the CT activation level, and is the CT maximum activation stress. The stretch of the CT muscle λCT was calculated as
| (11) |
where LCT = 15 mm is the original length of the CT muscle, which was set as the same length as the TA muscle, and vTh is the average AP displacement of the thyroid cartilage layer. For simplicity, all other material parameters of the CT muscle, including the muscle activation function , were set the same as the TA muscle, except for the maximum active stress for which different values were used (see Table TABLE II.).
TABLE II.
CT/TA activation strength ratio and body-cover depths in the five cases studied.
| CT/TA activation strength | Depth of body/cover layer (mm) | |
|---|---|---|
| Case 1 | : = 2:1 | Db = 5, Dc = 2.5 |
| Case 2 | : = 1:1 | Db = 5, Dc = 2.5 |
| Case 3 | : = 0.5:1 | Db = 5, Dc = 2.5 |
| Case 4 | : = 2:1 | Db = 6, Dc = 1.5 |
| Case 5 | : = 2:1 | Db = 4, Dc = 3.5 |
Pre-stressed eigenvalue analysis
Unlike the eigenvalue analysis of linear materials, for hyperelastic materials effects of initial stress and strain within the vocal folds need to be considered in the eigenvalue analysis, also known as pre-stressed eigenvalue analysis. Thus, in this study, the analysis procedure included two steps. In the first step a static analysis was performed to calculate the static deformation and stress distribution within the vocal folds under a given condition of CT/TA activation. Then, the eigenvalue analysis was performed on the deformed configuration of the vocal fold taking into consideration of the initial stress and strain as obtained from step I.
The governing equation for the pre-stressed eigenvalue analysis is
| (12) |
where [K] and [M] are the stiffness and mass matrices of the vocal fold, respectively, and q is the vector of generalized coordinates. The stiffness matrix can be further divided into two components (Bonet and Wood, 2008)
| (13) |
where [Kc] is the constitutive stiffness matrix, which is determined by the constitutive model, and [Ks] is the initial stress matrix associated with the initial stress in the vocal fold due to static deformation or muscle activation. It should be pointed out that [Ks] is nonzero only when both the initial stress induced by muscle activation and the geometrical nonlinearity of strain are taken into account (Bathe, 1995). Thus, [Ks] disappears when muscles are totally relaxed and the “pre-stressed eigenvalue analysis” reduces to the general eigenvalue analysis for [K] = [Kc].
For nonlinear materials such as the hyperelastic material model used in this study, the [Kc] matrix is a function of vocal fold strain, and thus has different values at different conditions of CT/TA activation. This contrasts with linear materials for which the Young's modulus remains constant during deformation. For convenience of discussion, we defined an equivalent tangent Young's modulus as
| (14) |
which consists of both a passive and an active component
| (15) |
The dependence of the passive and active tangent Young's moduli on corresponding vocal fold strain is shown in Fig. 2b. Note that the minimum passive Young's modulus occurred at conditions of zero strain and increased with change in stress in any directions (either tensile or compressive).
Equation 12 shows that, for a constant mass matrix, vocal fold eigenfrequencies depend on both vocal fold tangent stiffness (the [Kc] term) and vocal fold stress (the [Ks] term). Increasing tangent stiffness increases vocal fold eigenfrequencies. On the other hand, vocal fold tension introduces positive components to the [Ks] matrix and thus increases vocal fold eigenfrequencies, whereas compression introduces negative components and decreases eigenfrequencies. Therefore, the influence of CT/TA activation on vocal fold eigenfrequencies can be studied by considering its influence on both the [Kc] and [Ks] matrices.
Simulation conditions
It is expected that the relative strength between the CT and TA muscles has important effects on the CT/TA interaction and its influence on vocal fold stiffness. Because there has been little data regarding the CT/TA maximum active stress in humans, five cases of different CT/TA relative strength ratios (ratio between the maximum active stress) and body-cover depth ratios were investigated in this study, as shown in Table TABLE II.. Our preliminary simulation results showed that vocal fold eigenfrequencies in case 1 were primarily regulated by the CT muscle, which is similar to that in humans. Thus, case 1 was considered as the baseline condition in this study and the results presented below are from this case unless otherwise noted. The effects of CT/TA strength ratio was investigated by comparing cases 1, 2, and 3, and are discussed in Sec. 3E.
The effects of the body-cover depth ratio were investigated in Sec. 3F by comparing cases 1, 4, and 5, in which cases the total depth of the vocal fold (Db + Dc) was kept constant at 7.5 mm [Fig. 1b], but with varying depth ratio Dc/Db. The same variation range of the depth ratio was also used in the previous study by Mendelsohn and Zhang (2011).
Model implementation and validation
The finite-element model was developed using the commercial software COMSOL. The constitutive laws were defined using user-defined hyperelastic strain energy functions as in Eqs. 3, 9. Triangular prism elements were used to mesh the whole model. Mesh convergence was verified by performing simulations using three different mesh densities, with total number of elements within the vocal fold of 5472, 13 120, and 39 584, respectively. It was found that, for the mesh with 13 120 elements produced, the maximum displacements in all three directions were within 1% of the predictions from the model with the finest mesh. This mesh size of 13 120 elements was thus used for all the results presented in Sec. 3.
Direct quantitative validation of the vocal fold model by comparison to experiments is difficult because it is currently impossible to measure stress distribution within the vocal folds and the exact vocal fold geometry of all layers (particularly, the inner layers) in experiments. Thus, in this study, the vocal fold model was only validated through qualitative comparison to previous experimental observations. Specifically, the elongation experiments as reported in Alipour-Haghighi et al. (1989) were numerically simulated. In that study, the TA muscle was fixed at one end and elongated at the other end along the muscle fiber direction. For each imposed elongation or strain of the TA muscle, a passive AP stress was estimated as the AP stress measured at a condition without TA contraction, whereas a total stress was estimated as the AP stress measured when TA muscle was maximally activated. The difference between these two stress values was used as an estimation of the active stress due to TA contraction. In this study, simulations were performed with similar conditions, i.e., the vocal fold was gradually elongated, and the average AP stress at the posterior surface was calculated with (αTA = 1) and without activation of the TA muscle (αTA = 0), from which the active and passive stresses were estimated in the same way as in Alipour-Haghighi et al. (1989). The active and passive stresses thus estimated, and their ratio as a function of the elongation strain, are shown in Fig. 3. This curve showed a predominant role of the active stress for small strains and this dominance of the active stress decreased with increasing vocal fold elongation. This result was in good agreement with the experimental observation (Figs. 4 and 5 in Alipour-Haghighi et al., 1989), suggesting that the constitutive law of this study was at least adequate for the modeling of laryngeal muscle activation.
Figure 3.
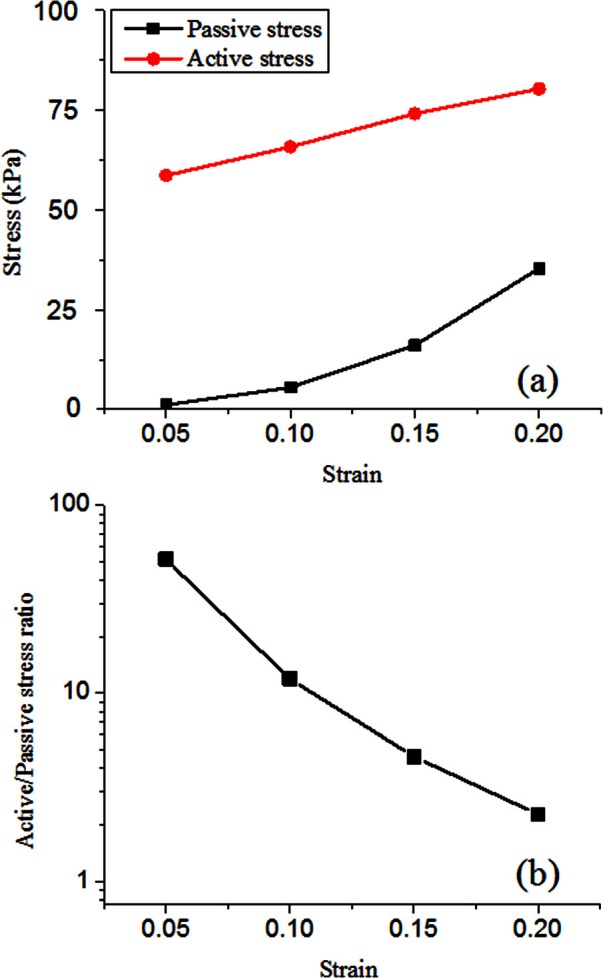
(Color online) (a) The active and passive AP stresses, and (b) their ratio as estimated from the elongation simulations with and without maximum TA contraction, following a similar procedure of the experiments in Alipour-Haghighi et al. (1989).
RESULTS
Vocal fold deformation
Figures 4a, 4b show the contour plots of vocal fold elongation and maximum medial bulging, respectively, as a function of the contraction levels of the CT and TA muscles for case 1. The maximum medial bulging was calculated as the maximum medial-lateral displacement along the medial surface in the middle cross section of the vocal fold. Figure 4a shows that changes in vocal fold length depended on the relative strength of the CT and TA muscles. Contraction of the CT muscle elongated the vocal fold, whereas TA activity shortened the vocal fold. In this case, the CT muscle had the same cross-sectional geometry as the TA muscle but was twice as strong in the maximum activation stress. Therefore, the contour lines for vocal fold elongation were roughly anti-symmetric along the straight line αTA = 2αCT in Fig. 4a, with maximum elongation occurring at αCT = 1 and αTA = 0 and maximum shortening occurring at αCT = 0 and αTA = 1. The contours of vocal fold elongation were similar to those predicted in Titze (1994, Fig. 8.3).
Figure 4.

(Color online) Contours of (a) vocal fold elongation, (b) maximum medial bulging in the middle cross section, (c) the average AP strain εy in the middle cross section, and (d) the average transverse strain εx in the middle cross section in case 1.
Due to incompressibility, changes in vocal fold length were accompanied by changes in the transverse cross-sectional geometry. Specifically, Fig. 4b shows that vocal fold shortening due to strong TA activities caused a maximum medial bulging of 0.7 mm.
Figures 4c, 4d show the average vocal fold strain along the AP direction and within the transverse plane, respectively. As there was no considerable difference between the body and cover layers, the vocal fold strain shown was obtained by averaging over the entire vocal fold middle cross section. In general, the magnitude of the AP strain was larger than that of the transverse strain.
Vocal fold stress distribution
The contour lines for the AP stress distribution within the body and cover layers in case 1 are shown in Fig. 5. As there was only passive stress in the cover layer, the AP stress in the cover layer was primarily determined by changes in vocal fold length. Consequently, the contour lines for the AP stress in the cover [Fig. 5a] were similar to those for vocal fold elongation [Fig. 4a]. Contraction of the CT muscle increased the AP stress in the cover layer, whereas TA contraction decreased it. Maximum AP stress occurred when the vocal fold elongation was maximum at αCT = 1 and αTA = 0, whereas minimum (negative) AP stress occurred at maximum vocal fold shortening at αCT = 0 and αTA = 1.
Figure 5.
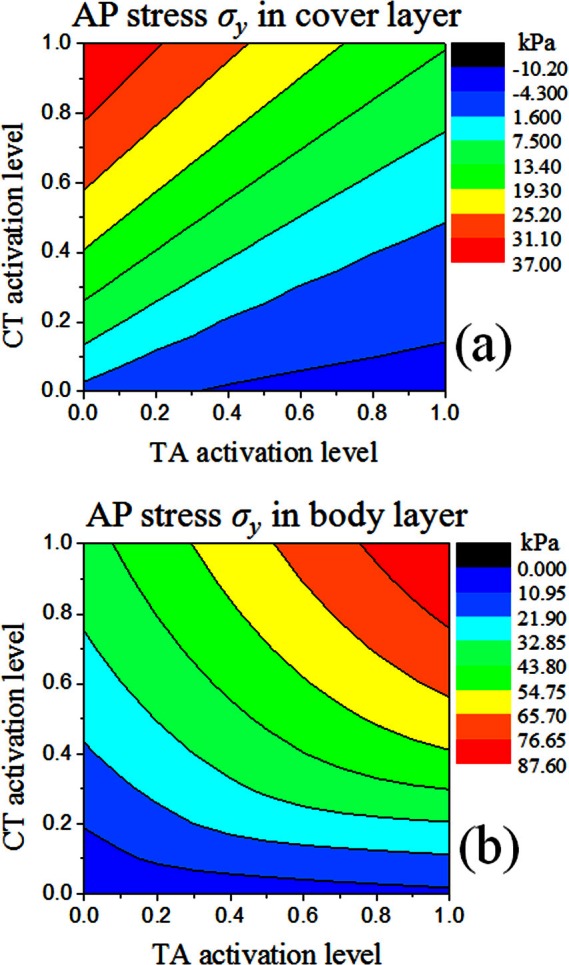
(Color online) Contours of the average AP stress σy in the middle cross section in (a) the cover layer and (b) the body layer in case 1.
For the body layer [Fig. 5b], the AP stress had contributions from both the passive stress due to vocal fold elongation and the active stress from TA contraction. For the strain range observed in this study (0–0.15), the active stress was so large [Fig. 2a] that the total AP stress in the body layer was primarily determined by the active stress except for conditions around the upper left corner in Fig. 5b. Equation 7 shows that the active stress was determined by the normalized active force function , which again depended on the AP strain, and the activation level of the TA muscle. Although TA contraction shortened the vocal folds and reduced the AP strain and the normalized active force function , this decrease was generally small and dominated by the increase in the activation level, especially under conditions of large positive strain at which the rate of active stress increase with strain is small. As for the CT muscle, its contraction elongated the vocal folds and increased the AP strain and thus the AP stress in the body layer. Therefore, unlike that for the cover layer, increased activity in the TA and CT muscles both increased the averaged AP stress in the body layer [Fig. 5b].
Although not shown in this study, the transverse stresses were at least an order of magnitude smaller than the AP stress, with a maximum averaged stress of 600 Pa along the medial-lateral direction and 2500 Pa along the inferior-superior direction. The shear stress was about 10 Pa in the cover layer and about 600 Pa in the body layer.
Tangent Young's moduli
Figure 6 shows the contour levels for the tangent Young's moduli within the transverse plane and along the AP direction for both the body and cover layers of case 1, as calculated according to Eqs. 14, 15.
Figure 6.

(Color online) Contours of (a) the transverse tangent Young's modulus of the cover layer , (b) the transverse tangent Young's modulus of the body layer , (c) the AP tangent Young's modulus of the cover layer , (d) the APtangent Young's modulus of thebody layer , (e) the ratio /, and (f) the ratio /. All data were from case 1.
As the transverse tangent Young's moduli in both layers and the AP tangent Young's modulus in the cover layer contained no contributions from TA activation, the contour plots for these tangent Young's moduli were similar to that of vocal fold elongation. However, a distinction between the Young's moduli and the vocal fold strain was that the minimum values of the tangent Young's moduli were obtained at conditions of zero strain rather than at the largest negative strain, as discussed above in Fig. 2b. As a result, although the tangent Young's moduli generally increased with increasing CT activity and decreasing TA activity, this trend was reversed in the lower right corner of Fig. 6, or conditions of weak or no CT activation. In this region, the tangent Young's moduli increased with increasing TA activity and decreasing CT activity. The contour plot for the AP tangent Young's modulus in the body layer followed a generally similar pattern to other tangent Young's moduli, except that the region of transition exhibited a slightly complex pattern, due to extra contributions from TA activation.
Because there was not much difference in the transverse strain between the body and cover layers, the transverse tangent Young's moduli in these two layers were of the same order of magnitude for all CT/TA conditions. The tangent Young's moduli along the AP direction were in general higher than the transverse Young's moduli. Figure 6e shows the ratio between the AP and transverse tangent Young's moduli in the cover layer. For conditions of vocal fold shortening [the lower right portion of Fig. 6c], the AP tangent Young's moduli in the cover layer was comparable to the transverse Young's modulus. In contrast, for conditions that led to vocal fold elongation [the upper left portion of Fig. 6e], the AP tangent Young's modulus in the cover layer was about 4–10 times higher than the transverse Young's modulus. For the body layer, the AP Young modulus was generally of the same magnitude as the AP Young's modulus in the cover layer, except for conditions around regions of zero AP strain, in which the body-cover ratio in AP Young's modulus increased from 1 to 18 with increasing TA activity [Fig. 6f].
Thus, increasing vocal fold elongation generally led to increased difference between the AP and transverse tangent Young's moduli but there was not much body-cover stiffness differential in either the transverse plane or along the AP direction. In contrast, vocal fold shortening, especially under strong TA contractions, led to primarily a large body-cover difference in stiffness along the AP direction, but with small AP-transverse difference in cover layer stiffness.
Vocal fold eigenfrequencies
Figure 7 shows the contour plots of the first two eigenfrequencies in case 1. Higher-order eigenfrequencies had similar contour lines and are thus not shown here. Both two eigenfrequencies exhibited similar contour level patterns. Due to the imposed larger maximum activation stress of the CT muscle, both the minimum and the maximum values of the eigenfrequencies were determined by the CT muscle alone, with the eigenfrequencies increased by almost two octaves from minimum CT contraction to maximum CT contraction. CT contraction was also more effective in regulating eigenfrequencies than the TA muscle.
Figure 7.

(Color online) Contours of the (a) first and (b) second eigenfrequencies and the corresponding eigenmode shape in case 1. For eigenmodes with AP in-phase motion, the modal shape was also shown in the middle cross-section. For eigenmodes with AP out-of-phase motion, the modal shape was shown in the cross-section at the antinode location along the AP direction.
In the upper left region of Fig. 7, which corresponds to conditions of vocal fold elongation, the eigenfrequencies increased with increasing CT activation and decreasing TA activation. However, the trend was reversed in the lower right portion of Fig. 7, which roughly corresponds to conditions of vocal fold shortening. In this region, the eigenfrequencies decreased with increasing CT activation and decreasing TA activation. Nonmonotonic variation patterns were also observed in the transition region with weak CT activation, in which the eigenfrequencies initially decreased with increasing TA (CT) activation level but then increased with further increase in the TA (CT) activation level.
This variation pattern of the eigenfrequencies with CT/TA activation levels was similar to that of the tangent Young's moduli (Fig. 6). In contrast, although the eigenfrequency contour plots were also similar to that of the AP stress in the cover layer, they were qualitatively different in the lower right region of the contour plots, in which the eigenfrequencies exhibited an opposite trend to that of the AP stress with varying CT/TA activation levels. As discussed in Sec. 2C, in addition to the mass matrix, the eigenfrequencies are determined by the combined effect of a constitutive component [Kc], which can be quantified by the tangent Young's moduli, and an initial stress component [Ks] due to initial stress generated by muscle activation (primarily along the AP direction). Although these two stiffness matrices generally had the same effects on eigenfrequencies (increasing stress often led to increased stiffness), they have opposite effect on eigenfrequencies when the vocal fold was shortened (with respect to the resting state) due to stronger TA activation in which case the AP stress decreased but stiffness increased. The fact that the eigenfrequency contours were similar to those of the stiffness rather than the AP stress indicated that vocal fold stiffness played a more important role than the AP stress in determining vocal fold eigenfrequencies, at least under conditions that led to vocal fold shortening. To further illustrate this, Fig. 8 shows the contour plot of the first eigenfrequency as predicted from the ideal string model using the averaged AP stress in the cover layer. The ideal string model predicted a maximum value of 200 Hz for the first eigenfrequency, which was much lower than the 281 Hz as predicted from our continuum model. This indicates that the vocal fold stiffness was equally important as vocal fold tension in determining vocal fold eigenfrequencies even at conditions of maximum vocal fold tension. For conditions in the lower right region of Fig. 8, the AP stress in the cover layer was negative and thus no prediction was available from the ideal string model, which contrasted to a nonzero minimum first eigenfrequency calculated from the continuum model.
Figure 8.
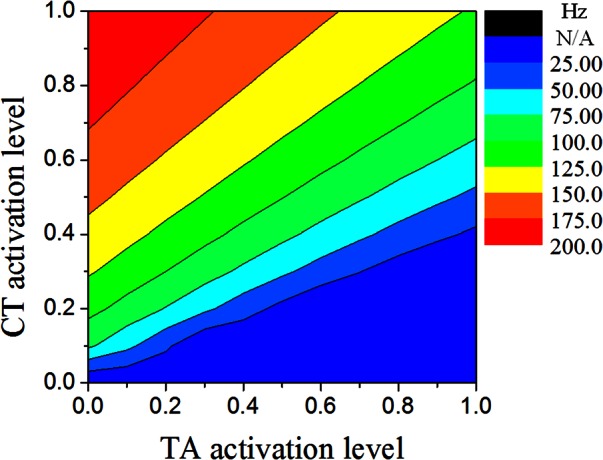
(Color online) Contours of the first eigenfrequency as calculated based on the ideal string model using the averaged AP tension shown in Fig. 5.
Figure 7a also showed that the first eigenfrequency in the lower right region of the figure was comparable to its maximum value achieved at maximum CT and zero TA contraction. Because both the AP stiffness and the AP stress had much reduced values in the lower right region compared to that in the upper left region of the contour plot, this suggested that the transverse tangent Young's moduli played an important role in affecting eigenfrequencies at conditions in the lower right corner of the contour plot.
Figure 7 also shows sketches of the first two eigenmodes. The modal shape was generally similar to those in previous studies (Zhang, 2011). It is worth noting that the first eigenmode exhibited in-phase motion along the AP direction for all conditions of CT/TA contraction. For the second eigenmode, it exhibited an in-phase motion along the AP direction only for conditions in the upper left portion of the Fig. 7b, for which there was a large AP-transverse ratio in vocal fold stiffness. The vibration pattern of the second eigenmode switched to an out-of-phase motion along the AP direction for conditions in the lower right corner of Fig. 7b, in which the AP tangent Young's modulus was comparable to the transverse Young's modulus but a large body-cover ratio in AP Young's modulus existed. This is consistent with previous study (Zhang, 2011) which showed that the out-of-phase motion along the AP direction often occurred in lower-order eigenmodes of isotropic models, but gradually shifted to high-order modes with increasing AP stiffness or reduced body-cover AP stiffness ratio.
Effects of CT/TA activation strength ratio
Figure 9 shows the contours of the first eigenfrequency for cases 2 and 3, which had a CT/TA maximum active stress ratio of 1 and 0.5, respectively. Similar patterns as in case 1 [Fig. 7a] can be observed, except that the contour pattern was rotated anti-clockwise with decreasing CT/TA maximum active stress ratio. With increasing dominance of TA activation, maximum value of the first eigenfrequency occurred at αTA = 1, and αCT = 0 in Fig. 9, rather than at αTA = 0, and αCT = 1 as in Fig. 7. For case 3, which had the lowest CT maximum activation stress, changes in the first eigenfrequency were primarily achieved by TA activation, instead of CT activation, which is contradictory to empirical observations in humans that CT is the primary regulator of phonation frequency. This suggests that the CT muscle is likely to be stronger than the TA muscle in humans.
Figure 9.
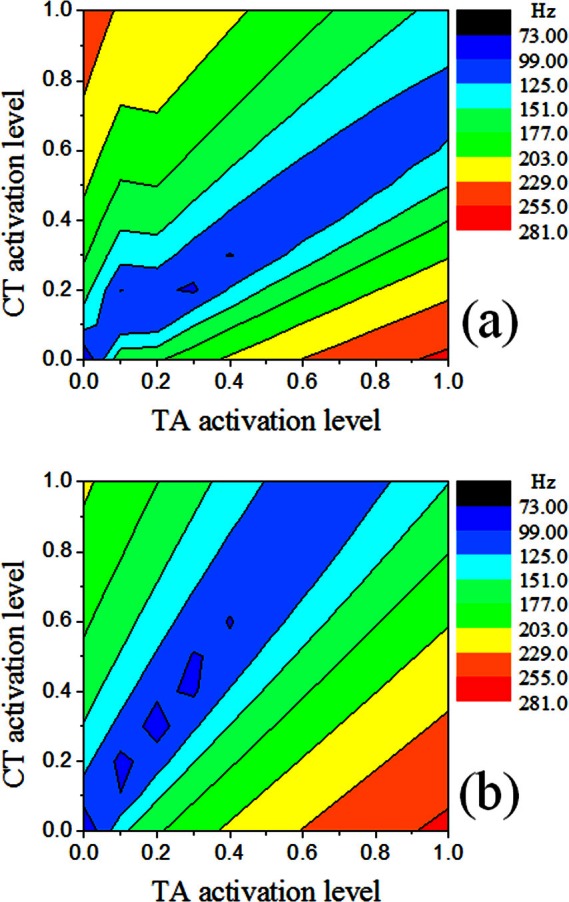
(Color online) Contours of the first eigenfrequency in (a) case 2 and (b) case 3.
Effects of body-cover depth ratio on eigenfrequencies
Figure 10 shows the contour plots of the first eigenfrequency for cases 4 and 5, which had a cover layer depth (along the medial-lateral direction) of 1.5 and 3.5 mm, respectively. Note that the depths of the body and cover layers were simultaneously varied so that the total depth remained constant. Comparison between Figs. 710 shows that changes in body-cover depth ratio only had minor effects on the eigenfrequency contour. Increasing cover-layer depth led to a relative larger region of low values of eigenfrequencies in the αCT - αTA space.
Figure 10.
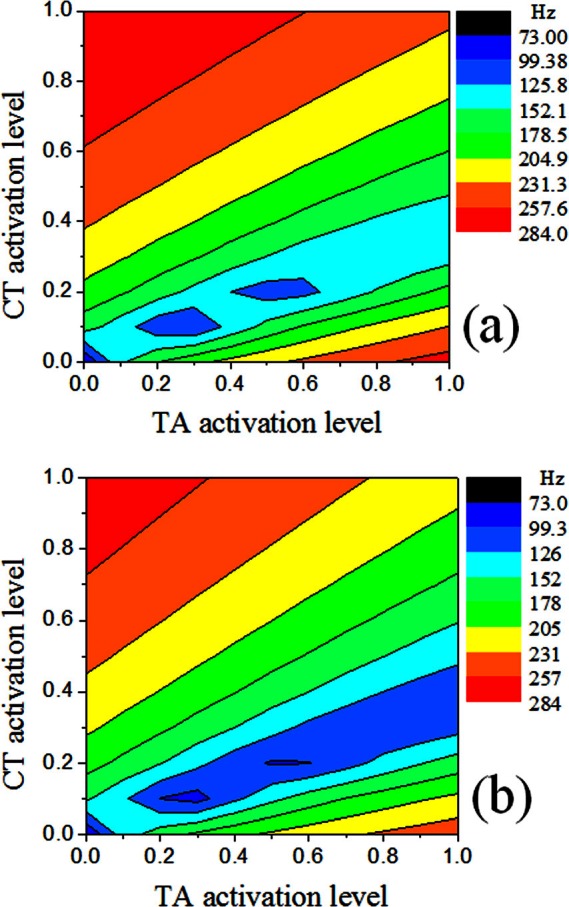
(Color online) Contours of the first eigenfrequency in (a) case 4 and (b) case 5.
DISCUSSION AND CONCLUSIONS
Unlike the general understanding based on the ideal string model that vocal fold eigenfrequencies are determined by vocal fold tension, this study showed that vocal fold eigenfrequencies were primarily determined by vocal fold stiffness, rather than vocal fold stress. Predictions based on the ideal string model underestimated the maximum first eigenfrequency by about 80 Hz and predicted a zero eigenfrequency for vocal folds at the resting state of zero stress. Although stiffness is closely related to stress for nonlinear materials such as the vocal folds because an increase in stress also leads to an increase in stiffness, they have different physical meanings: one is a property of the material itself, whereas the other describes the mechanical state of the material. Previous experimental studies using vocal fold models made from linear materials have shown that phonation frequency remained almost constant during elongation (Shaw et al., 2012) and with increasing subglottal pressure (Zhang et al., 2006a), confirming the relevance of vocal fold stiffness rather than stress distribution in the regulation of eigenfrequencies and phonation frequency.
We further showed that, starting from resting state of the vocal fold (i.e., zero initial stress), both elongation and shortening led to increase in vocal fold stiffness in both the transverse plane and along the AP direction. As a result, whether the vocal fold eigenfrequencies increased or decreased with CT/TA activation depended on whether the CT/TA interaction increased or decreased the degree of existing vocal fold deformation [Fig. 2b]. For conditions of strong CT activation, and thus an elongated vocal fold, increasing TA contraction reduced the degree of vocal fold elongation and thus reduced vocal fold eigenfrequencies. For conditions of no CT activation and thus a resting or slightly shortened vocal fold, increasing TA contraction increased the degree of vocal fold shortening and thus increased vocal fold eigenfrequencies. In the transition region of a slightly elongated vocal fold, increasing TA contraction first decreased and then increased vocal fold eigenfrequencies.
Similar patterns can be also observed on the influence of CT contraction on vocal fold eigenfrequencies (i.e., how eigenfrequencies change with increasing CT activity). This may seem to contradict common experience that the CT muscle contraction always increases phonation frequency. However, it is noted that in this study CT contraction lowered vocal fold eigenfrequencies only at very low levels of CT contraction, which may not occur in humans wherein the vocal fold is under certain AP tension even at resting state (Chhetri et al., 2011).
This study also showed that when the vocal fold was elongated, the AP stiffness (maximum around 600 kPa) increased at a much higher rate than the transverse stiffness (maximum around 60 kPa), but the body-cover difference in both the AP and transverse stiffness remained small (ratio < 3). Thus, the vocal fold at these conditions can be approximated as one transversely isotropic elastic layer. When the vocal fold was shortened, the rate of increase in AP stiffness (maximum around 300 kPa) and the transverse stiffness (maximum around 200 kPa) were comparable, but there was a large body-cover ratio in the AP stiffness (as large as 18). In this region, the vocal fold was thus better modeled as a two-layer approximation with a large body-cover difference in stiffness.
It is noted that the muscular regulation of vocal fold stiffness critically depends on the nonlinearity of the vocal fold material properties, particularly the passive component. Although we expect the qualitative trends of the results of this study would remain similar if a different passive stress-strain curve was used, further numerical investigation with parametric variations of the material properties of the vocal fold is necessary to provide a clear picture of the influence of material properties on vocal fold stiffness and eigenfrequencies. For example, Titze and Story (2002) showed that the fundamental frequency increased with increasing activities in both the CT and TA muscle in the lower left region of their muscle activation plot. Such trend was also observed in this study but only for an extremely restricted region close to the origin in the lower left region of Fig. 7 (αCT < 0.1 and αTA < 0.1). It is possible that this trend may occur for a larger range of conditions if different passive material properties are used. Also, the vocal ligament, which was not modeled in this study due to lack of experimental data of its material properties, has been hypothesized to play an important role in vocal fold dynamics, and thus needs to be investigated in future studies.
ACKNOWLEDGMENTS
This study was supported by Grant No. R01 DC011299 from the National Institute on Deafness and Other Communication Disorders, the National Institutes of Health.
References
- Alipour-Haghighi, F., and Titze, I. R. (1991). “ Elastic models of vocal fold tissues,” J. Acoust. Soc. Am. 90, 1326–1331. 10.1121/1.401924 [DOI] [PubMed] [Google Scholar]
- Alipour-Haghighi, F., Titze, I. R., and Perlman, A. L. (1989). “ Tetanic contraction in vocal fold muscle,” J. Speech Hear Res. 32, 226–231. [DOI] [PubMed] [Google Scholar]
- Bathe, K., (1995). Finite Element Procedures (Prentice Hall, Upper Saddle River, NJ: ), Chap. 6. [Google Scholar]
- Berry, D. A., and Titze, I. R. (1996). “ Normal modes in a continuum model of vocal fold tissue,” J. Acoust. Soc. Am. 100, 3345–3354. 10.1121/1.416975 [DOI] [PubMed] [Google Scholar]
- Bhattacharya, P., and Siegmund, T. (2012). “ A canonical biomechanical vocal fold model,” J. Voice 26, 535–547. 10.1016/j.jvoice.2011.09.001 [DOI] [PMC free article] [PubMed] [Google Scholar]
- Blemker, S. S., Pinsky, P. M., and Delp, S. L. (2005). “ A 3D model of muscle reveals the causes of nonuniform strains in the biceps brachii,” J. Biomech. 38, 657–665. 10.1016/j.jbiomech.2004.04.009 [DOI] [PubMed] [Google Scholar]
- Bonet, J., and Wood, R. D. (2008). Nonlinear Continuum Mechanics for Finite Element Analysis (Cambridge University Press, Cambridge: ), Chap. 7. [Google Scholar]
- Chhetri, D. K., Zhang, Z., and Neubauer, J. (2011). “ Measurement of Young's modulus of vocal fold by indentation,” J. Voice 25, 1–7. 10.1016/j.jvoice.2009.09.005 [DOI] [PMC free article] [PubMed] [Google Scholar]
- Cook, D., and Mongeau, L. (2007). “ Sensitivity of a continuum vocal fold model to geometric parameters, constraints, and boundary conditions,” J. Acoust. Soc. Am. 121, 2247–2253. 10.1121/1.2536709 [DOI] [PubMed] [Google Scholar]
- Cook, D., Nauman, E., and Mongeau, L. (2008). “ Reducing the number of vocal fold mechanical tissue properties: Evaluation of the incompressibility and planar displacement assumptions,” J. Acoust. Soc. Am. 124, 3888–3896. 10.1121/1.2996300 [DOI] [PMC free article] [PubMed] [Google Scholar]
- Deguchi, S., Kawahara, Y., and Takahashi, S. (2011). “ Cooperative regulation of vocal fold morphology and stress by the cricothyroid and thyroarytenoid muscles,” J. Voice 25, e255–e263. 10.1016/j.jvoice.2010.11.006 [DOI] [PubMed] [Google Scholar]
- Gommel, A., Butenweg, C., Bolender, K., and Grunendahl, A. (2007). “ A muscle controlled finite-element model of laryngeal abduction and adduction,” Comput. Methods Biomech. Biomed. Eng. 10, 377–388. 10.1080/10255840701550923 [DOI] [PubMed] [Google Scholar]
- Hirano, M. (1974). “ Morphological structure of the vocal fold and its variations,” Folia Phoniatr. 26, 89–94. 10.1159/000263771 [DOI] [PubMed] [Google Scholar]
- Hirano, M., and Kakita, Y. (1985). “ Cover-body theory of vocal fold vibration,” in Speech Science: Recent Advances, edited by Daniloff R. G. (College-Hill, San Diego), pp. 1–46. [Google Scholar]
- Holzapfel, G. A., Gasser, T. C., and Ogden, R. W. (2000). “ A new constitutive framework for arterial wall mechanics and a comparative study of material models,” J. Elast. 61, 1–48. 10.1023/A:1010835316564 [DOI] [Google Scholar]
- Hunter, E. J., Titze, I. R., and Alipour, F. (2004). “ A three-dimensional model of vocal fold abduction/adduction,” J. Acoust. Soc. Am. 115, 1747–1759. 10.1121/1.1652033 [DOI] [PMC free article] [PubMed] [Google Scholar]
- Lowell, S. Y., and Story, B. H. (2006). “ Simulated effects of cricothyroid and thyroarytenoid muscle activation on adult-male vocal fold vibration,” J. Acoust. Soc. Am. 120, 386–397. 10.1121/1.2204442 [DOI] [PubMed] [Google Scholar]
- Mendelsohn, A. H., and Zhang, Z. (2011). “ Phonation threshold pressure and onset frequency in a two-layer physical model of the vocal folds,” J. Acoust. Soc. Am. 130, 2961–2968. 10.1121/1.3644913 [DOI] [PMC free article] [PubMed] [Google Scholar]
- Shaw, S. M., Thomson, S. L., Dromey, C., and Smith, S. (2012). “ Frequency response of synthetic vocal fold models with linear and nonlinear material properties,” J. Speech Lang. Hear. Res. 55, 1395–1406. 10.1044/1092-4388(2012/11-0153) [DOI] [PMC free article] [PubMed] [Google Scholar]
- Titze, I. R. (1994). Principles of Voice Production (Prentice Hall, Englewood Cliffs, NJ: ), Chap. 8. [Google Scholar]
- Titze, I. R., and Hunter, E. J. (2004). “ Normal vibration frequencies of the vocal ligament,” J. Acoust. Soc. Am. 115, 2264–2269. 10.1121/1.1698832 [DOI] [PMC free article] [PubMed] [Google Scholar]
- Titze, I. R., Jiang, J., and Drucker, D. G. (1988). “ Preliminaries to the body-cover theory of pitch control,” J. Voice 1, 314–319. 10.1016/S0892-1997(88)80004-3 [DOI] [Google Scholar]
- Titze, I. R., and Story, B. H. (2002). “ Rules for controlling low-dimensional vocal fold models with muscle activation,” J. Acoust. Soc. Am. 112, 1064–1076. 10.1121/1.1496080 [DOI] [PubMed] [Google Scholar]
- Titze, I. R., and Strong, W. J. (1975). “ Normal modes in vocal cord tissues,” J. Acoust. Soc. Am. 57, 736–744. 10.1121/1.380498 [DOI] [PubMed] [Google Scholar]
- Titze, I. R., and Talkin, D. T. (1979). “ A theoretical study of the effects of various laryngeal configurations on the acoustics of phonation,” J. Acoust. Soc. Am. 66, 60–74. 10.1121/1.382973 [DOI] [PubMed] [Google Scholar]
- van den Berg, J. W., and Tan, T. S. (1959). “ Results of experiments with human larynxes,” Pract. Otorhinolaryngol. (Basel) 21, 425–450. [DOI] [PubMed] [Google Scholar]
- Xue, Q., Zheng, X., Bielamowicz, S., and Mittal, R. (2011). “ Sensitivity of vocal fold vibratory modes to their three-layer structure: Implications for computational modeling of phonation,” J. Acoust. Soc. Am. 130, 965–976. 10.1121/1.3605529 [DOI] [PMC free article] [PubMed] [Google Scholar]
- Zhang, Z. (2010). “ Dependence of phonation threshold pressure and frequency on vocal fold geometry and biomechanics,” J. Acoust. Soc. Am. 127, 2554–2562. 10.1121/1.3308410 [DOI] [PMC free article] [PubMed] [Google Scholar]
- Zhang, Z. (2011). “ Restraining mechanisms in regulating glottal closure during phonation,” J. Acoust. Soc. Am. 130, 4010–4019. 10.1121/1.3658477 [DOI] [PMC free article] [PubMed] [Google Scholar]
- Zhang, Z., Neubauer, J., and Berry, D. A. (2006a). “ The influence of subglottal acoustics on laboratory models of phonation,” J. Acoust. Soc. Am. 120(3 ), 1558–1569. 10.1121/1.2225682 [DOI] [PubMed] [Google Scholar]
- Zhang, Z., Neubauer, J., and Berry, D. A. (2007a). “ Physical mechanisms of phonation onset: A linear stability analysis of an aeroelastic continuum model of phonation,” J. Acoust. Soc. Am. 122, 2279–2295. 10.1121/1.2773949 [DOI] [PubMed] [Google Scholar]
- Zhang, K., Siegmund, T., and Chan, R. W. (2006b). “ A constitutive model of the human vocal fold cover for fundamental frequency regulation,” J. Acoust. Soc. Am. 199, 1050–1062. 10.1121/1.2159433 [DOI] [PubMed] [Google Scholar]
- Zhang, K., Siegmund, T., and Chan, R. W. (2007b). “ A two-layer composite model of the vocal fold lamina propria for fundamental frequency regulation,” J. Acoust. Soc. Am. 122, 1090–1101. 10.1121/1.2749460 [DOI] [PubMed] [Google Scholar]