

Abstract
Evolution of the brain has been an inherently interesting problem for centuries. Recent studies have indicated that neuroimaging is a powerful technique for studying brain evolution. In particular, a variety of reports have demonstrated that consistent white matter fiber connection patterns derived from diffusion tensor imaging (DTI) tractography reveal common brain architecture and are predictive of brain functions. In this paper, based on our recently discovered 358 Dense Individualized and Common Connectivity-based Cortical Landmarks (DICCCOL) defined by consistent fiber connection patterns in DTI datasets of human brains, we derived 65 DICCCOLs that are common in macaque monkey, chimpanzee and human brains and 175 DICCCOLs that exhibit significant discrepancies amongst these three primate species. Qualitative and quantitative evaluations not only demonstrated the consistencies of anatomical locations and structural fiber connection patterns of these 65 common DICCCOLs across three primates, suggesting an evolutionarily-preserved common brain architecture, but also revealed regional patterns of evolutionarily-induced complexity and variability of those 175 discrepant DICCCOLs across the three species.
Keywords: diffusion tensor imaging, brain evolution, brain architecture
1. Introduction
Evolution of the brain has been an innately interesting problem for centuries (e.g., Deacon, 1990a; Zilles et al., 1988; Zilles et al., 1989; Schoenemann, 2006; Rakic, 2009; Rogers et al., 2010). Over the past few decades, there has been substantial body of work that studied the evolution of neuroanatomy across mammalian brains based on post-mortem data (e.g., Stephan and Andy, 1969; Stephan, Bauchot and Andy, 1970; Stephan, Frahm and Baron, 1981; Clark, Mitra and Wang, 2001; Stephan, Baron, and Frahm, 2006). Recently, in-vivo neuroimaging techniques such as magnetic resonance imaging (MRI) have been used for studying neuroanatomic features in different primate brains (e.g., Rilling & Insel, 1999; Rilling and Seligman, 2002; Woods et al., 2011), because 3D morphological and anatomical attributes of primate brains can be effectively visualized and measured via non-invasive brain imaging data. For instance, Fig. 1 shows the cerebral cortical surfaces of human, chimpanzee, and macaque brains reconstructed via our previous approaches (Liu et al., 2004, 2007, 2008). The significant local differences, as well as considerable global similarities, of the cortical shapes across three primate brains can be easily appreciated by this 3D visualization. Despite increasing neuroimaging studies of brain evolution, however, the full potential of applying powerful imaging techniques and advanced image analysis algorithms in brain evolution research is still far from being realized (Healy and Rowe, 2007; Pollen et al., 2008; Krubitzer 2009). First, many previous studies of neuroanatomic evolution were based on basic and global measurements such as brain size (Healy and Rowe, 2007), tissue volume (Healy and Rowe, 2007) and gyrification index (Zilles et al., 1988, 1989). Given that the brain has many functionally-segregated areas, these coarse-scale measurements are limited. For instance, it was pointed out in Healy and Rowe 2007 that the whole brain size alone is a questionable measurement in studying brain evolution. Second, pure anatomical measurements can only provide limited insight into the evolution of brain function and the co-evolution of brain structure and function (Pollen et al., 2008). It was also noted in Pollen et al., 2008 that current anatomical measurements are insufficient in studying the evolution of brain function, and it was widely called for to develop novel neuroimaging and neuroimage analysis approaches to study the relationship between brain structure and function during evolution.
Fig. 1.
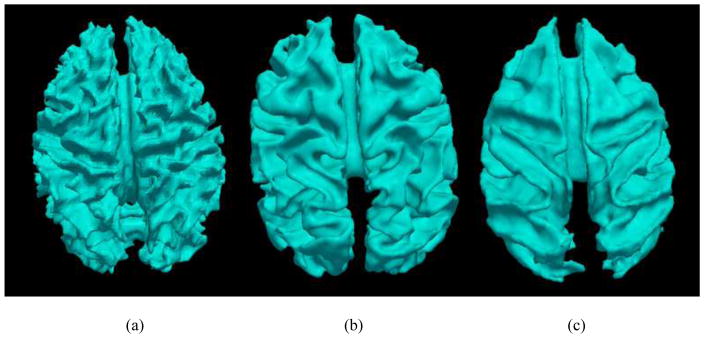
Example of cortical surfaces of three primate brains. (a): Human. (b): Chimpanzee. (c): Macaque monkey.
In a recent study by Rilling et al. (2008), diffusion tensor imaging (DTI) (Mori, 2006) was used as an effective comparative approach to assess the evolution of the arcuate fasciculus, which is a white-matter fiber tract involved in human language. This study compared cortical connectivity in three primate species, human, chimpanzee and macaque monkey, and reported a prominent temporal lobe projection of the human arcuate fasciculus that is much smaller or absent in nonhuman primates (Rilling et al., 2008). This work indicates the power of DTI in discovering meaningful patterns of brain evolution. Importantly, this study also demonstrated the potential of using DTI-derived fiber bundles to link brain structure and function as the arcuate fasciculus reconstructed from DTI data is a fiber tract closely linked to human language (Rilling et al., 2008). In addition, functional magnetic resonance imaging (fMRI) (Friston, 2009) was recently used to assess the intrinsic functional brain architecture in anaesthetized macaque brains and resting state human brains (Vincent et al., 2007). It was found that a variety of similar functional networks, including the oculomotor, somatomotor, visual, and default mode systems, are well preserved across macaque and human brains. All of these above studies (Rilling et al., 2008; Vincent et al., 2007; Krubitzer 2009) indicate that DTI and fMRI are powerful tools for studying brain evolution.
Along this direction, this paper focuses on DTI studies of three primate species, human, chimpanzee and macaque monkey, as DTI can map axonal fiber connections in vivo (Mori, 2006). However, a prerequisite for applying DTI to brain evolution study is that imaging-based measurements should possess correspondences across different primate brains. For those global measurements such as brain size (Healy and Rowe, 2007), tissue volume (Healy and Rowe, 2007) and gyrification index (Zilles et al., 1988, 1989), their correspondences across species were established in advance. However, when performing neuroimaging-based measurements at the finer scale, such as at cortical meso-scale, determining the correspondence between common anatomical/functional brain regions across different brains and species is perhaps one of the foremost challenges in brain mapping (Liu, 2011, Zhu et al., 2012). Our recent work has shown that consistent white matter fiber connection patterns derived from DTI tractography are predictive of brain function (Zhang et al., 2011; Zhu et al., 2011; Zhu et al., 2012). The neuroscience basis is that each brain’s cytoarchitectonic area has a unique set of extrinsic inputs and outputs, called the “connectional fingerprint” (Passinghamet al., 2002), which largely determine the functions that each brain area performs. Based on this principle, we designed and validated a novel data-driven strategy that discovered consistent and corresponding ROIs in multiple brains and populations, in which each identified ROI is optimized to possess maximal group-wise consistency of DTI-derived fiber shape patterns (Zhu et al., 2011; Zhu et al., 2012). This novel data-driven discovery approach has identified 358 ROIs that have consistent DTI-derived fiber patterns across healthy young adults (e.g., see Fig. 2a). We named these 358 ROIs as Dense Individualized and Common Connectivity-based Cortical Landmarks (DICCCOL) (Zhu et al., 2012). This set of 358 ROIs has been replicated in six separate healthy populations, e.g., via similar fiber shape patterns across different subjects shown in Figs.2b–2d. Importantly, this set of 358 ROIs can be accurately predicted in an individual subject based on DTI data (Zhang et al., 2011) (Figs. 2e–2g). The collection of 358 ROIs and their predictions in six different human brain populations are available online at: http://dicccol.cs.uga.edu. This enabling approach allows us to localize large-scale corresponding landmarks in different brains based on DTI data. Also, we used fMRI data to functionally annotate 95 DICCCOL ROIs into nine functional brain networks (Zhu et al., 2012), which enables the potential transfer of functional information among corresponding structural ROIs. In this paper, the 358 DICCCOLs identified in the human brains are predicted and examined in the macaque and chimpanzee brains in order to assess the evolution of primate brain architectures, and interesting results were obtained.
Fig. 2.
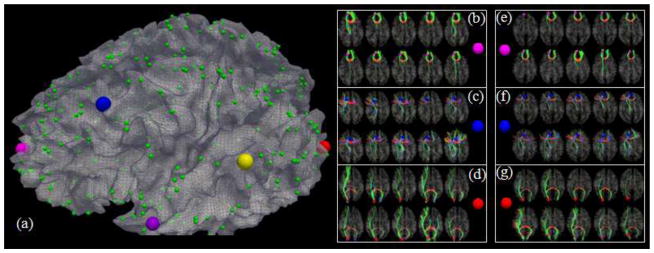
(a): The 358 DICCCOLs. (b)–(d): DTI-derived fibers emanating from 3 landmarks, represented by enlarged color bubbles in (a), in 2 groups of 5 subjects (in 2 rows) respectively. (e)–(g): The predicted 3 landmarks in 2 group of 5 subjects (in 2 rows) and their corresponding connection fibers.
2. Materials and Methods
2.1. Data acquisition and preprocessing
Human brain imaging
Fifteen healthy adult volunteers (thirteen male and two female subjects) were scanned on a GE 3T Sigma MRI system using an 8-channel head coil at the Bioimaging Research Center (BIRC) of the University of Georgia (UGA) under IRB approval. DTI data was acquired using an isotropic spatial resolution of 2 mm, a TR of 15.5 s, and a b-value of 1000 with 30 DWI gradient directions, along with 3 b=0 volumes. All scans were aligned to the AC-PC line. For the DTI data, preprocessing included brain skull removal, motion correction, and eddy current correction. Subsequently, fibers tracts, gray matter (GM) and white matter (WM) tissue segmentations (Liu et al., 2007), and the GM/WM cortical surface were generated based on the DTI data (Liu et al., 2008).
Chimpanzee and macaque brain imaging
MRI scans were obtained from 36 adult female chimpanzees and 25 adult female macaques. Fifteen cases were randomly selected for each primate species for this study. All chimpanzees and macaques were members of colonies at Yerkes National Primate Research Center (YNPRC) in Atlanta, Georgia. We do not currently have access to a comparable set of MRI scans from male chimpanzees or macaques. All imaging studies were conducted at the YNPRC of Emory University under IACUC approvals. Prior to scanning, the subjects were immobilized with ketamine injections (2–6 mg/kg, i.m.) and were subsequently anesthetized with an intravenous propofol drip (10 mg/kg/hr) following standard veterinary procedures used at YNPRC. The subjects remained sedated for the duration of the scans as well as the time needed for transport between their home cage and the scanner location. After completing the MRI scan, the chimpanzees and macaques were temporarily housed in a single cage for 6 to 12 hours to allow the effects of anesthesia to wear off before being returned to their home cage and cage mates. The veterinary staff and research staff observed the general well-being (i.e., activity, food intake) of the chimpanzees twice daily after the scan for possible distress associated with aesthetic accesses.
Both anatomical and diffusion MRI scans were acquired on a Siemens 3T Trio scanner (Siemens Medical System, Malvern, PA) with a standard birdcage coil. Foam cushions and elastic straps were used to minimize head motion.
The protocol for chimpanzees was as follows
High-resolution T1-weighted images were acquired with a 3D magnetization-prepared rapid gradient-echo (MPRAGE) sequence for all participants. The scan protocol, optimized at 3T, used a repetition time/inversion time/echo time of 2400/1100/4.13 msec, a flip angle of 8°, a volume of view of 256×256×154 mm3, a matrix of 256×256×192, and resolution of 1.0×1.0×0.8 mm3, with 2 averages. Total T1 scan time was approximately 20 minutes. Diffusion MRI data were collected with a diffusion-weighted, multi-shot (four segments), spin-echo echo planar imaging (EPI) sequence. A dual spin-echo technique combined with bipolar gradients was used to minimize eddy-current effects. The parameters used for diffusion data acquisition were as follows: diffusion-weighting gradients applied in 60 directions with a b value of 1000 sec/mm2; repetition time/echo time of 5740/91 msec, field of view of 230×230 mm2, matrix size of 128×128, resolution of 1.8×1.8×1.8 mm2, 41 slices with no gap, covering the whole brain. Averages of two sets of diffusion-weighted images with phase-encoding directions of opposite polarity (left – right) were acquired to correct for susceptibility distortion. For each average of diffusion-weighted images, six images without diffusion weighting (b=0 sec/mm2) were also acquired with matching imaging parameters. The total diffusion MRI scan time was approximately 50 minutes. Pre-processing steps were similar to those used for processing human DTI data.
The protocol for macaques was as follows
A specially designed holding device was used to stabilize macaque’s head during scanning, with two plastic screws pushing the macaque’s ear canals tightly. An 8-channel human knee coil was used for macaque scans. High-resolution T1-weighted images were acquired with a 3D MPRAGE sequence for all participants. The scan protocol, optimized at 3T, used a repetition time/inversion time/echo time of 2500/950/3.49 msec, a flip angle of 8°, a volume of view of 128×128×96 mm3, a matrix of 256×256×192, and resolution of 0.5×0.5×0.5 mm3, with 3 averages. Total T1 scan time was approximately 33 minutes. Diffusion MRI data were collected with a diffusion-weighted, multi-shot (three segments), spin-echo echo planar imaging (EPI) sequence. A dual spin-echo technique combined with bipolar gradients was used to minimize eddy-current effects. The parameters used for diffusion data acquisition were as follows: diffusion-weighting gradients applied in 60 directions with a b value of 1000 sec/mm2; repetition time/echo time of 6970/104 msec, field of view of 141×141 mm2, matrix size of 128×128, resolution of 1.1×1.1×1.1 mm3, 41 slices with no gap, covering the whole brain. Averages of four sets of diffusion-weighted images with phase-encoding directions of opposite polarity (left–right) were acquired to correct for susceptibility distortion. For each average of diffusion-weighted images, five images without diffusion weighting (b=0 sec/mm2) were also acquired with matching imaging parameters. The total diffusion MRI scan time was approximately 90 minutes. Preprocessing steps were similar to those used in processing the human DTI data.
2.2. DICCCOLs in human brains
The algorithmic details of our DICCCOL discovery procedure were described previously (Zhu et al., 2011b; 2012). To be self-contained, the steps for DICCCOL discovery in human brains based on DTI data are briefly described here. In general, we formulated the DICCCOL discovery as an optimization problem as follows. We randomly selected one subject as the template and generated a dense, regular map of 3D grid points within the boundary box of the reconstructed cortical surface. The intersection locations between the grid map and the cortical surface were used as the initial landmarks. As a result, we generated dense (e.g., 2056) landmarks on the template. Then, we registered this grid of 2056 landmarks to other subjects using the linear registration algorithm FSL FLIRT. This linear warping initialized the dense grid map of landmarks and established their rough correspondences across different subjects (totally 10, including 8 female and 2 male subjects). Then, we extracted white matter fiber bundles emanating from small regions around the neighbourhood of each initial DICCCOL landmark. The centers of these small regions were determined by the vertices of the cortical surface mesh, and each small region served as the candidate for landmark location optimization. Afterwards, we projected the fiber bundles to a standard sphere space, termed trace-map (Zhu et al., 2011; Zhu et al., 2012), and calculated the distance between any pair of trace-maps in different subjects within the group. Finally, we performed a whole-space search to find one group of fiber bundles which gave the least group-wise variance.
We formulated the problem of optimization of landmark locations and sizes as an energy minimization problem (Zhu et al., 2011; Zhu et al., 2012), which aims to maximize the consistency of structural connectivity patterns across a group of subjects. By searching the whole-space of landmark candidate locations and sizes, we found an optimal combination of new landmark parameters (locations and sizes) that ensure the fiber bundles from different subjects have the least group variance (Zhu et al., 2011). In our implementation, for each landmark of the subject, we examined around 30 locations, and extracted their emanating fiber bundles as the candidates for optimization. Then, we transformed the fiber bundles to trace-maps. After representing them as vectors, we calculated the distance between any pair of them from different subjects. Thus, we performed search in the whole space of landmark location and size combinations in order to seek the optimal one with the least variance within the group of subjects. Finally, we determined 358 DICCCOL landmarks by two experts independently by both visual evaluation via in-house toolkit (Li et al., 2012) and trace-map distance measurements. Fig. 3 shows one example of DICCCOL ROI and all of the 358 DICCCOL models in human brains are available online at: http://dicccol.cs.uga.edu.
Fig. 3.
An example of the in-house batch visualization tool and its rendering of fiber bundle shapes of one DICCCOL landmark in 10 subjects. The visualization of other 358 DICCCOLs are online at: http://dicccol.cs.uga.edu.
2.3. Predicting DICCCOLs in chimpanzee and macaque monkey brains
Based on the white matter fibers derived from DTI tractography (via MEDINRIA, http://www-sop.inria.fr/asclepios/software/MedINRIA/) in macaque and chimpanzee brains, and the 358 DICCCOLs identified in the human brains, we predicted the 358 DICCCOLs in the chimpanzee and macaque brains as follows. The prediction procedure of DICCCOLs is akin to the optimization procedure in Section 2.2. Specifically, we warped each new primate subject (either macaque or chimpanzee brain) to a randomly selected human template which was used for generating the DICCCOLs and performed the optimization procedure in Section 2.2. Since we already have the locations of DICCCOLs in the model human brains, we do not change the locations of those DICCCOLs in these human models. This step made the DICCCOL prediction procedure very fast and efficient. Then, the locations of all DICCCOL landmarks in the new subject were optimized by minimizing the differences between the new subject and the models based on the similar approaches in (Zhang et al., 2011). Specifically, let Sm1, Sm2, …, Sm10 and Sp represent the human template and the new macaque or chimpanzee subject to be predicted, respectively. We formulated the landmark prediction algorithm as below:
We randomly select one subject from the human dataset as a template (Smi), and each of the 358 DICCCOLs in the human template is roughly initialized in Sp via the linear registration algorithm FSL FLIRT.
For Sp, we extract DTI-derived white matter fibers emanating from the neighbourhood of each initialized DICCCOL. The centers of these candidate regions are determined by the vertices of the cortical surface mesh, and each of those regions serves as the candidate for landmark location optimization.
We project the fiber bundles of the candidate landmarks in Sp to a standard sphere space, called trace-map. For each landmark to be optimized in Sp, we calculate the trace-map distances between the candidate landmark and those DICCCOLs in the human template subjects within the group.
For each predicted landmark, we perform a whole-space search to find one group of fiber bundles that provide the largest group-wise similarity. The candidate landmark in Sp with the largest group-wise consistency is selected as the predicted DICCCOL.
As examples, Figs. 4a–4b show the localizations and corresponding emanating fibers of two predicted DICCCOLs in fifteen primate brains, 5 from each species. It is evident that the corresponding DICCCOLs are localized in similar anatomic areas (the frontal pole in Fig. 4a and the occipital pole in Fig. 4b) in fifteen primate brains. Also, the fiber bundles emanating from the same corresponding predicted DICCCOL have similar shapes and structural connection patterns in these fifteen primate brains, suggesting that the predicted ROIs in five chimpanzee and five macaque brains are likely to possess structural correspondences as human brains. More extensive qualitative and quantitative evaluations will be provided in Section 3.
Fig. 4.
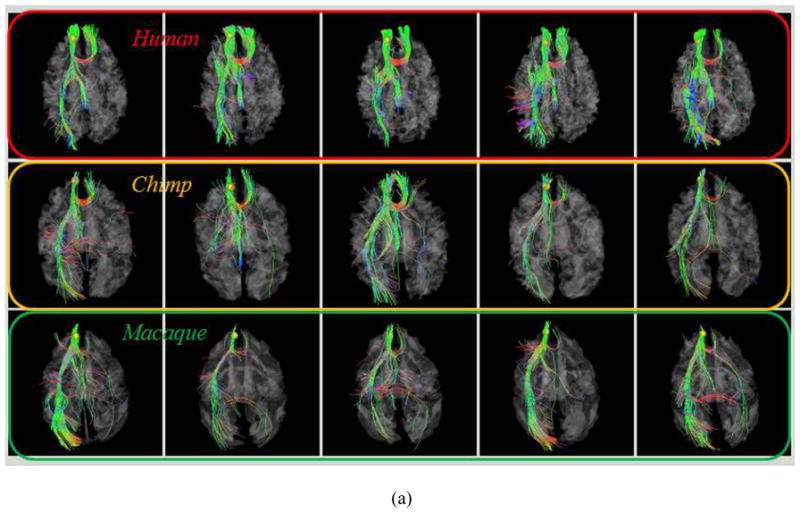
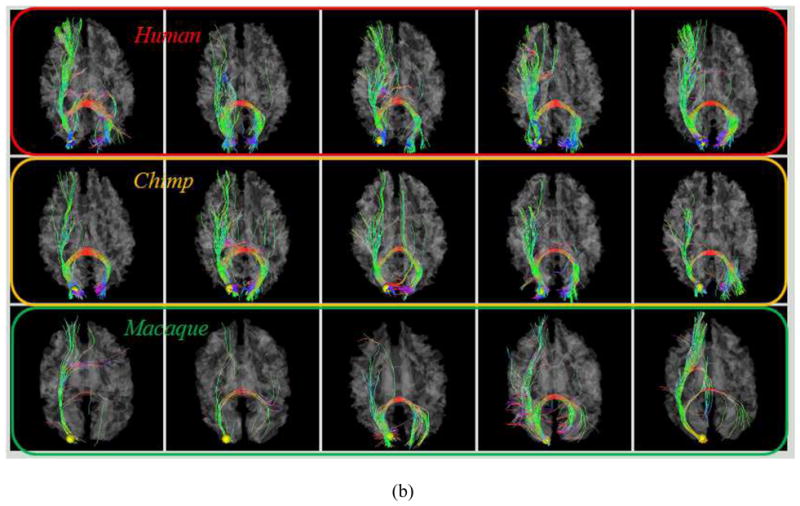
(a): An example of one DICCCOL ROI located at the frontal pole in five human (top row), five chimpanzee (second row) and five macaque (bottom row) brains. (b): Another ROI located at the occipital pole.
2.4. Identification of common/discrepant DICCCOLs among three primates
Fig. 5 summarizes the flowchart of our data processing and analysis pipeline for common/discrepant DICCCOL identification in three primate species. In this work, we used two criteria for such differentiation. The first is the quantitative comparisons of trace-map description of fiber shape patterns, and the second is the visual examination of the fiber connection patterns and their trace-map patterns. Specifically, the originally discovered 358 DICCCOLs in the human brains (Zhu et al., 2011; Zhu et al., 2012) are used as the templates, and they are predicted in the macaque and chimpanzee brains based on DTI datasets via the methods in Section 2.3, respectively. Before the DICCCOL prediction, the cortical surfaces of chimpanzee and macaque brains were warped to the template human brain space via the FSL FLIRT registration toolkit, in order to remove the global shape and size differences. As shown in Supplemental Fig. 1, the global shapes of the cortical surfaces are similar after the linear registration. Then, the common DICCCOLs among the three primate species are identified by group-wise verifications using our visual analytics methodologies and in-house batch visualization tool (Li et al., 2012) shown in Fig. 4. The consistencies of both anatomical locations and structural fiber connection patterns across three primates were verified by two experts independently, and were then confirmed by both qualitative and quantitative measurements of trace-map similarities of the fiber bundles emanating from the corresponding landmarks (please see Supplemental Fig. 2), which is similar to the procedures used by us earlier (Zhu et al., 2012). The fiber connection consistencies of common DICCCOLs in the human brains were additionally verified by their connectivities to sub-cortical regions, which are considered as relatively more reliable and consistent landmarks in the brain (Zhu et al., 2011). It should be pointed out that when we seek corresponding landmarks on the cortices across individual brains or across species, we mainly focus on the similarities of global fiber shapes, instead of local shape patterns. Accordingly, the trace-map model aims to effectively represent the global shape and connectivity pattern of a fiber bundle, while allowing for normal local variation of corresponding fiber bundles in different brains. Also, those DICCCOLs with significant discrepancies (determined by both visual analytics and trace-map quantification) among three species were identified as a separate group of discrepant landmarks for further analysis of regional patterns of evolutionarily-induced complexity and variability across three species.
Fig. 5.
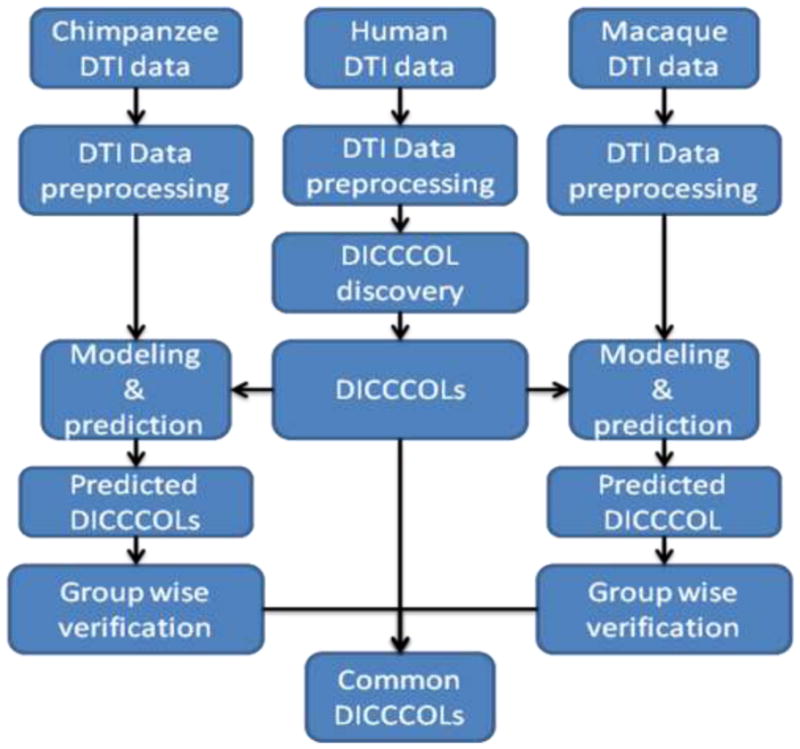
The flowchart of our data processing and analysis pipeline for common/discrepant DICCCOL identification in three primates. The DICCCOLs in the human brains are used as the templates and they are predicted in the macaque monkey and chimpanzee brains respectively. The common DICCCOLs among three species are identified by group-wise visual verifications and quantitative measurements. The discrepant DICCCOLs are identified using similar criteria.
3. Results
We designed four experiments to examine the discovered common DICCCOLs that exhibit consistent anatomical and connectional profiles across macaque, chimpanzee and human and to examine the regional patterns of evolutionarily-induced complexity and variability of those discrepant DICCCOLs. Both qualitative and quantitative evaluations were provided to examine the evolution of structural brain architectures represented by the common and discrepant DICCCOLs.
3.1. 65 common DICCCOLs in three primates
In total, the common DICCCOL discovery procedure in Fig. 5 identified 65 common DICCCOL landmarks in the brains of human, chimpanzee and macaque. Fig. 6 provides the visualizations of the distributions of 65 common DICCCOLs in the brains of three primates. Top-down, left-lateral and right-lateral views of the distribution are provided in Figs. 6a–6c, respectively. Visual examination suggests that most of the common DICCCOLs are localized in similar anatomical locations on the cerebral cortical surfaces across three primate species. It is also evident that there are relatively denser distributions of common DICCCOLs in the occipital and frontal lobes, in comparison with the temporal lobe, suggesting that those two lobes might have more evolutionarily-preserved fiber connections and common brain architectures. In other words, the temporal lobe might have more evolutionarily-induced difference in structural connections and brain architectures across the macaque, chimpanzee and human brains. This result is consistent with the recent finding in Rilling et al., 2008 that the prominent temporal lobe projection of the human arcuate fasciculus is much smaller or absent in nonhuman primates. In the parietal lobe, most common DICCCOLs reside in the superior part, while few are present in the inferior part. This result suggests that the superior parietal lobe might be more evolutionarily-preserved than the inferior portion.
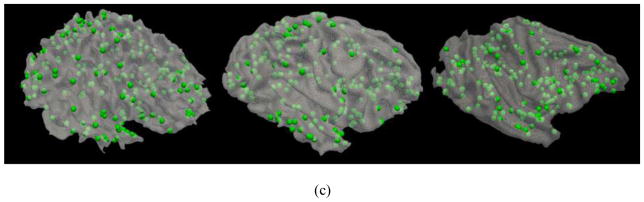
Fig. 6.
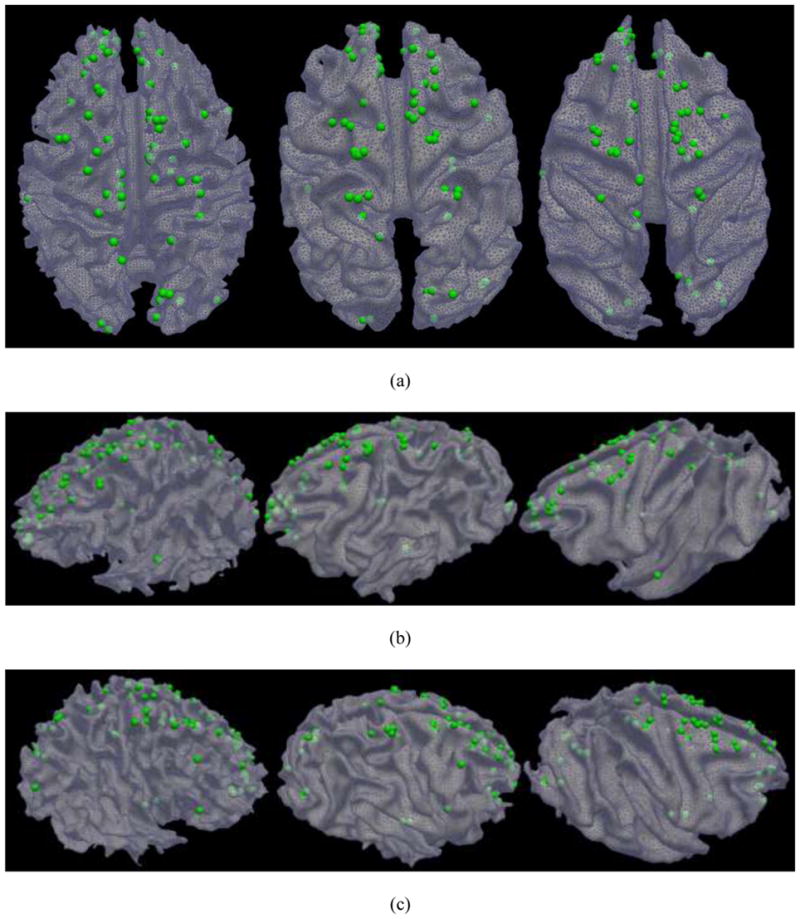
The distributions of 65 common DICCCOLs in the human (left), chimpanzee (middle) and macaque monkey (right) brains. (a): top-down view; (b) Left-side view; and (c) Right-side view.
To examine the consistencies of anatomical and connectional profiles of these 65 common DICCCOLs among three species, we visualized the landmarks activated in two task-based fMRI datasets of human brains, as shown in Figs. 7–8. Specifically, two common DICCCOLs that were co-localized with two activated regions in a visual task-based fMRI task in human brains (other discrepant fMRI activations are discarded here) are shown in Figs. 7a–7c. It is apparent that their anatomical locations are reasonably similar in three primate brains. Figs. 7d–7e show the fiber bundles of these two DICCCOL landmarks in five human (top row), five chimpanzee (second row) and five macaque (bottom row) brains, respectively. It can be clearly seen that these two common DICCCOLs exhibit reasonably consistent fiber connection patterns across subjects within the same species and across subjects in three different species. An additional example of DICCCOL landmark in the visual area co-localized with a working memory task-based fMRI data (Faraco et al., 2011; Zhu et al., 2012) is shown in Supplemental Fig. 3. These results suggest that our DICCCOL prediction method can effectively and accurately localize those landmarks with consistent fiber connection patterns, and that there are reasonably consistent fiber connection patterns for these cortical landmarks across three species. Given several reports demonstrating that consistent fiber connection patterns predict brain functions (Passinghamet al., 2002; Zhu et al., 2011; Zhu et al., 2012), we hypothesize that the identified common landmarks with consistent fiber connections across species would be predictive of similar brain functions across macaque, chimpanzee and human. Nevertheless, this hypothesis has to be validated in the future via fMRI studies (Vincent et al., 2007), which is much more difficult and beyond the scope of this work. It should also be pointed out that there is identifiable difference in the fiber connection patterns of the same landmark across and within species, which might be attributed to normal variations of connectional patterns across individuals and evolution-induced differences.
Fig. 7.


Examination of fiber connections of two functionally determined DICCCOLs. (a) Two DICCCOLs that are co-localized with activated functional brain regions (brown bubbles) in a visual task-based fMRI in a group of human brains. Other activated functional regions in human brains cannot find equivalents in chimpanzee and monkey brains, and thus are not shown here. (b)–(c): The predicted DICCCOL landmarks in chimpanzee and macaque brains. (d) Visualization of fiber bundles of the first DICCCOL landmark in five human (top row), five chimpanzee (second row) and five macaque monkey (bottom row) brains. (e) Visualization of fiber bundles of the second functionally determined DICCCOL landmark in five human (top row), five chimpanzee (second row) and five macaque (bottom row) brains.
Fig. 8.
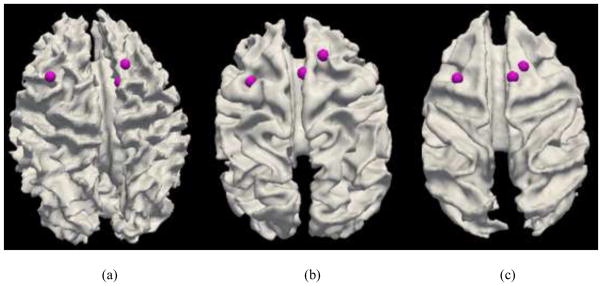

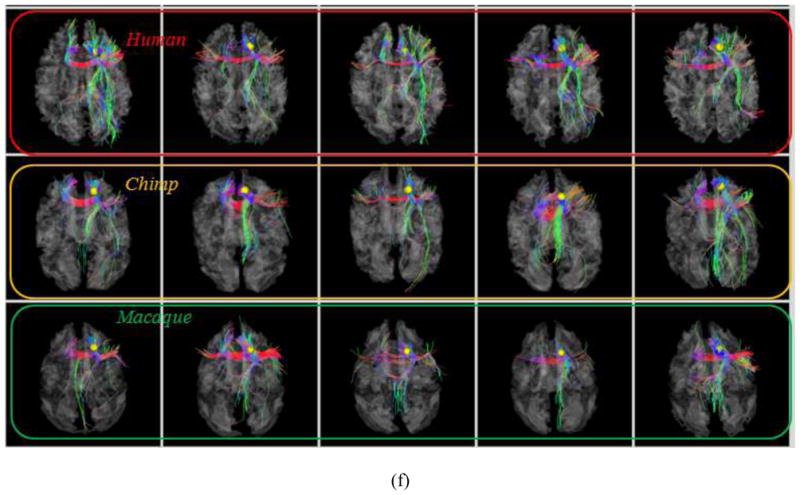
Examination of fiber connections of three functionally determined DICCCOLs. (a) Three activated functional brain regions (purple bubbles) in an auditory task-based fMRI in human brains. Other activated functional regions in human brains cannot find equivalents in chimpanzee and macaque monkey brains, and thus are not shown here. (b)–(c): The predicted regions in chimpanzee and macaque brains. (d) Visualization of fiber bundles of the first landmark in five human (top row), five chimpanzee (second row) and five macaque (bottom row) subjects. (e) Visualization of fiber bundles of the second landmark in five human (top row), five chimpanzee (second row) and five macaque (bottom row) subjects. (f) Visualization of fiber bundles of the third landmark in five human (top row), five chimpanzee (second row) and five macaque (bottom row) subjects.
In addition, three common DICCCOLs that were co-localized with three activated brain regions in an auditory task-based fMRI in human brains (other discrepant fMRI activations are not shown here) are shown in Figs. 8a–8c. Again, it can be appreciated that their anatomical locations are reasonably similar across three species. Figs. 8d–8f illustrate the fiber bundles of these three DICCCOL landmarks in five human (top row), five chimpanzee (second row) and five macaque (bottom row) brains, respectively. Similarly, it can be seen that these three common DICCCOLs have reasonably consistent fiber connection patterns across different subjects within the same species and across subjects in different species. This result further confirms that our DICCCOL prediction method can effectively and accurately identify those DICCCOL landmarks with consistent fiber connection patterns, and that there exist consistent fiber connections for these cortical landmarks across three primates. Again, it should be emphasized that certain degree of difference in the fiber connection patterns of the same landmark is evident across and within species, which could be attributed to individual variations and evolution-induced changes. Visualization of all of the 65 common DICCCOLs for three primates are already released online at: http://www.cs.uga.edu/~tliu/primate.rar for further visual evaluations of our experimental results.
Given the lack of ground-truth correspondences between cortical landmarks across individual brains and the lack of fMRI data, we have used the sub-cortical regions, which are relatively more reliable and consistent, as the benchmark landmarks to further evaluate the reliability and validity of the consistencies of DICCCOL landmarks (Zhu et al., 2011). This procedure is similar to the methodology used in our previous publication (Zhu et al., 2011). That is, if the identified common DICCCOLs have similar DTI-derived fiber connectivity patterns to the subcortical regions such as thalamus, putamen and caudate across different brains, it is considered as supporting evidence for consistency and correspondence (Zhu et al., 2011). Supplemental Fig. 4 shows five examples of common DICCCOLs, each of which exhibit reasonably consistent fiber connectivity patterns to sub-cortical regions, providing further validation to the identified consistent and common DICCCOLs.
3.2. Quantitative evaluations of fiber connection consistencies of 65 common DICCCOLs
In addition to visual evaluation of consistencies of fiber connection patterns of common DICCCOLs across three species, we examined the quantitative distances between trace-maps of DICCCOLs within and across three species. For instance, Fig. 9a provides the distributions of trace-map distances within the human, chimpanzee and macaque brains, as well as the distances between human and chimpanzee and the distances between human and macaque brains for two DICCCOL ROIs in the visual network. It is evident that the within-species and cross-species trace-map distances for the same ROI are comparable, suggesting that this common DICCCOL ROI has similar fiber connection patterns within and across three species. This result further demonstrates that there are fiber connections for these landmarks that are truly consistent across three species and our DICCCOL prediction method can effectively identify them. As shown in Fig. 9b, similar results were obtained for another DICCCOL ROI in the visual network. In a similar way, Fig. 10 provides the trace-map distance measurements for three DICCCOL ROIs in the auditory network and demonstrates comparable results. Note that the applied trace-map model (Zhu et al., 2011; Zhu et al., 2012) for quantitative comparison of fiber bundles aims to capture and characterize the global fiber shape patterns, while allowing for local and normal fiber shape variations as can be seen in Figs. 7–8. Therefore, the measured similarities of fiber shapes are more at the global level, while their differences are more at the local level.
Fig. 9.

Quantitative measurements of trace-map distances of two DICCCOLs in the visual network derived from fMRI. (a). Visual ROI #1 in Fig. 7d. The distributions of trace-map distances (by vertical axis) within the human, chimpanzee and macaque brains, as well as the distances between human and chimpanzee (represented by HvsC) and the distances between human and macaque (represented by HvsM) brains. The average distance of the trace-map among the human dataset is 3.08, the average distance among chimpanzee datasets is 2.99, and the average distance among macaques is 3.14. The average trace-map distance between the human and chimpanzee brains is 2.50, and the average distance between the human and macaque brains is 2.90. (b). Visual ROI #2 in Fig. 7e. The average distance of the trace-map among the humans is 2.64, the average distance among chimpanzee datasets is 3.28, and the average distance among macaques is 2.68. The evareage distance between the human and chimpanzee brains is 2.59, and the one between the humans and macaques is 2.09.
Fig. 10.


Quantitative evaluations of trace-map distances of three DICCCOLs in the auditory network. (a) The auditory ROI #1 in Fig. 8d. The average distance of the trace-map within the human dataset is 2.21, the average distance within the chimpanzee dataset is 2.47, and the average distance within the macaque dataset is 2.56. The average distance between the human and chimpanzee (represented by HvsC) brains is 1.97, and the distance between the humans and macaques (represented by HvsM) is 2.02. (b) The auditory ROI #2 in Fig. 8e. The average distance of the tracemap within the human dataset is 2.84, the average distance within the chimpanzee datasets is 2.56, and the average distance within the macaques is 2.57. The everage distance between the human and chimpanzee brains is 2.65, and the average distance between the human and macaque brains is 2.59. (c) The auditory ROI #3 in Fig. 8f. The average distance of the trace-map models within the human dataset is 1.98, the average distance of the trace-map models within the chimpanzee dataset is 2.13, and the average distance within the macaques is 1.97. On average, the distance between the human and chimpanzee brains is 1.92, and the average one between the human and macaque is 1.93.
3.3. Examination of 175 discrepant DICCCOLs
The discrepant DICCCOLs discovery procedure in Fig. 5 identified 175 DICCCOL ROIs that cannot find consistent fiber connection patterns across macaque, chimpanzee and human brains; these ROIs are presented in Fig. 11. It is evident that these 175 DICCCOLs are distributed over all brain lobes and major functional brain areas. This widespread distribution of discrepant DICCCOL ROIs might reflect the intrinsic fiber connection pattern differences across three primate brains due to brain evolution. In particular, the Broca’s and Wernicke’s areas have a number of discrepant DICCCOL ROIs across three species, suggesting that brain connections and functions are prominently evolved in these areas.
Fig. 11.

The distributions of 175 discrepant DICCCOL ROIs that do not find consistent fiber connection patterns in the brains of human (left), chimpanzee (middle) and macaque (right). (a): top-down view; (b) Left-side view; and (c) Right-side view.
To quantitatively evaluate the fiber connection pattern differences between human and nonhuman primate brains, we present the color-coded average trace-map distance of each discrepant DICCCOL ROI on the cortical surfaces of chimpanzee and monkey brains in Fig. 12. It can be clearly seen that the discrepant DICCCOL ROIs have apparent regional differences of trace-map distances, e.g., the DICCCOLs in the Broca’s and Wernicke’s areas have rather large trace-map distances, as shown in green and orange colors on the cortical surfaces. This result might suggest that structural connection patterns in these cortical regions are prominently evolved across primate brains, in agreement with literature report (Rilling et al., 2008). Also, the primary motor and sensory cortical areas have a large number of discrepant DICCCOL ROIs, e.g., those yellow and orange ROIs, that exhibit high differences among human, chimpanzee and macaque brains. Visual examinations of Fig. 13 revealed that these discrepant ROIs in the primary motor and sensory regions have strong fiber connections to the frontal and occipital lobes in the human brains, but much less fiber connections in chimpanzee and macaque brains. This observation well explains the relatively large discrepancies of those ROIs in the primary motor and sensory cortical areas across three primates. In contrast, the discrepant DICCCOL ROIs in the occipital lobes have relatively smaller trace-map distances across species, indicating more similar connection patterns across these three primate species.
Fig. 12.

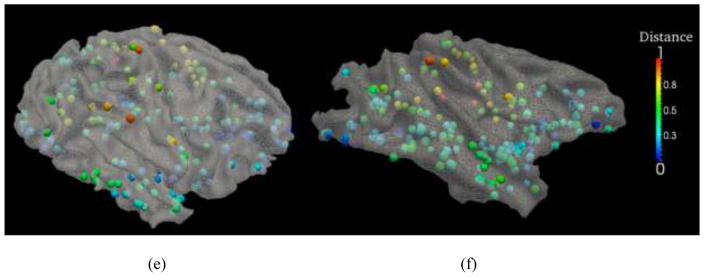
The trace-map distances between primates. The distances are color-coded on discrepant DICCCOLs on chimpanzee and macaque cortical surfaces, respectively. For visualization purpose, the trace-map distances were normalized to 0–1. (a)–(b): top-down views of the color-coded trace-map distances between human vs chimpanzee (a), and distances between human vs macaque (b). The color bar is on the right. (c)–(d): left-side views of the color-coded trace-map distances between human vs chimpanzee (c), and distances between human vs macaque (d). (e)–(f): right-side views of the color-coded trace-map distances between human vs chimpanzee (e), and distances between human vs macaque (f).
Fig. 13.
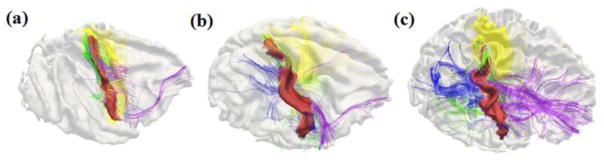
Joint visualization of post-central gyral shapes and the emanating DTI-derived fibers in three randomly selected primate brains. The fibers connecting to the frontal lobes are colored in purple, those fibers connecting to the occipital lobes are represented in blue, those fibers connecting the other hemisphere are colored in yellow, and those fibers connecting to the subcortical regions are colored in green. (a): Macaque. (b): Chimpanzee. (c): Human.
To further quantitatively evaluate the fiber connection consistencies of 65 common and 175 discrepant DICCCOLs in the three species of human, chimpanzee and macaque, we plotted the average trace-map distances between DICCCOLs in human and chimpanzee in Fig. 14a, and the average distances between DICCCOLs in human and macaque in Fig. 14b. It can be clearly seen that the trace-map distances for discrepant DICCCOLs are significantly higher than the common DICCCOLs for both human-chimpanzee (p-value = 0.001365) and human-macaque (p-value = 0.000113) comparisons. These results suggest that the trace-map model used here can be used in differentiating common and discrepant DICCCOLs.
Fig. 14.
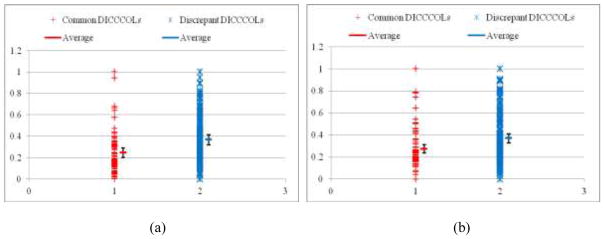
Distributions of averaged trace-map distances between DICCCOLs in human and chimpanzee brains (a), and these distances between DICCCOLs in human and macaque brains (b). The distances for 65 common and 175 discrepant DICCCOLs are in red and blue, respectively. The means and standard deviations are labeled for both common and discrepant DICCCOLs.
Finally, we present the p-values of the cross-species comparisons for the trace-maps of DICCCOL landmarks’ fibers. The statistical differences between the human-vs-human trace-map distances and human-vs-chimpanzee (or human-vs-macaque) trace-map distances were evaluated. Please see the Supplemental Table 1 and Supplemental Table 2 for p-values of 65 common DICCCOLs and 175 uncommon DICCCOLs. It should be noted that for a small portion of the 65 common DICCCOLs, despite their low p-values (e.g., smaller than 0.05), they are still deemed as consistent landmarks because the DTI-derived fiber connections exhibit relatively consistent patterns across individuals and species. Examples of visualizations of these DICCCOLs are provided in Supplemental Fig. 7 and the visualizations of all of the common DICCCOLs are available at http://www.cs.uga.edu/~tliu/primate.rar. Similarly, examples of the inconsistent DICCCOLs that were determined by experts’ visual evaluations, despite the p-values, are provided in Supplemental Fig. 8. For these inconsistent DICCCOLs, the variability could be attributed to multiple factors including the intrinsic variability of cortical architectures across species, the limitations of our current trace-map models, the inaccuracy of the DICCCOL prediction pipeline, the limitations in our DTI data, and the variability in DTI pre-processing and tractography. Therefore, in the current stage without quantitative differentiation of the above variations, we conservatively declare them as inconsistent ones.
3.4. Robustness of the landmark prediction framework
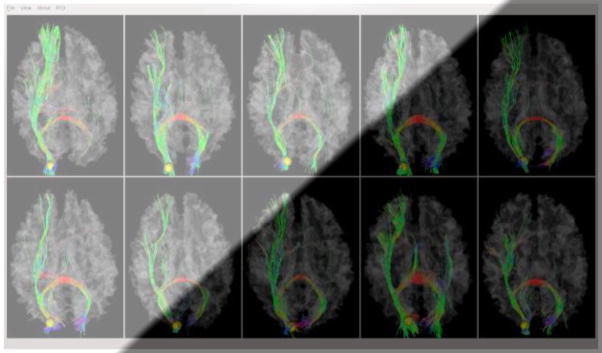
We examined the robustness of the DICCCOL landmark prediction framework (Zhu et al., 2012) by using two DTI imaging protocols: a single-shot double spin-echo EPI (SS-EPI) sequence and a multi-shot double spin-echo echo planar imaging (MS-EPI) sequence described in Section 2.1. Figs. 15a–15b show the joint visualizations of whole-brain fibers and cortical surface using multi-shot and single-shot DTI data, respectively. The detectable differences of fiber distributions in two datasets can be clearly appreciated. However, after the application of the DICCCOL landmark prediction framework in Section 2.3 on both datasets, the results are highly similar and consistent as shown in Figs. 15c–15d. This observation is reproducible in other consistent DICCCOLs, indicating high robustness and reliability of the landmark prediction framework.
Fig. 15.

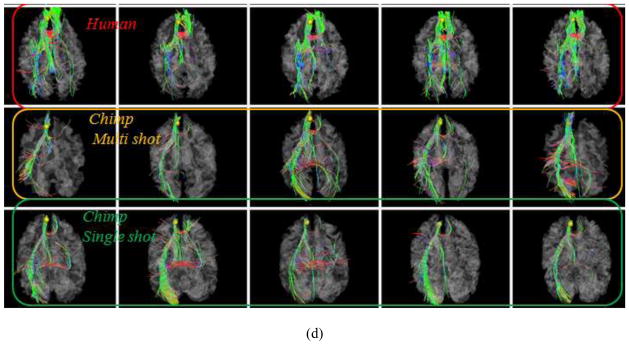
Results of DICCCOL landmark prediction in DTI data of different acquisition protocols (multi-shot vs. single-shot echo planar imaging). This figure illustrates two examples of landmark predictions by our method. The same chimpanzee subject was scanned using different DTI data acquisition protocols and parameters. (a) The joint visualization of whole-brain DTI-derived fiber tractography result and cortical surface using multi-shot DTI data. (b) The joint visualization of whole-brain DTI-derived fiber tractography result and cortical surface using single-shot DTI data. (c) Visualization of fiber bundles of the landmark in five human brains (top row), five chimpanzee brains with multi-shot DTI data (second row) and five macaque brains with single-shot DTI data (bottom row). (d) Visualization of fiber bundles of another landmark in five human brains (top row), five chimpanzee brains with multi-shot DTI data (second row) and five macaque brains with single-shot DTI data (bottom row).
To further examine the sensitivity and reproducibility of the DICCCOL landmark prediction framework (Zhu et al., 2012) with different neighborhood search sizes when locating the 358 DICCCOLs in chimpanzee and macaque brains, we used 3, 4 and 5 rings of surface mesh vertices as search ranges, respectively. Then, the Euclidean distances between the centers of those predicted DICCCOLs using three different search ranges are measured for each DICCCOL for chimpanzee and macaque brains. The histograms of the average Euclidean distances for 358 DICCCOLs for the same groups of chimpanzee and macaque brains in Section 2.1 are shown in Figs. 16a and 16b, respectively. The average, minimal and maximal distances in the chimpanzee brains over 358 DICCCOLs are 2.8 mm, 1.1 mm and 4.6 mm, respectively. Similarly, the average, minimal and maximal distances in the macaque brains over 358 DICCCOLs are 1.9 mm, 0.6 mm and 3.5 mm, respectively. Additional color-coded visualizations of the distributions of these distances are provided in Supplemental Fig. 5. These results demonstrated that the predicted DICCCOLs in both chimpanzee and macaque brains are highly reproducible and robust to different search ranges used in DICCCOL ROI prediction.
Fig. 16.
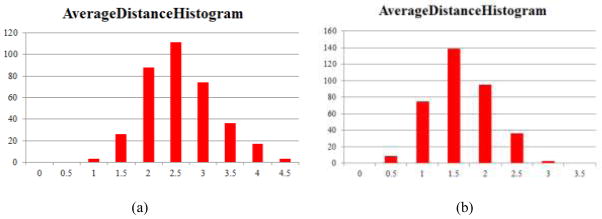
Histograms of average Euclidean distances between predicted DICCCOLs with three search ranges in chimpanzee (a) and monkey (b) brains. The horizontal axis and vertical axis represent distance (in mm) and the number of DICCCOLs, respectively.
4. Discussion and Conclusion
This paper details our studies of applying powerful DTI technique and advanced neuroimage analysis algorithms to study the structural connection patterns in three primate brains. From a technical perspective, this work is conceived to possess the following two contributions. 1) Our recent series of studies (Zhang et al., 2011; Zhu et al., 2011; Zhu et al., 2012) have shown that consistent white matter fiber connection patterns derived from DTI tractography are predictive of brain functions and it is possible to use a dense map of connectivity-based DICCCOL landmarks to represent common human brain architecture (Zhu et al., 2012). The studies in this paper particularly demonstrated that a portion of DICCCOL models and its prediction framework could possibly identify corresponding cortical landmarks in chimpanzee and macaque brains. This methodology offers a novel approach to studying brain evolution based on DTI data. 2) The novel cortical landmark discovery and prediction approaches can provide reliable and robust brain region correspondences across multiple primate brains, thus enabling powerful comparative analysis of structural connection patterns across primate species. The outcome of this study offers a quantitatively encoded representation of common brain architectures across macaque, chimpanzee and human. Given that consistent structural connectivity patterns are predictive of brain function, the work presented in this paper can lay down the foundations on which future studies can be performed to correlate DTI imaging-based parameters with brain functions and other social or ecological variables (Healy and Rowe 2007; Pollen et al., 2008).
From neuroscience perspective, our experimental results demonstrated that there is a deep-rooted regularity of structural connection patterns across many cortical landmarks in macaque, chimpanzee and human brains, and suggest that the 65 consistent DICCCOLs might reflect the evolutionarily-preserved common brain architectures across primates. Our prior studies have demonstrated the evolutionarily-preserved cortical folding and fiber connection patterns across macaque, chimpanzee and human brains (Chen et al., 2012). The work presented in this paper further confirmed the existence of large-scale evolutionarily-preserved cortico-cortical and cortico-subcortical fiber connections (e.g., those 65 common DICCCOLs) in the three species. Our comparative DTI analysis results also suggest that the uncovered common DICCCOLs are not evenly distributed across the whole cerebral cortex. Instead, they are more localized in the occipital and superior frontal areas and a portion of the superior parietal lobe, demonstrating the regional distributional differences of these common cortical landmarks and reflecting the regional differences of connection pattern evolutions. Another interesting observation is that the common DICCCOLs seem to be localized in a rostro-caudal chain along the inter-hemispheric fissure. Though we are not certain yet that the human brains evolved from its ancestors by preserving the midline part, there are recent neuroimaging evidences suggesting the existence of functional networks along the rostro-caudal axis in human brains (Blumenfeld et al., 2012) and, particularly, the homologies of functional networks across the rostro-caudal axis in both macaque and human brains (Margulies et al., 2009). The functional neuroimaging finding of the existence of rostro-caudal networks in macaque and human brains in the literature lends support to our DTI-based observations in this paper. In addition, both qualitative and quantitative analysis of the uncovered 175 discrepant DICCCOL ROIs suggest that the Broca’s area, the Wernicke’s area, the primary motor cortex, and the primary sensory cortex have concentrated discrepant ROI distributions, while the occipital lobes possess less discrepant ROIs. Notably, the discrepant DICCCOL ROIs in the motor and sensory regions exhibit much fewer fiber connections to the frontal lobe in chimpanzee and macaque brains in comparison with human brains, as shown in Fig. 13. This DTI-derived finding is reasonable and in agreement with literature findings (Semendeferi et al., 2001; Schoenemann et al., 2005). Altogether, the results reported in this paper suggest that the cross-species analysis of DTI-derived fiber connection patterns might provide the structural substrates of functional brain evolution, thus offering novel insights into the evolution of primate brains.
It should be noted that the fiber connection pattern quantified by the trace-map model (Zhang et al., 2011; Zhu et al., 2011) aims to capture and characterize the global fiber connection profile, while allowing for local variation. This is essential when we perform quantitative comparisons of fiber bundle shapes across different brain regions within and across species. In the current trace-map model, we did not weigh fiber connections to cortical regions (e.g., those to the frontal lobe) but considered them equally important as other connections such as those to subcortical regions and inter-hemispheric connections. Therefore, if the quantitative comparisons of trace-maps turn out to be substantially different for the same landmark across species, they are declared as discrepant, as shown in Fig. 12. Thus, we can see a large number of discrepant landmarks in the Broca’s, Wernicke’s, motor and sensory regions. That is, these defined discrepant landmarks exhibit substantially different global fiber connection profiles even though they may possess certain locally similar fiber brunches, e.g., the arcuate and superior longitudinal fasciculus from the Broca’s region. If the quantitative comparison of trace-maps exhibited high degree of similarity, e.g., those in the motor and sensory regions in Fig. 6, they are defined as consistent even though the connections to the frontal lobe are less pronounced in non-human primates. In short, whether or not a landmark is defined as consistent or discrepant depends on the overall shape and connection patterns, but not a local fiber branch. Therefore, the differentiation between consistent and discrepant landmarks is a relative concept, which is quantitatively measured and determined by the trace-map model and its statistical significance across groups of individuals.
In terms of future technical improvements, the DICCCOL prediction framework (Zhu et al., 2012) can be potentially further optimized to increase the accuracy of landmark localization. For instance, the consistency of structural connectivities among DICCCOL ROIs can be used as additional constraints for ROI prediction and optimization. Also, more anatomical information could be integrated into the ROI prediction framework, e.g., the major gyri and sulci could be parcellated and recognized first via folding pattern based methods (e.g., Li et al., 2009), which could be then used to constrain the local neighbourhood search of ROI optimization. In terms of quantitative comparison of fiber connection patterns, other metrics such as Hausdorff distances could be employed in addition to the trace-map distance used in this paper. Once the landmarks’ correspondences is established more accurately in different primate brains, their commonalities and non-commonalities could be refined based on the multiple information sources of structural, anatomical and connectional profiles.
In the current work, we only categorized the DICCCOL landmarks into either common (65) or uncommon (175) ones, and have not characterized the in-between class (118) due to the lack of sufficient understanding and quantitative description of the common primate brain architectures. As examples, Supplemental Fig. 6 show two figures of the in-between DICCCOL landmarks and their fiber connection patterns in three species. It is evident that these in-between landmarks cannot be readily categorized into either common or uncommon ones by visual inspection. This uncertainty might be attributed to the intrinsic variability of cortical architectures across species, the limitation of our trace-map models, errors in the DICCCOL prediction pipeline, noises in DTI, and the variability in DTI pre-processing and tractography. In the future, the trace-map model and the description of consistent fiber connection patterns will likely be significantly improved and augmented by including other anatomic and structural profiles. When a better understanding of brain architectures and additional measures, such as improved trace-map models, are available, we would be able to stratify and characterize the DICCCOL landmarks into more refined categories such as common, uncommon and in-between ones in the future. Furthermore, with the availability of more extensive anatomic and functional annotations of the DICCCOLs (Zhu et al., 2012; Yuan et al., 2012), we plan to examine the possibility of using different criteria in adaptively differentiating those common, uncommon and in-between landmarks in various brain networks and regions.
Despite that consistent white matter fiber connection patterns of DICCCOLs derived from DTI data reveal common brain architecture across primate brains and could be predictive of brain functions, it should be noted that the transfer of functional annotations of DICCCOLs in the human brain to chimpanzee and macaque brains needs to be further investigated via multimodal fMRI and DTI datasets in the future. For instance, the homologies of task-free functional networks in macaque and human brains derived from fMRI datasets (Vincent et al., 2007; Margulies et al., 2009) could be potentially used to evaluate and validate the transfer of functional annotations across primate brains via corresponding structural DICCCOLs. Nevertheless, the examination and validation of task-invoked brain networks, such as those for semantic decision making (Dennis et al., 2010; Rinnea et al., 2003; Hamalainen et al., 2007) and empathy (Langleben et al., 2009), across primate brains are much more challenging due to the difficulty in acquiring task-based fMRI data for macaques and chimpanzees.
Our other future work includes functional validation of the discovered common DICCCOL landmarks via fMRI. For instance, we plan to acquire fMRI data in anaesthetized macaque monkey brains and resting state human brains. Based on the multimodal DTI/fMRI data, we plan to identify functional brain networks that exhibit spontaneous oscillations among distant brain regions, and compare these functional networks across primate brains (e.g., Vincent et al., 2007; Ardila 2008). We hypothesize that joint analysis of structural and functional networks based on multimodal DTI and fMRI data (e.g., Honey, et al., 2009; Zhu et al., 2011) could potentially elucidate the co-evolution patterns of brain structure and function across primate brains, thus contributing to a better scientific understanding of the evolution of primate brains. Finally, we plan to further visually and quantitatively examine those human DICCCOLs that cannot find similar corresponding counterparts in the macaque and chimpanzee brains, and elucidate how the structural connection pattern evolves across primate brains and how they are correlated with the cortical folding patterns (Nie et al., 2011; Chen et al., 2012).
Supplementary Material
Supplemental Figure 1. Demonstration of global shape similarity between cortical surfaces after linear registration. The grey surface is human brain, the blue surface is chimpanzee brain, and the green surface is macaque brain. (a) The overlaid surfaces of human and chimpanzee brains. (b) The overlaid surfaces of human and macaque brains.
Supplemental Figure 2. The fibers and trace-maps of the same DICCCOL ROI in human, chimpanzee and monkey brains. (a): An example of one DICCCOL ROI located at the frontal pole in five human (top row), five chimpanzee (second row) and five macaque monkey (bottom row) brains. (b): The trace-maps of the fibbers of (a) in five human, five chimpanzee and five macaque brains.
Supplemental Figure 3. An example of a working memory landmark derived from task-based fMRI (Faraco et al., 2011; Zhu et al., 2012). (a) The joint visualization of cortical surfaces and the fibers emanating from the ROIs. (b) The corresponding trace-maps of the fiber bundles.
Supplemental Figure 4. Five examples of the consistence of fiber connections between cortical ROI and subcortical regions. The color bars are at the bottom.
Supplemental Figure 5. The Euclidean distances between the centers of the predicted DICCCOLs using three different search ranges (3, 4 and 5 rings of surface mesh vertices) are measured for each DICCCOL for chimpanzee and macaque brains. (a) The average distances of each DICCCOL ROI on chimpanzee brain surface over 8 subjects. The ROI’s average Euclidean distances in 8 subjects are color-coded on the cortical surface, and the color-bar is on the right side. Red means larger distance, while blue means smaller one. (b) The average distance of each DICCCOL ROI on macaque brain surface over 8 subjects. The ROI’s average Euclidean distances in 8 subjects are color-coded on the cortical surface, and the color bar is on the right side. Red means larger distance, while blue means smaller one.
Supplemental Figure 6. Two examples of in-between DICCCOL ROIs that are classified as neither common or uncommon ones. There are 118 of them in total.
Supplemental Figure 7. Examples of DICCCOL landmarks that are visually determined as common across three species. Visualizations of all of the common DICCCOLs are available at: http://www.cs.uga.edu/~tliu/primate.rar.
Supplemental Figure 8. DICCCOL landmarks that are visually determined as uncommon across three species.
http://www.cs.uga.edu/~tliu/PrimateSupplemental_Table_1.xlsx
http://www.cs.uga.edu/~tliu/PrimateSupplemental_Table_2.xlsx
Acknowledgments
T Liu was supported by the NIH Career Award EB 006878, NIH R01 HL087923-03S2, NIH R01 R01DA033393, NSF CAREER Award IIS-1149260, and The University of Georgia start-up research funding. L Li and X Hu were supported by NIH PO1 AG026423 and NIH R01 R01DA033393. K Li and D Zhang were supported by the China Government Scholarship. The authors would like to thank the anonymous reviewers for their constructive and helpful comments.
References
- Ardila A. On the evolutionary origins of executive functions. Brain and Cognition. 2008;68 (1):92–99. doi: 10.1016/j.bandc.2008.03.003. [DOI] [PubMed] [Google Scholar]
- Blumenfeld RS, Nomura EM, Gratton C, D’Esposito M. Lateral Prefrontal Cortex is Organized into Parallel Dorsal and Ventral Streams Along the Rostro-Caudal Axis. Cerebral Cortex. 2012 doi: 10.1093/cercor/bhs223. in press. [DOI] [PMC free article] [PubMed] [Google Scholar]
- Biswal BB. Toward discovery science of human brain function. PNAS. 2010;107(10):4734–4739. doi: 10.1073/pnas.0911855107. [DOI] [PMC free article] [PubMed] [Google Scholar]
- Chen H, Zhang T, Guo L, Li K, Yu X, Li L, Hu X, Han J, Hu X, Liu T. Coevolution of Gyral Folding and Structural Connection Patterns in Primate Brains. Cerebral Cortex. 2012 doi: 10.1093/cercor/bhs113. in press. [DOI] [PMC free article] [PubMed] [Google Scholar]
- Clark DA, Mitra PP, Wang SS. Scalable architecture in mammalian brains. Nature. 2001;411:10. doi: 10.1038/35075564. [DOI] [PubMed] [Google Scholar]
- Deacon TW. Fallacies of progression in theories of brain-size evolution. International Journal of Primatology. 1990a;11:193–236. [Google Scholar]
- Dennis NA, Browndyke JN, Stokes J, Need A, Burke JR, Welsh-Bohmer KA, Cabeza R. Temporal lobe functional activity and connectivity in young adult APOE 34 carriers. Alzheimer’s & Dementia. 2010;6:303–311. doi: 10.1016/j.jalz.2009.07.003. [DOI] [PMC free article] [PubMed] [Google Scholar]
- Derrfuss J, Mar RA. Lost in localization: the need for a universal coordinate database. Neuro Image. 2009;48(1):1–7. doi: 10.1016/j.neuroimage.2009.01.053. [DOI] [PubMed] [Google Scholar]
- Ethridge LE, Brahmbhatt S, Gao Y, McDowell JE, Clementz BA. Consider the context: blocked versus interleaved presentation of antisaccade trials. Psychophysiology. 2009;46(5):1100–1107. doi: 10.1111/j.1469-8986.2009.00834.x. [DOI] [PMC free article] [PubMed] [Google Scholar]
- Faraco CC, Unsworth N, Langley J, Terryb D, Li K, Zhang D, Liu T, Miller LS. Complex span tasks and hippocampal recruitment during working memory. Neuro Image. 2011;55(2):773–787. doi: 10.1016/j.neuroimage.2010.12.033. [DOI] [PubMed] [Google Scholar]
- Fernández G, de Greiff A, von Oertzen J, Reuber M, Lun S, Klaver P, Ruhlmann J, Reul J, Elger CE. Language mapping in less than 15 minutes: real-time functional MRI during routine clinical investigation. Neuroimage. 2001;14(3):585–594. doi: 10.1006/nimg.2001.0854. [DOI] [PubMed] [Google Scholar]
- Frey BJ, Dueck D. Clustering by passing messages between data points. Science. 2007;315:972–976. doi: 10.1126/science.1136800. [DOI] [PubMed] [Google Scholar]
- Friston KJ. Modalities, modes, and models in functional neuroimaging. Science. 2009;326(5951):399–403. doi: 10.1126/science.1174521. [DOI] [PubMed] [Google Scholar]
- Hamalainen A, Pihlajamaki M, Tanila H, Hanninen Y, Niskanen E, Tervo S, Karjalainen PA, Vanninen RL, Soininen H. Increased fMRI responses during encoding in mild cognitive impairment. Neurobiology of Aging. 2007;28:1889–1903. doi: 10.1016/j.neurobiolaging.2006.08.008. [DOI] [PubMed] [Google Scholar]
- Healy SD, Rowe C. A critique of comparative studies of brain size. Proc R Soc B. 2007;274:453–464. doi: 10.1098/rspb.2006.3748. [DOI] [PMC free article] [PubMed] [Google Scholar]
- Honey CJ, Sporns O, Cammoun L, Gigandet X, Thiran JP, Meuli R, Hagmann P. Predicting human resting-state functional connectivity from structural connectivity. PNAS. 2009;106(6):2035–40. doi: 10.1073/pnas.0811168106. [DOI] [PMC free article] [PubMed] [Google Scholar]
- Krubitzer L. In Search of a Unifying Theory of Complex Brain Evolution, The Year in Cognitive Neuroscience 2009: Ann. NY Acad Sci. 2009;1156:44–67. doi: 10.1111/j.1749-6632.2009.04421.x. [DOI] [PMC free article] [PubMed] [Google Scholar]
- Langleben DD, Loughead JW, Ruparel K, Hakun JG, Busch-Winokur S, Holloway MB, Strasser AA, Cappella JN, Lerman C. Reduced prefrontal and temporal processing and recall of high “sensation value” ads. Neuro Image. 2009;46:219–225. doi: 10.1016/j.neuroimage.2008.12.062. [DOI] [PMC free article] [PubMed] [Google Scholar]
- Li G, Guo L, Nie J, Liu T. Automatic cortical sulcal parcellation based on surface principal direction flow field tracking. Neuro Image. 2009;46(4):923–37. doi: 10.1016/j.neuroimage.2009.03.039. [DOI] [PMC free article] [PubMed] [Google Scholar]
- Li K, Guo L, Faraco C, Zhu D, Chen H, Yuan Y, Lv J, Deng F, Jiang X, Zhang T, Hu X, Zhang D, Miller L, Liu T. Visual Analytics of Brain Networks. Neuro Image. 2012 doi: 10.1016/j.neuroimage.2012.02.075. in press. [DOI] [PMC free article] [PubMed] [Google Scholar]
- Liu T. A few thoughts on Brain ROIs. Brain Imaging and Behavior. 2011;5(3):189–202. doi: 10.1007/s11682-011-9123-6. [DOI] [PMC free article] [PubMed] [Google Scholar]
- Liu T, Nie J, Tarokh A, Guo L, Wong S. Reconstruction of Central Cortical Surface from MRI Brain Images: Method and Application. Neuro Image. 2008;40(3):991–1002. doi: 10.1016/j.neuroimage.2007.12.027. [DOI] [PMC free article] [PubMed] [Google Scholar]
- Liu T, Shen D, Davatzikos C. Deformable Registration of Cortical Structures via Hybrid Volumetric and Surface Warping. Neuro Image. 2004;22(4):1790–1801. doi: 10.1016/j.neuroimage.2004.04.020. [DOI] [PubMed] [Google Scholar]
- Liu T, Li H, Wong K, Tarokh A, Guo L, Wong S. Brain Tissue Segmentation Based on DTI Data. Neuro Image. 2007;38(1):114–123. doi: 10.1016/j.neuroimage.2007.07.002. [DOI] [PMC free article] [PubMed] [Google Scholar]
- Margulies DS, Vincent JL, Kelly C, Lohmann G, Uddin LQ, Biswal BB, Villringer A, Castellanos FX, Milham MP, Petrides M. Precuneus shares intrinsic functional architecture in humans and monkeys. Proc Natl Acad Sci USA. 2009;106:20069–20074. doi: 10.1073/pnas.0905314106. [DOI] [PMC free article] [PubMed] [Google Scholar]
- Mori S. Principles of Diffusion tensor imaging and its applications to basic neuroscience research. Neuron. 2006;51(5):527–539. doi: 10.1016/j.neuron.2006.08.012. [DOI] [PubMed] [Google Scholar]
- Nie J, Guo L, Li K, Wang Y, Chen G, Li L, Chen H, Deng F, Jiang X, Zhang T, Huang L, Faraco C, Zhang D, Guo C, Pew-Thian Y, Hu X, Li G, Lv J, Yuan Y, Zhu D, Han J, Sabatinelli D, Zhao Q, Miller LS, Xu B, Shen P, Platt S, Shen D, Hu X, Liu T. Axonal Fiber Terminations Concentrate on Gyri. Cerebral Cortex. 2011 doi: 10.1093/cercor/bhr361. in press. [DOI] [PMC free article] [PubMed] [Google Scholar]
- Passingham RE, Stephan KE, Kötter R. The anatomical basis of functional localization in the cortex. Nat Rev Neurosci. 2002;3(8):606–616. doi: 10.1038/nrn893. [DOI] [PubMed] [Google Scholar]
- Pollen AA, Hofmann HA. Beyond Neuroanatomy: Novel Approaches to Studying Brain Evolution. Brain Behav Evol. 2008;72:145–158. doi: 10.1159/000151474. [DOI] [PubMed] [Google Scholar]
- Raichle ME, MacLeod AM, Snyder AZ, Powers WJ, Gusnard DA, Shulman GL. A default mode of brain function. Proc Natl Acad Sci USA. 2001;98:676–682. doi: 10.1073/pnas.98.2.676. [DOI] [PMC free article] [PubMed] [Google Scholar]
- Rakic P. Evolution of the neocortex: a perspective from developmental biology. Nature Reviews Neuroscience. 2009;10:724–735. doi: 10.1038/nrn2719. [DOI] [PMC free article] [PubMed] [Google Scholar]
- Rilling JK, Insel TR. The primate neocortex in comparative perspective using magnetic resonance imaging. Journal of Human Evolution. 1999;37:191–223. doi: 10.1006/jhev.1999.0313. [DOI] [PubMed] [Google Scholar]
- Rilling JK, Seligman RA. A quantitative morphometric comparative analysis of the primate temporal lobe. Journal of Human Evolution. 2002;42(5):505–533. doi: 10.1006/jhev.2001.0537. [DOI] [PubMed] [Google Scholar]
- Rilling JK, Glasser MF, Preuss TM, Ma X, Zhao T, Hu X, Behrens TEJ. The evolution of the arcuate fasciculus revealed with comparative DTI. Nature Neuroscience. 2008;11:426–428. doi: 10.1038/nn2072. [DOI] [PubMed] [Google Scholar]
- Rinnea JO, Laineb M, Hiltunenc J, Erkinjuntti T. Semantic decision making in early probable AD: a PET activation study. Cognitive Brain Research. 2003;18:89–96. doi: 10.1016/j.cogbrainres.2003.09.009. [DOI] [PubMed] [Google Scholar]
- Rogers J, Kochunov P, Zilles K, Shelledy W, Lancaster J, Thompson P, Duggirala R, Blangero J, Fox PT, Glahnc DC. On the genetic architecture of cortical folding and brain volume in primates. Neuro Image. 2010;53(3):15, 1103–1108. doi: 10.1016/j.neuroimage.2010.02.020. [DOI] [PMC free article] [PubMed] [Google Scholar]
- Sabatinelli D, Lang PJ, Bradley MM, Costa VD, Keil A. The timing of emotional discrimination in human amygdala and ventral visual cortex. Journal of Neuroscience. 2011 doi: 10.1523/JNEUROSCI.3278-09.2009. in press. [DOI] [PMC free article] [PubMed] [Google Scholar]
- Semendeferi K, Armstrong E, Schleicher A, Zilles K, Van HG. Prefrontal Cortex in Humans and Apes: A Comparative Study of Area 10. AMERICAN JOURNAL OF PHYSICAL ANTHROPOLOGY. 2001;114:224–241. doi: 10.1002/1096-8644(200103)114:3<224::AID-AJPA1022>3.0.CO;2-I. [DOI] [PubMed] [Google Scholar]
- Schoenemann PT. Evolution of the Size and Functional Areas of the Human Brain. Annual Review of Anthropology. 2006;35:379–406. [Google Scholar]
- Schoenemann PT, Sheehan MJ, Glotzer LD. Prefrontal white matter volume is disproportionately larger in humans than in other primates. Nature Neuroscience. 2005;8:242– 252. doi: 10.1038/nn1394. [DOI] [PubMed] [Google Scholar]
- Stephan H, Andy OJ. Quantitative comparative neuroanatomy of primates: an attempt at a phylogenetic interpretation. Annals of the New York Academy of Sciences. 1969;167:370–387. [Google Scholar]
- Stephan H, Baron G, Frahm HD. Comparative size of brain and brain components. Comp Primate Biol. 1988;4:1–38. [Google Scholar]
- Stephan H, Bauchot R, Andy O. Advances in Primatology. 1970. Data on size of the brain and of various brain parts in insectivores and primates. M Noback The Primate Brain; pp. 289–297. [Google Scholar]
- Stephan H, Frahm H, Baron G. New and revised data on volumes of brain structures in insectivores and primates. Folia primatol. 1981;35:1–29. doi: 10.1159/000155963. [DOI] [PubMed] [Google Scholar]
- Vincent JL, Patel GH, Fox MD, Snyder AZ, Baker JT, Van Essen DC, Zempel JM, Snyder Corbetta LH, Raichle MME. Intrinsic functional architecture in the anaesthetized monkey brain. NATURE. 2007;447:3. doi: 10.1038/nature05758. [DOI] [PubMed] [Google Scholar]
- Woods RP, Fears SC, Jorgensen MJ, Fairbanks LA, Toga AW, Freimer NB. A web-based brain atlas of the vervet monkey, Chlorocebus aethiops. Neuro Image. 2011;54(3):1872–1880. doi: 10.1016/j.neuroimage.2010.09.070. [DOI] [PMC free article] [PubMed] [Google Scholar]
- Xuan B, Zhang D, He S, Chen X. Larger stimuli are judged to last longer. Journal of Vision. 2007;7(10):2, 1–5. doi: 10.1167/7.10.2. [DOI] [PubMed] [Google Scholar]
- Yuan Y, Jiang X, Zhu D, Chen H, Li K, Lv P, Yu X, Li X, Zhang S, Zhang T, Hu X, Han J, Guo L, Liu T. Meta-analysis of Functional Roles of DICCCOLs. Neuroinformatics. 2012 doi: 10.1007/s12021-012-9165-y. in press. [DOI] [PMC free article] [PubMed] [Google Scholar]
- Zhang T, Guo L, Hu X, Li K, Jin C, Cui G, Li L, Liu T. Predicting Functional Cortical ROIs based on Fiber Shape Models. Cerebral Cortex. 2011 doi: 10.1093/cercor/bhr152. in press. [DOI] [PMC free article] [PubMed] [Google Scholar]
- Zhang P, Chen X, Yuan P, Zhang D, He S. The effect of visuospatial attentional load on the processing of irrelevant acoustic distractors. Neuroimage. 2006;33(2):715–724. doi: 10.1016/j.neuroimage.2006.07.015. [DOI] [PubMed] [Google Scholar]
- Zhu D, Li K, Faraco CC, Deng F, Zhang D, Guo L, Miller LS, Liu T. Optimization of Functional Brain ROIs via Maximization of Consistency of Structural Connectivity Profiles. Neuro Image. 2011 doi: 10.1016/j.neuroimage.2011.08.037. accepted. [DOI] [PMC free article] [PubMed] [Google Scholar]
- Zhu D, Li K, Guo L, Jiang X, Zhang T, Zhang D, Chen H, Deng F, Faraco C, Jin C, Wee CY, Yuan Y, Lv P, Yin Y, Hu X, Duan L, Hu X, Han J, Wang L, Shen D, Miller LS, Li L, Liu T. DICCCOL: Dense Individualized and Common Connectivity-based Cortical Landmarks. Cerebral Cortex. 2012 doi: 10.1093/cercor/bhs072. in press. [DOI] [PMC free article] [PubMed] [Google Scholar]
- Zilles K, Armstrong E, Moser KH, Schleicher A, Stephan H. Gyrification in the cerebral cortex of primates. Brain Behav. 1989;34:143–150. doi: 10.1159/000116500. [DOI] [PubMed] [Google Scholar]
- Zilles K, Armstrong E, Schleicher A, Kretschmann HJ. The human pattern of gyrification in the cerebral cortex. Anatomy and Embryology. 1988;179:173–179. doi: 10.1007/BF00304699. [DOI] [PubMed] [Google Scholar]
Associated Data
This section collects any data citations, data availability statements, or supplementary materials included in this article.
Supplementary Materials
Supplemental Figure 1. Demonstration of global shape similarity between cortical surfaces after linear registration. The grey surface is human brain, the blue surface is chimpanzee brain, and the green surface is macaque brain. (a) The overlaid surfaces of human and chimpanzee brains. (b) The overlaid surfaces of human and macaque brains.
Supplemental Figure 2. The fibers and trace-maps of the same DICCCOL ROI in human, chimpanzee and monkey brains. (a): An example of one DICCCOL ROI located at the frontal pole in five human (top row), five chimpanzee (second row) and five macaque monkey (bottom row) brains. (b): The trace-maps of the fibbers of (a) in five human, five chimpanzee and five macaque brains.
Supplemental Figure 3. An example of a working memory landmark derived from task-based fMRI (Faraco et al., 2011; Zhu et al., 2012). (a) The joint visualization of cortical surfaces and the fibers emanating from the ROIs. (b) The corresponding trace-maps of the fiber bundles.
Supplemental Figure 4. Five examples of the consistence of fiber connections between cortical ROI and subcortical regions. The color bars are at the bottom.
Supplemental Figure 5. The Euclidean distances between the centers of the predicted DICCCOLs using three different search ranges (3, 4 and 5 rings of surface mesh vertices) are measured for each DICCCOL for chimpanzee and macaque brains. (a) The average distances of each DICCCOL ROI on chimpanzee brain surface over 8 subjects. The ROI’s average Euclidean distances in 8 subjects are color-coded on the cortical surface, and the color-bar is on the right side. Red means larger distance, while blue means smaller one. (b) The average distance of each DICCCOL ROI on macaque brain surface over 8 subjects. The ROI’s average Euclidean distances in 8 subjects are color-coded on the cortical surface, and the color bar is on the right side. Red means larger distance, while blue means smaller one.
Supplemental Figure 6. Two examples of in-between DICCCOL ROIs that are classified as neither common or uncommon ones. There are 118 of them in total.
Supplemental Figure 7. Examples of DICCCOL landmarks that are visually determined as common across three species. Visualizations of all of the common DICCCOLs are available at: http://www.cs.uga.edu/~tliu/primate.rar.
Supplemental Figure 8. DICCCOL landmarks that are visually determined as uncommon across three species.
http://www.cs.uga.edu/~tliu/PrimateSupplemental_Table_1.xlsx
http://www.cs.uga.edu/~tliu/PrimateSupplemental_Table_2.xlsx