

Abstract
The microtubule associated protein tau is essential for the development and maintenance of the nervous system. Tau dysfunction is associated with a class of diseases called tauopathies, in which tau is found in an aggregated form. This paper focuses on a small aggregating fragment of tau, 273GKVQIINKKLDL284, encompassing the (PHF6*) region that plays a central role in tau aggregation. Using a combination of simulations and experiments, we probe the self-assembly of this peptide, with an emphasis on characterizing the early steps of aggregation. Ion-mobility mass spectrometry experiments provide a size distribution of early oligomers, TEM studies provide a time course of aggregation, and enhanced sampling molecular dynamics simulations provide atomistically detailed structural information about this intrinsically disordered peptide. Our studies indicate that a point mutation, as well the addition of heparin, lead to a shift in the conformations populated by the earliest oligomers, affecting the kinetics of subsequent fibril formation as well as the morphology of the resulting aggregates. In particular, a mutant associated with a K280 deletion (a mutation that causes a heritable form of neurodegeneration/dementia in the context of full length tau) is seen to aggregate more readily than its wild-type counterpart. Simulations and experiment reveal that the ΔK280 mutant peptide adopts extended conformations to a greater extent than the wild-type peptide, facilitating aggregation through the pre-structuring of the peptide into a fibril-competent structure.
Introduction
Tau function is important both during neuronal development (when new axonal processes and connections are established), as well as in mature neurons (when axonal microtubules serve as the tracks along which axonal transport takes place).[1, 2] Mechanistically, tau serves to stabilize microtubules by regulating their growing and shortening dynamics.[2–4] Given the critical role of this protein, it is not surprising that tau dysfunction is associated with a number of neurodegenerative diseases. These diseases, collectively known as tauopathies,[5, 6] are characterized pathologically by intracellular aggregates of tau in neurons and glial cells. In the case of Alzheimer’s disease, the extent and anatomical localization of tau aggregates is well correlated with the progression of the disease,[7, 8] suggesting an intimate link between tau aggregation and neuronal dysfunction.
At the ultrastructural level, pathological tau aggregates are assembled in either straight or paired helical filaments (PHFs) . [9–11]These aggregates typically show a cross-β pattern that is common to many aggregated proteins. [12–19]Aggregates with cross-β, amyloid structure are associated with a number of diseases, including Jakob-Kreutzfeld’s disesease (prion), Parkinson’s disease (alpha-synuclein), diabetes mellitus type II (amylin) and Alzheimer’s disease (amyloid-β protein and tau itself). Even though the formation of amyloid aggregates is common to many proteins and is often associated with enhanced toxicity, tau has unique properties.[9] For example, tau is characterized by a high percentage of hydrophilic and charged residues that make it extremely soluble, even at high temperature and low pH. Additionally, it is extremely flexible and is classified as an unstructured protein due to its low propensity to form secondary structure.[20] The factors that drive this normally unstructured, highly soluble protein to self-aggregate are not well understood.
In the adult human brain, six tau isoforms are produced through alternative splicing of a single mRNA transcript. These isoforms contain either three or four pseudo-repeat units (3R or 4R tau, respectively) separated by short inter-repeat regions (Fig. 1(a)). Together, the pseudo-repeats and inter-repeats form the microtubule binding region (MTBR). This region is essential for tau’s ability to bind to and stabilize microtubules. It also forms the protease-resistant core of the tau aggregates that are commonly associated with disease.[9]
Fig 1.
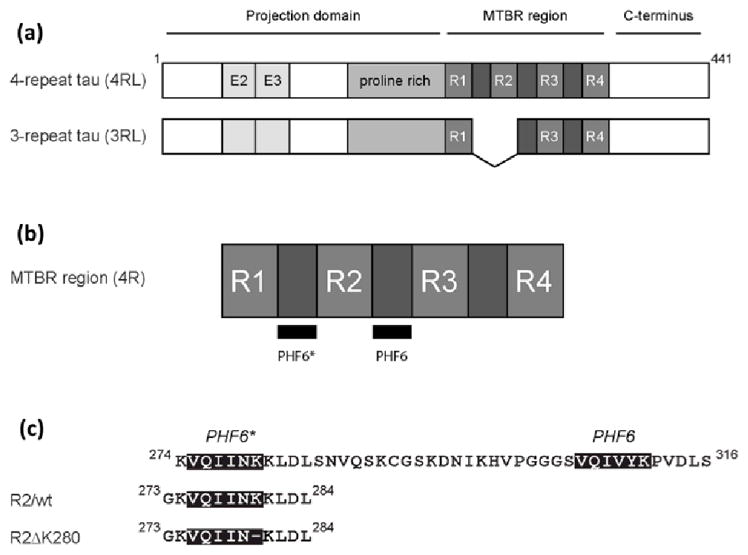
Tau isoforms, location of PHF6* and PHF6, and constructs used in this study. (a) The longest tau isoforms contain either three or four imperfect repeats in the microtubule-binding repeat region (MTBR). The amino terminal half of each protein contains two alternatively spliced exons (E2 and E3) and a proline rich region. (b) The MTBR region of 4-repeat tau, showing the locations of PHF6* and PHF6.(c) A closer view of PHF6*, PHF6, and the intervening sequence. The sequence of the two tau peptides used in this study (R2/wt and R2/ΔK280) are shown.
Recently, it was shown that two small segments in the MTBR are essential in order for tau to aggregate.[21, 22] These segments correspond to the 306VQIVYK311 segment (referred to as PHF6), located in the inter-repeat between the second and third repeats in 4R tau and in the inter-repeat between the first and second repeats in 3R tau, and the 275VQIINK280 sequence (referred to as PHF6*), located in the inter-repeat between the first and second repeat in 4R tau (Fig. 1(b)). Deletion of PHF6* slows down the formation of tau aggregates.[23] The presence of the PHF6* sequence in 4R tau but not 3R tau may account for the increased propensity of 4R tau to aggregate in vitro, relative to 3R tau.[24–26] Interestingly, a number of tau mutations leading to frontotemporal dementia are located within or close to the PHF6* region, including G272V, N279K and ΔK280. Many mutations within PHF6* that promote aggregation involve a charged residue, suggesting that changes in the electrostatic interactions around this region may affect the peptide's aggregation propensity. It is well established that the aggregation of tau is very sensitive to the presence of polyanions, such as heparin, in solution.[9] These molecules can dramatically increase the protein’s aggregation rate, further highlighting the role of electrostatic interactions in the aggregation of tau.
Mandelkow and co-workers[22] have designed and studied a short aggregating fragment of tau that contains the PHF6* region (fragment R2/wt: 273GKVQIINKKLDL284) as well as a ΔK280 variant of this peptide (fragment R2/ΔK280: 273GKVQIIN_KLDL284). (Fig. 1(c)) Their experiments show that even in the context of this short fragment, the K deletion mutation leads to increased aggregation rates. FTIR studies on solutions containing monomeric and oligomeric structures indicate that on average, the R2/ΔK280 fragment shows greater β-structure than R2/wt. They also use electron microscopy (EM) studies to show that both fragments form fibers rather than full-fledged paired helical filaments (PHF). These two observations led the authors to conclude that the PHF6* segment played a role in nucleating aggregation through its pre-disposition (particularly in the case of the ΔK280 mutation) to populate β-rich structures, but that other segments of tau are needed to generate the PHF morphology.
Given the importance of early conformational changes in the aggregation of these peptides, as suggested by these experiments, we undertook a combined experimental/theoretical study of the monomeric and small oligomeric species populated by R2/wt and R2/ΔK280. We used ion mobility-mass spectrometry (IM-MS) experiments to characterize the size distribution of the oligomers as a function of time, and replica exchange molecular dynamics simulation (REMD) to obtain structures of the smallest oligomers. Theoretical collision cross-sections were calculated for the structures obtained from simulations, and compared to experimental values. These studies were complemented by transmission electron microscopy (TEM) experiments to assess fibril formation in solution. Our overall aim was to examine at an atomistic level the conformational differences arising between R2/wt and R2/ΔK280 in the presence and absence of heparin, and to use this information to understand how conformational differences that are present in the monomeric and small oligomeric states can translate into differences in aggregation propensities.
Methods
For all the peptides considered in this work we have used sequences with blocked N- and C-termini to avoid problems with the charged termini and to better mimic the fragments’ conditions within the full-length protein.[27] Specifically, the peptides are acetylated at the N-terminus and amidated at the C-terminus.
Simulations
Replica exchange molecular dynamics simulations (REMD)
The simulations were performed using the package GROMACS[28–31] using the OPLS-AA[32–34] force field in the canonical NVT ensemble. The simulations were performed in explicit TIP3P water model[35] and the net positive charge on the protein was neutralized with chloride ions. All the bonds were constrained using the LINCS[36](protein) or SETTLE[37] (water) algorithm. A real space cut-off of 1.2 nm was used for both electrostatic and van der Waals interactions. Long range electrostatic was computed according to the particle mesh Ewald method.[38, 39] The Nosé-Hoover algorithm[40–42] was used to keep the temperature constant. The leap-frog algorithm[43] with a time step of 2fs was employed to integrate the equations of motion.
To improve the sampling efficiency, replica exchange molecular dynamics (REMD)[44–46] was employed. Replicas are exchanged every 3 ps with an average acceptance ratio of 25%. The temperature range was 290–492K (62 replicas) for the monomers and 290–350K (24 replicas) for the dimers. The simulations were 350ns (monomer) and 480ns (dimer) long, with the initial 100ns (monomer) and 150ns (dimer) discarded as equilibration data. Detailed information for each simulation is provided in the electronic supplementary information.
Another set of REMD simulations was performed with the protein in vacuum, in order to identify features in the IM-MS spectrum due to gas phase structures. In these simulations no cutoff was employed for both electrostatic and dispersion forces. No periodic boundaries conditions were used as well, and the Langevin thermostat was used with a coupling constant of 2ps and an integration step of 1fs. Further detail on the simulation protocol can be found in the electronic supplementary information.
Data analysis
The analysis of the molecular dynamic trajectories was performed using the standard tools available with the package GROMACS, unless otherwise specified.
In the following discussion we have used the following definitions:
Hydrogen bonds are considered to be present if the distance between the oxygen and the hydrogen is less than 0.25 nm and the angle OHN is less than 30 degrees.
The end-to-end distance (Ree) is defined as the distance between the center of mass of the CH3 group of the acetylated terminus and the NH2 group of the amidated terminus.
Relevant conformations were identified through the Daura algorithm[47] for clustering structures. This algorithm works by comparing the conformations of the backbones (excluding the terminal groups) of two structures, and grouping together structures that have similar root mean square deviations (RMSD). Structures are considered as belonging to the same group if their RMSD differs by less than 0.14nm for monomers and 0.26nm for dimers.
In order to compare the simulation data with the experimental cross-sections, the program MOBCAL[48–50] was used to compute the collisional cross-section (CCS) using the trajectory method from the REMD trajectory. Further details about this procedure can be found in the electronic supplementary information.
Ion mobility-mass spectrometry
Sample Preparation
Lyophilized samples of R2/wt (Ac–GKVQIINKKLDL–NH2) and R2/ΔK280 (Ac–GKVQIINKLDL–NH2) were purchased from Genscript (Piscataway, NJ). Samples were dissolved in 20mM ammonium acetate buffer (pH 7.0) for a final concentration of 100 μM, unless otherwise indicated. 6 kDa poly-disperse heparin was purchased from Sigma.
IM-MS Experiments
Mass spectrometry and ion mobility experiments were performed using a home built, high-resolution instrument.[51–55] These methods have been successfully used to study aggregating systems including peptides in the size range used here.[54] Samples were electrosprayed using gold coated nanoESI capillaries. For mass spectrometry experiments, the ions generated are guided through an ion funnel, pass through a 2m drift tube filled with ~13 torr helium gas. [55] [56] After exiting the cell, the analyte is collected by a second ion funnel, focused into a quadrupole mass filter, and detected as a function of time. This data is recorded as an arrival time distribution (ATD). A more detailed description of the instrument may be found in Ref. [51].
In the rest of the paper, the charges associated with each feature of the mass spectrum will be reported as z=q/e (where –e is the charge of an electron and q is the charge of the ion).
Transmission electron microscopy (TEM)
Sample Preparation A working stock (2 mM) of the R2/wt peptide was prepared by dissolving the lyophilized peptide in filtered deionized water. This stock was divided into several tubes, flash-frozen in liquid nitrogen, and stored at −80C until use. Because tau constructs containing the ΔK280 mutation have a high propensity to aggregate, we modified this procedure for R2/ΔK280. For this mutant, a 500 uM stock was prepared in deionized water, divided into single-use aliquots, flash-frozen in liquid nitrogen, and then lyophilized to guard against uncontrolled aggregation.
TEM Experiments. Tau peptides were diluted to 100 uM in buffer, in the presence or absence of heparin (6 kDa poly-disperse; Sigma), and incubated for various amounts of time at room temperature. At the appropriate time point, samples were fixed and prepared for TEM essentially as described.[57] Briefly, samples were fixed for 15 min with glutaraldehyde (1.6% final; Electron Microscopy Sciences), and then absorbed onto 300-mesh formvar-coated copper grids (Electron Microscopy Sciences) for 1.5 min. Grids were then coated with 1 mg/ml cytochrome c to encourage even staining, rinsed with deionized water, and then negatively stained for 20 sec with 2% uranyl acetate (Ted Pella, Inc). Samples were viewed on a JEOL-1230 transmission electron microscopy operating at 80 kV, and images were captured with an ORCA camera and AMT Image Capture Software Version 5.24.
Thioflavin-T (ThT) binding assays
Thioflavin-T (ThT) was purchased from AnaSpec Inc. (Fremont, CA). A ThT stock solution (1 mM) was prepared in ethanol and stored in the dark. Reaction mixtures of peptide (50 μM) with and without heparin were prepared in 20 mM ammonium acetate buffer, pH 7.0. When heparin was present, the molar ratio of the peptide to heparin was 4 to 1. For each time point, 25 μL of the reaction mixture was diluted in 225 μL of 22 μM ThT in phosphate buffered saline (PBS) and incubated in the dark for 45 minutes. ThT fluorescence was then measured with excitation at 450 nm and emission at 525 nm using a Wallac 1420 spectrofluorometer (PerkinElmer). Control experiments showed that ThT signal was not saturated under these conditions (see Fig. S4).
Results and discussion
Changes in the early oligomer distributions of R2/wt and R2/ΔK280, both in the presence and absence of heparin
The aggregation of R2/wt and R2/ΔK280 was monitored using IM-MS and TEM in the presence and absence of heparin. Consistent with the experiments of Mandelkow and co-workers,[22] fibril formation is modest in the absence of heparin, both for R2/wt and R2/ΔK280, with few aggregates observed in TEM even after incubations of one week or longer. Samples removed for TEM analysis at various time points showed a small number of aggregates that appeared to be either amorphous, or consist of bundles of fibrils. Addition of heparin to the solution dramatically enhanced fibril formation. Samples of R2/wt:heparin or R2/ΔK280:heparin were removed for TEM immediately (time zero), after 1 h, and after 24 h. For R2/wt, a mix of globular aggregates and short fibers were present immediately after the addition of heparin (Fig. 2(a)). After 1h (Fig. 2(b)), the aggregates had elongated and formed fibrils with a beaded appearance. After 24 h (Fig. 2(c)), the beaded structures had disappeared and R2/wt formed full-fledged fibrils. An interpretation consistent with these data is that beaded fibers represent a transition state between globular aggregates and fibers. In the case of the R2/ΔK280 peptide, the earliest sample contained a mixture of globular aggregates and short fibers (Fig. 2(d)), as was the case for the wild-type. However, in contrast to R2/wt, full-fledged R2/ΔK280 fibers are already formed at 1 h and no fibrils with a beaded appearance are present (Fig. 2(e)). These TEM time course studies indicated that R2/ΔK280 aggregates more rapidly than R2/wt in the presence of heparin.[58] ThT-binding assay results support these conclusions (see Fig. 3), demonstrating that the R2/ΔK280 mutant forms structures with β-content faster than the wild-type peptide, although the R2/wt eventually reaches higher ThT-binding signals over an extended time period. In contrast, in the absence of heparin, ThT binding assays for the peptides do not show significant fibril formation within 24 hours (Fig. 3), consistent with TEM observations.
Fig 2.

TEM time course of aggreation in ammonium acetate, pH 7.0 containing heparin (25 μM). (a) At time zero, R2/wt has a combination of round aggregates and short fibers. (b) R2/wt fibers are elongated after 1h, but many exhibit a beaded appearance. (c) Numerous well-formed R2/wt fibers are present after 24h. For R2/ΔK280, the time zero sample (d) showed many short fibers and some round aggregates. (e) Many R2/ΔK280 fibers were present after 1h, and these were not beaded. (f) Numerous R2/ΔK280 fibers were present after 24h. Scale bars = 500 nm
Fig 3.
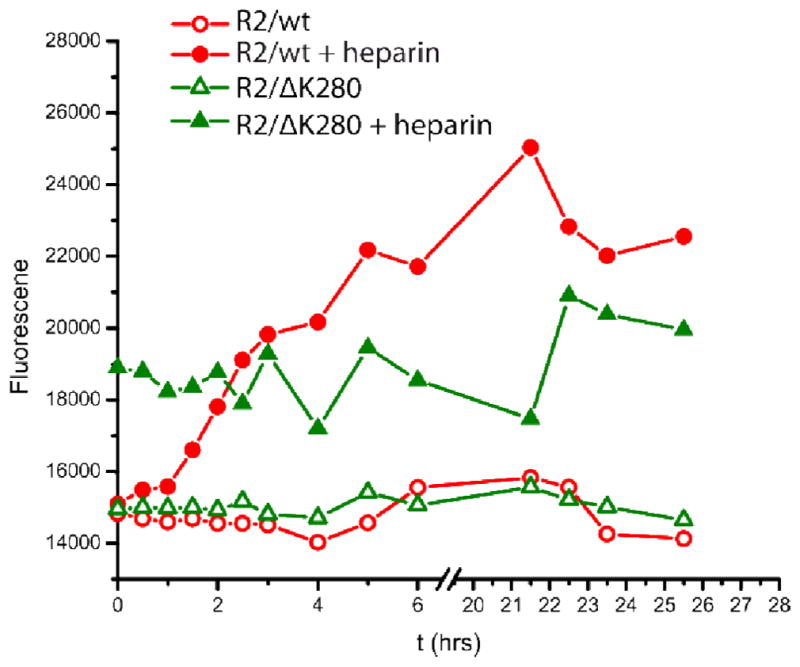
Peptide aggregation monitored by ThT fluorescence. R2/wt and R2/ΔK280 were incubated in 20 mM ammonium acetate buffer with and without heparin, and then added to ThT detection solution.
The TEM studies provide information about large scale oligomers, but cannot resolve the earliest oligomers. IM-MS, on the other hand, is uniquely suited to identify small, transient oligomeric species that initiate the aggregation process.
The mass spectrum of the wild-type protein is shown in Fig. 4(a). Peaks corresponding to z/n = +3/1, +2/1, +3/2, +4/3, and +1/1 are present (where z is the charge and n is the oligomer order). The spectrum was recorded immediately after sample preparation, and indicates that small oligomers (trimers or larger) are immediately formed in solution. ATDs were recorded for the z/n = +2/1 peak, the natural charge of R2/wt in solution (Fig. 5 (a)). The ATD contains three main features, as indicated in the Figure. Measurement of the collision cross sections of each feature allows assignment of the largest time feature as a monomer structure with an average cross section of 310 Å2. Other features at earlier arrival times represent higher-order oligomers.[59]We assign features whose cross sections are 600 Å2 and 575 Å2 to dimeric species (these cross-section values are not consistent with either monomer or trimer dimensions, and, as will be shown in the next section, they are consistent with theoretical cross-section values of dimers obtained from simulation). These dimers are immediately present and grow in intensity over the course of two weeks. In addition, the ATDs at z/n = +3/2 (Fig. S5, along with ATDs for other charge states) reveal the presence of a more compact dimer species (σ = 516, 528 and 545 Å2) and a small amount of tetramer (σ = 964 Å2) The experimental cross sections of the oligomers are tabulated in Table S1 and will be compared to theoretical values obtained from simulations in the next section.
Fig 4.

ESI-q-mass spectra of R2/wt and R2/ ΔK280 in 20 mM ammonium acetate buffer. (a) The mass spectrum of R2/wt. (b) The mass spectrum of R2/ΔK280. (c) and (d) Mass spectra of R2/wt and R2/ΔK280 with heparin, respectively. Peaks corresponding to the z/n = +3/1, +2/1, +3/2, +4/3, and +1/1 are present (where z is the charge and n is the oligomer order), as indicated by the Figure.
Fig 5.

Representative ATDs of z/n = +2/1 of R2/wt (a,b) and z/n = +3/2 of R2/ΔK280 (c,d) before and after the addition of heparin. For the samples containing heparin, the ATDs are collected after 24-hour incubation. Features associated to monomers and dimers are labeled with M and D respectively.
The mass spectrum of R2/ΔK280 shows peaks corresponding to z/n = +2/1, +3/2 +4/3 and +1/1 (the natural charge state) (Fig. 4(b)). Cross sections for each R2/ΔK280 species (monomer, dimer, and trimer) were recorded and are also listed in Table S1. The ATD for several charge states are shown in Fig. S5. In Fig. 5(c), we show the ATD plot corresponding to the +3/2 charge state, which shows a peak at 65 ms. The most reasonable assignment for this feature is a +3 dimer with a cross section of 482 Å2. Overall, IM-MS data suggest only weak aggregation occurred after the samples had been incubated for one week, consistent with the TEM measurements.
Fig. 4(c) and (d) show the mass spectra of a 4:1 R2/wt:heparin and R2/ΔK280:heparin mixtures. In these samples, peaks for z/n = + 4/3, 3/2 and +1/1 are depleted, likely due to the binding of peptide chains to heparin molecules shifting the equilibrium among free oligomeric species. After ~ 20 minutes the baseline at higher m/z increases indicating large unresolved aggregates consistent with the presence of larger aggregates in solution.[60] The ATDs of R2/wt (for z/n=+2/1) and R2/ΔK280 (for z/n=+3/2) are shown in Fig. 5. For the R2/wt, the larger (less compact) dimer conformation (σ = 599 Å2) becomes abundant when heparin is added, as shown by the significant increase in the signal intensity of the ATD feature, while the dimer at 574 Å2 remains essentially unchanged in abundance. This result suggests the ~ 600 Å2 dimer may be the configuration that leads to fibrils as shown in the TEM data from this system. For R2/ΔK280, aggregation occurs even more rapidly than for the WT peptide, with larger oligomers present in the ATD in the initial stages of aggregation (see large peak to the left of the dimer peak). (Fig. 5).
In order to obtain atomistically detailed information about the conformations populated by R2/wt and R2/ΔK280, we turn to simulations. We focus on the two smallest species (monomers and dimers) seen in the IM-MS experiments.
Monomeric structures of R2/wt and R2/ΔK280: The mutant preferentially adopts extended conformations
In order to gain molecular insights into the diversity of structures identified by IM-MS data, we turn to REMD simulations. Structures obtained from simulations are clustered as described in the Methods section. Representative conformations corresponding to the most populated clusters are shown in Fig. S10 (R2/wt) and Fig. S11 (R2/ΔK280 mutant). The clustering reveals a variety of conformations with similar abundance, indicating that the peptides do not fold to a given structure, but rather adopt a number of different conformations, consistent with the intrinsically disordered nature of tau.
To better appreciate the overall distribution of the conformations sampled, we have plotted in Fig. 6 the probability of finding the monomer in a particular conformation, defined by its end-to-end distance (Ree) and its radius of gyration (Rg). Small values of Ree and Rg are associated with compact conformations, whereas larger values correspond to more extended conformations. A comparison between the wild-type R2/wt (Fig. 6 (a)) and the mutant R2/ΔK280 (Fig. 6 (b)) shows that the two peptides are able to sample the same area of the plot, but that the wild-type preferentially adopts compact conformations (roughly the region with Ree < 1.5nm) as can be seen from the higher density of conformation (namely, the darker region in the plot). These results suggest that the removal of one charge (in the form of K deletion) leads the R2/ΔK280 peptide to adopt extended conformations.
Fig 6.

Normalized probability distribution of the conformation for one molecule of R2/wt or R2/ΔK280 in solution. The data pertain to the peptides in their natural charged state, namely z/n=+2/1 for R2/wt and z/n=+1/1 for R2/ΔK280. The distributions represent the probability of finding a conformation with a specific value of the end-to-end distance (Ree) and radius of gyration (Rg). R2/wt(a) shows more compact conformations (roughly the region with Ree < 1.5nm) than its mutant R2/ΔK280(b). On the other hand, when one chain within a dimer is considered for both R2/wt (c) and R2/ΔK280 (d), the distribution is shifted toward more extended conformations. Representative structures have been reported as well. See also figure S1 and S2 for how theoretical CCS have been computed.
A comparison with the experimental cross-section (Table S1 and Fig. S1- Fig. S3) shows a good agreement with the dehydrated solution and gas phase theoretical cross-section. It should be noted that the most extended conformations seen in simulation would likely collapse into gas phase conformations during the experiments. Because the peptides adopt multiple conformations with similar cross-sections, it is not possible to assign a unique conformation to a given experimental cross-sections.
In addition to yielding information about the structures populated by the peptides, the REMD simulations can provide insights into the driving forces for conformational selection. We have noted above that deletion of the charged residue K280 leads to a shift in the monomer population from compact to extended, suggesting that the formation (or lack) of salt bridges plays an important role in the selection of the conformations adopted. In these peptides, ionic bonds can only be formed between the lysines (K274, K280 (only R2/wt) and K281) and the aspartic acid (D283). As can be seen for both peptides from Fig. S6–Fig. S9, in which we plot the probability of salt bridge formation, K274 is the preferred site for salt bridge formation, whereas K281 does not usually participate in salt bridges. In R2/wt, K280 (the site of the mutation), competes with K274 for the formation of salt bridges. On the other hand, the removal of ΔK280 in R2/ΔK280 removes the possibility of forming this salt bridge, but now possibly allows hydrogen bonding between the side chains of N279 and D283. To check if this is indeed thecase, we have plotted the probability of formation of a contact with D283 (K280-D283 salt bridge in the case of R2/wt, Fig. 7(b) and N279-D283 hydrogen bond in the case of R2/ΔK280, Fig. 7(d)), along with the overall number of hydrogen bonds formed by the backbone (for the wild-type in Fig. 7(b) and the mutant in Fig. 7(d)).
Fig 7.

Correlation between number of hydrogen bonds and presence of salt bridges. The higher number of hydrogen bonds formed by the back bone of the R2/wt (a) is associated to the presence of the salt bridge K280-D283 (b). On the other hand, the mutant R2/ΔK280 forms a lower number of hydrogen bonds (c) as a consequence of the lack of a side chain hydrogen bond N279-D283(d). Data have been collected for the peptides in solution with z/n=+2/1 for R2/wt and z/n=+1/1 for R2/ΔK280. See also Figure S1 and S2 for how theoretical CCSs have been computed.
The contrast between the mutant and the wild-type is sharp. The conformations populated by the R2/wt peptide are stabilized both by the K280-D283 salt bridge (as seen from the high density in Fig. 7(b) at a K280-D283 distance below 0.5 nm), as well as by hydrogen bonds formed throughout the peptide (Fig. 7(a)). In the case of the mutant, N279 is unable to form a stable contact with D283 (no high density is seen for distances less than 0.5 nm in Fig. 7(d)), which leads to an extension of the backbone (Ree>1.5nm). Furthermore, as a result of removing the conformational constraint associated with forming a K280-D283 salt bridge, the overall number of backbone hydrogen bonds (Fig. 7(b)) is reduced compared to the wild-type case. Together, the removal of a salt-bridge through the K280 deletion, and the resulting decrease in the number of hydrogen bonds, constitute the driving forces that lead the mutant to adopt more extended conformations than the wild-type. The loss of stabilizing energetic interactions in the mutant is offset by a corresponding increase in the overall conformational entropy of the system.
The latter observation is intriguing because it suggests that there may be multiple pathways to fibril formation. In one extreme (represented by the R2/wt case), aggregation involves changes in the backbone conformation associated with changes in the energetic interactions of the system (mainly breaking and formation of hydrogen bonds and salt bridges). In the other extreme (illustrated by the R2/ΔK280) there is a considerable change in the entropy of the system upon aggregation (reduction of the number of conformations when a free chain enters an aggregate), but a lesser energetic effect than in the R2/wt case. These aspects will be discussed in more detail in the section entitled “Implications for Aggregation”.
Dimeric structures of R2/wt and R2/ΔK280: A greater diversity of β-rich dimers in the case of the mutant
Dimers are the first and smallest oligomers that tau can form. In the context of the full length tau, Patterson et al.[61] identified a prominent dimeric tau species, and implicated this dimer as an intermediate during in vitro tau aggregation. Here, IM-MS experiments show a population of tau dimers in the early stages of aggregation for R2/wt and R2/ΔK280. Using REMD simulations, we characterized the structures of these dimers.
In both cases, a large number of different dimeric conformations were sampled, with no single, predominant dimeric conformation emerging. However, some general trends can be clearly identified, as discussed below.
A first point that needs to be established is whether or not a substantial rearrangement of the backbone is required for the formation of the dimers. To assess this possibility, we compare in Fig. 6 the Ree and Rg of one chain within the dimer with the corresponding values for monomer conformations. Interestingly, the population of extended chains is higher than in the case of an isolated monomer. However, no new conformations emerge. Rather, the average population of the monomers is simply shifted toward more extended conformations. This is an important point with regard to the aggregation of these peptides. Our results show that the monomer already populates fibril-competent extended chain conformations. As aggregation proceeds, these extended conformations become more dominant, with dimers (and probably larger aggregates) favoring the extension of the chains.
Next we turn from the analysis of a single chain within the dimer, to an analysis of the dimers as a whole. As in the case of the monomers, dimers adopt multiple conformations with no clear predominant structure emerging. For this reason we have generalized the analysis performed on the monomers in order to gain insights into the diversity of dimer structures populated, as well as to compare to IM-MS experiments. For dimers, we replace the distance Ree, with the quantity (ReeN being the end-to-end distance of the N-th chain) which is a collective variable that takes into account the extension of both chains within the dimer (Fig. 8(a) and (b)). In this way we are able to distinguish two main populations, that we define as compact (~Rg<0.9–1nm) and extended dimers families of structures that can be readily associated with experimental cross-sections.
Fig 8.
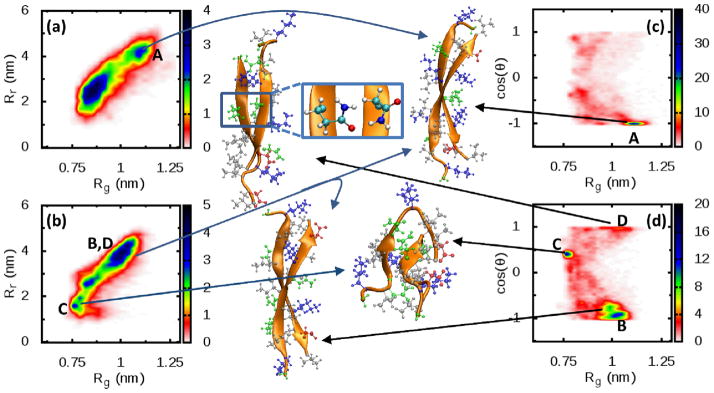
Relevant conformations of the dimer. Both R2/wt (a) and R2/ΔK280 (b) show the presence of extended, amylogenic conformations (regions A, B and D) as well as compact conformations. These extended conformations are mainly antiparallel in the case of R2/wt(c), whereas a small parallel population is present in the mutant as well(d). Notably, the mutant populates also conformations with the backbone perpendicular to each other (region C). The letters A,B,C,D refer to the same population in different plots. Snapshots for each set of structures are shown as well. The inset of structure D shows the contact between Q276 and N279. All the simulations were performed in solution with the peptides in their natural charge state (z/n=+2/1 for R2/wt and z/n=+1/1 for R2/ΔK280). See Figure S3 for how CCS values have been evaluated.
In the following discussion we focus primarily on the extended dimer populations as these may constitute direct pre-cursors to fibrils. Indeed, model fibrils constructed from FTIR and X-ray experiments by von Bergen et al.[22], suggest that fibrils consist of extended β-strands with antiparallel arrangement of the peptide backbones.
In Fig. 8(c) and (d), we report the probability of finding a conformation (of one chain within the dimer) with a particular orientation (parallel or antiparallel) of the chains (see also Fig. S12). The angle θ formed by the PHF6* (275VQIINK280) segment between the two chains is reported along with the radius of gyration Rg. More precisely, the angle θ is defined as the angle between the vectors connecting the alpha-carbons of V275 and K280 (for the R2/wt) or K281 (for the R2/ΔK280). The R2/wt chain adopts predominantly an extended (high value of Rg) conformation with an antiparallel alignment (cos(θ) about –1). The antiparallel arrangement is favored since the charged groups are put on opposite sides of the dimer with the (positive) K280 and K281 residues close to the (negative) D283 residue. This result is congruent with previous studies using longer tau fragments that support an antiparallel arrangement of tau chains within dimers.[61, 62]
In contrast, the R2/ΔK280 populates multiple conformations. An antiparallel extended conformation is still favorable (region B), even though a higher degree of disorder is permitted, as shown by the extension of the antiparallel region. In this configuration, the (positive) K281 residue on one chain is close to the (negative) D283 residue on the other. A second peak is found for cos(θ) around 0.5, which corresponds to a compact conformation with two intersecting loops (region C).
A small population of extended chains with parallel arrangement (cos(θ) about +1) is present in R2/ΔK280 (region D) which is not seen in the case of the wild-type peptide. Fig. 8 shows how the mutant protein is able to stabilize this conformation: The repulsion of charged residues is minimized by intercalating uncharged residues between them (upper part of conformation D), either by arranging their side chains on opposite sides of the dimer or by alternating positive and negative residues (lower part of conformation D). This delicate balance cannot take place in the wild-type case, where the repulsion between K280 and K281, both inter- and intrachain, destabilizes the dimer. An additional stabilizing effect in the mutant is obtained through the formation of hydrogen bonds between the side chains of Q276 and N279 (see inset of the conformation D). We anticipate that this parallel arrangement will lead to a fibril with a different morphology from the one obtained from an anti-parallel arrangement and suggests that the fibrils resulting from R2/ΔK280 may have higher polymorphism than R2/wt fibrils.
Implications for aggregation
Our combined experimental and theoretical study reveals that R2/wt and R2/ΔK280 populate a variety of conformations for both monomer and dimer, without a clearly dominant one. Below, we discuss some general considerations that can be drawn from the analysis performed in the previous sections.
One important aspect of this work is to elucidate the forces that are at play during the early stages of aggregation. REMD simulations show that the R2/wt monomer is stabilized by the presence of a salt bridge between K280 (the location of the mutation) and D283, and to a lesser extent by hydrogen bonding. The removal of this constraint in R2/ΔK280 leads to more extended structures with a low content of hydrogen bonds. This, in turn, leads to an increase in the overall entropy of the system to compensate for the energetic loss associated with bond breaking.
The heterogeneity of conformations found in the monomer persists in the dimeric structures. Interestingly, if one chain within the dimer is singled out and analyzed (Fig. 6), we see that its conformations are the same as in the case of an isolated monomer, with the only difference being that the overall distribution is shifted toward more extended conformations. This suggests that extended conformations of the backbone are associated with aggregation prone structures. This structure is sometimes referred to in the literature as N*.[63–66] Support for the notion that the extended conformation is indeed an amyloid-competent conformation can be found by considering the dimensions of the fibrils (~4 nm in the absence of heparin , and about twice that in the presence of heparin; A fully extended chain is ~4 nm in length). In addition, previous FTIR and X-ray experiments by von Bergen et al.[22] have concluded that an antiparallel alignment of the backbones (an element that already emerges in our dimer simulations) provides the most favorable packing of hydrophobic residues in the context of a fibril.
Our results suggest that increasing the population of the extended conformers (as in the case of the ΔK280 mutant) increases aggregation rates. The population of N* can be more or less accessible depending on the peptide sequence (for instance, the ΔK280 mutant populates more extended N* structures than the wild-type). However, aggregation can still occur even when the extended state is not favored, suggesting that multiple routes for aggregation are possible, including a fast route involving the direct assembly of the N* extended entities and a slower route that involves a structural rearrangement of the more compact conformations. The latter pathway would be dominant for the wild-type peptide. The precise pathway chosen will influence the aggregation kinetics, and even the morphology of the resulting aggregates.[63, 65] Indeed, morphological differences are seen in the fibrils formed for the wild-type and mutant, in the presence and absence of heparin, with the resulting fibrils differing in width, length and twist.
A schematic mechanism is given in Fig. 9(a) for assembly of the neat (heparin-free) R2 peptide. A compact structure is found to be dominant (both experimentally and in computations) for both the R2/wt and the R2/ΔK280 forms of the peptide (Table S1 and Fig. 6). However, simulations show that the more extended family of conformations is more abundant for ΔK280.
Fig 9.
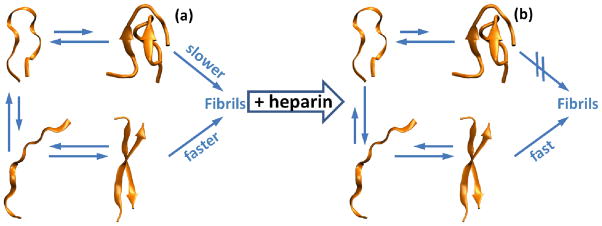
Schematic of aggregation pathway. (a) In the absence of heparin both R2/wt and R2/ΔK280 adopt mainly a compact conformation, which is energetically favorable due to presence of both hydrogen bonds and salt bridges. As a consequence, the aggregation is hampered by the necessity of breaking and reforming hydrogen bonds and salt bridges (slow pathway). Coexisting with this compact population is a small population of already extended chains that can undergo a rapid assembly into fibrillar aggregates (fast pathway). (b) Heparin preferentially binds extended conformations, stabilizing them into nucleation prone conformations. By virtue of Le Chatellier’s principle, the overall equilibrium of the unbound chains is driven toward more extended conformations, with the fast pathway now dominating.
In order for the compact structures to follow the “fast path” to aggregation, they must undergo a structural rearrangement by breaking salt bridges and hydrogen bonds to form extended conformations. This step is mainly dominated by a consistent change in the internal energy of the system. In a subsequent step, these extended conformations assemble to form a dimer. This step is mainly entropic in nature because of the loss of degrees of freedom when a free-chain enters the ordered structure of a growing fibril. In this picture, deletion of K280 reduces the barrier associated with the first step, shifting the equilibrium from compact to extended monomer.
When heparin is added the assembly is dramatically altered. Significant amounts of unresolved oligomers are observed in the mass spectra of both systems (Fig. 4 (c),(d)) and the ATD for the ΔK280 m/z = (+3/2)n in Fig. 5(d). Of particular interest is the dominance of the extended dimer of R2/wt (Fig. 5(b)) near 600 Å2 cross section and the appearance of a significant amount of extended R2/wt monomer (317 Å2 cross section, Fig. 5(b)).
Heparin appears to selectively bind the open form driving the conformation steady state from compact to extended as required by Le Chatellier’s principle. The net result is a rapid increase in dimer formation and subsequent assembly to fibrils (as shown in the TEM data of Fig. 2). In this step energy also dominates as the internal energy increase due to hydrogen bonding/salt bridge formation in the dimer overcomes the entropic advantage of the extended monomer constituents. This energy over entropy situation becomes more favorable as the nascent β-sheet aggregate grows resulting in rapid fibril formation once the process is initiated, as mechanism similar to the previously proposed “conformational selection mechanism”. [67]
These changes are schematically shown in Fig. 9(b). A similar mechanism is also occurring in the ΔK280 mutant, but aggregation occurs even more rapidly because this mutant already has a higher population of extended conformations. This heightened aggregation is reflected in the higher nucleation rates seen in the ThT fluorescence results in Fig. 3 which show an immediate large increase near t=0 for the R2/ΔK280 system while R2/wt only slowly increases, consistent with the IM-MS results mentioned above.
The predominantly antiparallel extended dimer structures found in simulation are consistent with the proposed strand arrangements in the context of the full-fledged fibril, and can rationalize why fibril formation is more favorable in the case of the mutant than the wild type. Indeed, von Bergen et al.[22] used FTIR and X-Ray data to construct an idealized β-sheet composed of extended antiparallel R2/ΔK280 peptides, which places all the charged residues (lysines and aspartic acid) on one face of the β-sheet, with the other face consisting primarily hydrophobic side chains. As a consequence of this segregation, the stacking of the β-sheet and hence fibril growth is highly favorable. Indeed, the R2/ΔK280 sequence has a near perfect hydrophobic (H) polar (P) repeating pattern GPHPH[HP]PHPH, where G is glycine and the segment between square bracket is a slight defect in the pattern, that only has a minor effect on the nature of the surface. This type of HP patterning has been used by Hecht and co-workers to design model aggregating peptide sequences,[68, 69]. In contrast, in the case of R2/wt, the charged and hydrophobic residues are more evenly distributed among the two sides of the β-sheet, making sheet stacking less optimal than in the case of the mutant.
As a final note, it is interesting to point out that the heterogeneity of monomeric structures found in our simulations, and the shift in the ensemble of structures in the presence of external factors (heparin) have also been reported for other natively unfolded proteins. For instance, a structural shift was observed in the case of α-synuclein in the presence of aggregation inducing Cu. [64, 70–73]
Conclusions
The R2/wt peptide is a construct of the full length tau protein that includes the PHF6* region that is known to be critical for aggregation. We have investigated the aggregation of R2/wt and its ΔK280 mutant using a combination of ion-mobility mass spectrometry, TEM and simulation. This combination of approaches enabled us to study the aggregation process on different time and length scales, from the formation of the smallest oligomers, to the formation of full-fledged fibrils. Our results shed new light on how conformational differences that arise in the early stages of aggregation can dictate the kinetics of aggregation and the morphology of the resulting aggregates. We find that both peptides preferentially adopt compact monomer conformations, but simulations indicate a greater predisposition of the mutant to populate extended conformations. The shift in population upon mutation results from the removal of a salt-bridge and a corresponding decrease in hydrogen bonding, and may explain why the mutant aggregates more rapidly than its wild-type counterpart. The addition of heparin is seen to dramatically accelerate fibril formation, particularly in the case of the mutant. Our results are consistent with a mechanism by which heparin binds to extended species in solution and promotes the formation of extended fibril-precursor species. As a final remark, we note that the PHF6* region strongly binds to heparin in full-length tau, eventually driving aggregation.[74] As a consequence, the enhancing effect of heparin on the rates of oligomerization that we observe for R2/ΔK280 may directly translate to full length tau as well.
Supplementary Material
Acknowledgments
Support from the National Science Foundation (MCB-1158577 and CHE-0909743), the National Institutes of Health (NS-35010) and the David and Lucile Packard Foundation are gratefully acknowledged. This work used the Extreme Science and Engineering Discovery Environment (XSEDE), which is supported by National Science Foundation grant number OCI-1053575. The authors acknowledge the Texas Advanced Computing Center (TACC) at The University of Texas at Austin and the National Institute for Computational Sciences at Oak Ridge National Laboratory for providing HPC resources through the XSEDE grant number TG-MCA05S027. This research used ShaRCS, UC Shared Research Computing Services Cluster, which is technically supported by multiple UC IT divisions and managed by the University of California, Office of the President. We acknowledge support from the Center for Scientific Computing at the CNSI and MRL: an NSF MRSEC (DMR-1121053) and NSF CNS-0960316.
Footnotes
Electronic Supplementary Information (ESI) available: Extra figures and details about computations and experiments. See DOI: 10.1039/b000000x/
References
- 1.Hirokawa N, Noda Y, Tanaka Y, Niwa S. Nat Rev Mol Cell Biol. 2009;10:682. doi: 10.1038/nrm2774. [DOI] [PubMed] [Google Scholar]
- 2.Nogales E. Annu Rev Biochem. 2000;69:277. doi: 10.1146/annurev.biochem.69.1.277. [DOI] [PubMed] [Google Scholar]
- 3.Conde C, Cáceres A. Nat Rev Neurosci. 2009;10:319. doi: 10.1038/nrn2631. [DOI] [PubMed] [Google Scholar]
- 4.Desai A, Mitchison TJ. Annu Rev Cell Dev Biol. 1997;13:83. doi: 10.1146/annurev.cellbio.13.1.83. [DOI] [PubMed] [Google Scholar]
- 5.Avila J, Lucas JJ, Pérez M, Hernández F. Physiol Rev. 2004;84:361. doi: 10.1152/physrev.00024.2003. [DOI] [PubMed] [Google Scholar]
- 6.Lee VMY, Goedert M, Trojanowski JQ. Annu Rev Neurosci. 2001;24:1121. doi: 10.1146/annurev.neuro.24.1.1121. [DOI] [PubMed] [Google Scholar]
- 7.Mandelkow EM, Mandelkow E. Trends Biochem Sci. 1993;18:480. doi: 10.1016/0968-0004(93)90011-b. [DOI] [PubMed] [Google Scholar]
- 8.Mandelkow EM, Mandelkow E. Trends Cell Biol. 1998;8:425. doi: 10.1016/s0962-8924(98)01368-3. [DOI] [PubMed] [Google Scholar]
- 9.Friedhoff P, von Bergen M, Mandelkow EM, Mandelkow E. Biochim Biophys Acta - Mol Basis Dis. 2000;1502:122. doi: 10.1016/s0925-4439(00)00038-7. [DOI] [PubMed] [Google Scholar]
- 10.Goedert M. Trends Neurosci. 1993;16:460. doi: 10.1016/0166-2236(93)90078-z. [DOI] [PubMed] [Google Scholar]
- 11.Rankin CA, Gamblin TC. J Alzheimer’s Dis. 2008;14:411. doi: 10.3233/jad-2008-14408. [DOI] [PubMed] [Google Scholar]
- 12.Chiti F, Dobson CM. Annu Rev Biochem. 2006;75:333. doi: 10.1146/annurev.biochem.75.101304.123901. [DOI] [PubMed] [Google Scholar]
- 13.Dobson CM. Trends Biochem Sci. 1999;24:329. doi: 10.1016/s0968-0004(99)01445-0. [DOI] [PubMed] [Google Scholar]
- 14.Fink AL. Folding and Design. 1998;3:R9. doi: 10.1016/S1359-0278(98)00002-9. [DOI] [PubMed] [Google Scholar]
- 15.Bucciantini M, Giannoni E, Chiti F, Baroni F, Formigli L, Zurdo J, Taddei N, Ramponi G, Dobson CM, Stefani M. Nature. 2002;416:507. doi: 10.1038/416507a. [DOI] [PubMed] [Google Scholar]
- 16.Maji SK, Wang L, Greenwald J, Riek R. FEBS lett. 2009;583:2620. doi: 10.1016/j.febslet.2009.07.003. [DOI] [PubMed] [Google Scholar]
- 17.Stefani M. Neuroscientist. 2007;13:519. doi: 10.1177/1073858407303428. [DOI] [PubMed] [Google Scholar]
- 18.Baglioni S, Casamenti F, Bucciantini M, Luheshi LM, Taddei N, Chiti F, Dobson CM, Stefani M. J Neurosci. 2006;26:8160. doi: 10.1523/JNEUROSCI.4809-05.2006. [DOI] [PMC free article] [PubMed] [Google Scholar]
- 19.Sawaya MR, Sambashivan S, Nelson R, Ivanova MI, Sievers SA, Apostol MI, Thompson MJ, Balbirnie M, Wiltzius JJW, McFarlane HT, Madsen AO, Riekel C, Eisenberg D. Nature. 2007;447:453. doi: 10.1038/nature05695. [DOI] [PubMed] [Google Scholar]
- 20.Schweers O, Schonbrunn-Hanebeck E, Marx A, Mandelkow E. J Biol Chem. 1994;269:24290. [PubMed] [Google Scholar]
- 21.Peterson DW, Zhou H, Dahlquist FW, Lew J. Biochemistry. 2008;47:7393. doi: 10.1021/bi702466a. [DOI] [PubMed] [Google Scholar]
- 22.von Bergen M, Barghorn S, Li L, Marx A, Biernat J, Mandelkow EM, Mandelkow E. J Biol Chem. 2001;276:48165. doi: 10.1074/jbc.M105196200. [DOI] [PubMed] [Google Scholar]
- 23.Li W, Lee VMY. Biochemistry. 2006;45:15692. doi: 10.1021/bi061422+. [DOI] [PubMed] [Google Scholar]
- 24.Combs B, Voss K, Gamblin T. Biochemistry. 2011;50:9446. doi: 10.1021/bi2010569. [DOI] [PMC free article] [PubMed] [Google Scholar]
- 25.Zhong Q, Congdon EE, Nagaraja HN, Kuret J. J Biol Chem. 2012;287:20711. doi: 10.1074/jbc.M112.364067. [DOI] [PMC free article] [PubMed] [Google Scholar]
- 26.King ME, Gamblin TC, Kuret J, Binder LI. J Neurochem. 2000;74:1749. doi: 10.1046/j.1471-4159.2000.0741749.x. [DOI] [PubMed] [Google Scholar]
- 27.Goux WJ, Kopplin L, Nguyen AD, Leak K, Rutkofsky M, Shanmuganandam VD, Sharma D, Inouye H, Kirschner DA. J Biol Chem. 2004;279:26868. doi: 10.1074/jbc.M402379200. [DOI] [PubMed] [Google Scholar]
- 28.Berendsen HJC, van der Spoel D, van Drunen R. Comput Phys Commun. 1995;91:43. [Google Scholar]
- 29.Hess B, Kutzner C, van der Spoel D, Lindahl E. J Chem Theory Comput. 2008;4:435. doi: 10.1021/ct700301q. [DOI] [PubMed] [Google Scholar]
- 30.Lindahl E, Hess B, van der Spoel D. J Mol Model. 2001;7:306. [Google Scholar]
- 31.van der Spoel D, Lindahl E, Hess B, Groenhof G, Mark AE, Berendsen HJC. J Comput Chem. 2005;26:1701. doi: 10.1002/jcc.20291. [DOI] [PubMed] [Google Scholar]
- 32.Jorgensen WL, Maxwell DS, Tirado-Rives J. J Am Chem Soc. 1996;118:11225. [Google Scholar]
- 33.Kaminski GA, Friesner R, Tirado-Rives J, Jorgensen W. J Phys Chem B. 2001;105:6474. [Google Scholar]
- 34.Rizzo RC, Jorgensen WL. J Am Chem Soc. 1999;121:4827. [Google Scholar]
- 35.Jorgensen WL, Chandrasekhar J, Madura JD, Impey RW, Klein ML. J Chem Phys. 1983;79:926. [Google Scholar]
- 36.Hess B, Bekker H, Berendsen HJC, Fraaije JGEM. J Comput Chem. 1997;18:1463. [Google Scholar]
- 37.Miyamoto S, Kollman PA. J Comput Chem. 1992;13:952. [Google Scholar]
- 38.Darden T, York D, Pedersen LL. J Chem Phys. 1993;98:10089. [Google Scholar]
- 39.Essman U, Perela L, Berkowitz ML, Darden T, Lee H, Pedersen LG. J Chem Phys. 1995;103:8577. [Google Scholar]
- 40.Hoover WG. Phys Rev A. 1985;31:1695. doi: 10.1103/physreva.31.1695. [DOI] [PubMed] [Google Scholar]
- 41.Nosé S. Mol Phys. 1984;52:255. [Google Scholar]
- 42.Nosé S. J Chem Phys. 1984;81:511. [Google Scholar]
- 43.Verlet L. Phys Rev. 1967;159:98. [Google Scholar]
- 44.Hukushima K, Nemoto K. J Phys Soc Jpn. 1996;65:1604. [Google Scholar]
- 45.Patriksson A, van der Spoel D. Phys Chem Chem Phys. 2008;10:2073. doi: 10.1039/b716554d. [DOI] [PubMed] [Google Scholar]
- 46.Sugita Y, Okamoto Y. Chem Phys Lett. 1999;314:141. [Google Scholar]
- 47.Daura X, Gademann K, Jaun B, Seebach D, van Gunsteren WF, Mark AE. Angew Chem Int. 1999;38:236. [Google Scholar]
- 48.Mesleh MF, Hunter JM, Shvartsburg AA, Schatz GC, Jarrold MF. J Phys Chem. 1996;100:16082. [Google Scholar]
- 49.Mesleh MF, Hunter JM, Shvartsburg AA, Schatz GC, Jarrold MF. J Phys Chem A. 1997;101:968. [Google Scholar]
- 50.Shvartsburg AA, Jarrold MF. Chem Phys Lett. 1996;261:86. [Google Scholar]
- 51.Kemper P, Duipuis N, Bowers MT. Int J Mass Spectrom. 2009;287:46. [Google Scholar]
- 52.Bernstein SL, Dupuis NF, Lazo ND, Wyttenbach T, Condron MM, Bitan G, Teplow DB, Shea JE, Ruotolo BT, Robinson CV, Bowers MT. Nat Chem. 2009;1:326. doi: 10.1038/nchem.247. [DOI] [PMC free article] [PubMed] [Google Scholar]
- 53.Bleiholder C, Dupuis NF, Wyttenbach T, Bowers MT. Nat Chem. 2011;3:172. doi: 10.1038/nchem.945. [DOI] [PMC free article] [PubMed] [Google Scholar]
- 54.Dupuis NF, Wu C, Shea JE, Bowers MT. J Am Chem Soc. 2011;133:7240. doi: 10.1021/ja1081537. [DOI] [PMC free article] [PubMed] [Google Scholar]
- 55.Gidden J, Baker ES, Ferzoco A, Bowers MT. Int J Mass Spectrom. 2005;240:183. [Google Scholar]
- 56.Mason EA, McDaniel EW. Transport Properties of Ions in Gases. Wiley; New York: 1978. [Google Scholar]
- 57.King ME, Ahuja V, Binder LI, Kuret J. Biochemistry. 1999;38:14851. doi: 10.1021/bi9911839. [DOI] [PubMed] [Google Scholar]
- 58.Barghorn S, Zheng-Fischhöfer Q, Ackmann M, Biernat J, von Bergen M, MEM, ME Biochemistry. 2000;39:11714. doi: 10.1021/bi000850r. [DOI] [PubMed] [Google Scholar]
- 59.Bernstein SL, Wyttenbach T, Baumketner A, Shea JE, Bitan G, Teplow DB, Bowers MT. J Am Chem Soc. 2005;127:2075. doi: 10.1021/ja044531p. [DOI] [PubMed] [Google Scholar]
- 60.Barghorn S, Mandelkow E. Biochemistry. 2002;41:14885. doi: 10.1021/bi026469j. [DOI] [PubMed] [Google Scholar]
- 61.Patterson KR, Remmers C, Fu Y, Brooker S, Kanaan NM, Vana L, Ward S, Reyes JF, Philibert K, Glucksman MJ, Binder LI. J Biol Chem. 2011;286:23063. doi: 10.1074/jbc.M111.237974. [DOI] [PMC free article] [PubMed] [Google Scholar]
- 62.Wille H, Drewes G, Biernat J, Mandelkow EM, Mandelkow E. J Cell Biol. 1992;118:573. doi: 10.1083/jcb.118.3.573. [DOI] [PMC free article] [PubMed] [Google Scholar]
- 63.Li MS, Co NT, Reddy G, Hu CK, Straub JE, Thirumalai D. Phys Rev Lett. 2010;105:218101. doi: 10.1103/PhysRevLett.105.218101. [DOI] [PMC free article] [PubMed] [Google Scholar]
- 64.Straub JE, Thirumalai D. Annu Rev Phys Chem. 2011;62:437. doi: 10.1146/annurev-physchem-032210-103526. [DOI] [PMC free article] [PubMed] [Google Scholar]
- 65.Thirumalai D, Reddy G, Straub JE. Acc Chem Res. 2012;45:83. doi: 10.1021/ar2000869. [DOI] [PMC free article] [PubMed] [Google Scholar]
- 66.Nam HB, Kouza M, Zung H, Li MS. J Chem Phys. 2010;132:165104. doi: 10.1063/1.3415372. [DOI] [PubMed] [Google Scholar]
- 67.Wright PE, Dyson JH. Curr Opin Struct Biol. 2009;19:31. doi: 10.1016/j.sbi.2008.12.003. [DOI] [PMC free article] [PubMed] [Google Scholar]
- 68.West MW, Wang W, Patterson J, Mancias JD, Beasley JR, Hecht MH. Proc Natl Acad Sci USA. 1999;96:11211. doi: 10.1073/pnas.96.20.11211. [DOI] [PMC free article] [PubMed] [Google Scholar]
- 69.Xiong H, Buckwalter BL, Shieh HM, Hecht MH. Proc Natl Acad Sci USA. 1995;92:6349. doi: 10.1073/pnas.92.14.6349. [DOI] [PMC free article] [PubMed] [Google Scholar]
- 70.Sandal M, Valle F, Tessari I, Mammi S, Bergantino E, Musiani F, Brucale M, Bubacco L, Samorì B. PLoS Biol. 2008;6:e6. doi: 10.1371/journal.pbio.0060006. [DOI] [PMC free article] [PubMed] [Google Scholar]
- 71.Brucale M, Sandal M, Di Maio S, Rampioni A, Tessari I, Tosatto L, Bisaglia M, Bubacco L, Samorì B. Chembiochem. 2009;10:176. doi: 10.1002/cbic.200800581. [DOI] [PubMed] [Google Scholar]
- 72.Hervás R, Oroz J, Galera-Prat A, Goñi O, Valbuena A, Vera AM, Gómez-Sicilia À, Losada-Urzáiz F, Uversky VN, Menéndez M, Laurents DV, Bruix M, Carrión-Vázquez M. PLoS Biol. 2012;10:e1001335. doi: 10.1371/journal.pbio.1001335. [DOI] [PMC free article] [PubMed] [Google Scholar]
- 73.Klimov DK, Straub JE, Thirumalai D. Proc Natl Acad Sci USA. 2004;101:14760. doi: 10.1073/pnas.0404570101. [DOI] [PMC free article] [PubMed] [Google Scholar]
- 74.Sibille N, Sillen A, Leroy A, Wieruszessi JM, Mulloy B, Landrieu I, Lippens G. Biochemistry. 2006;45:12560. doi: 10.1021/bi060964o. [DOI] [PubMed] [Google Scholar]
Associated Data
This section collects any data citations, data availability statements, or supplementary materials included in this article.