

Abstract
Background
Response to growth hormone (GH) therapy may vary between individual patients. Therefore the use of GH in children should be closely monitored to avoid over, under, or ineffective treatment regimens. The treatment response can be evaluated using growth prediction models. In an effort to improve the accuracy of these prediction models, Ranke et al. (J Clin Endocrinol Metab 95(3):1229–37) proposed a novel ‘data-driven’ approach based on a quantitative analysis of a large cohort of patients from the Pfizer International Growth Database (KIGS) treated with Genotropin (human growth hormone). This model allows physicians to predict and evaluate the level of growth response and responsiveness for their patients so they can adapt treatment accordingly. By comparing the actually observed and the predicted growth response the ability of an individual to respond to GH (responsiveness) can be estimated and further treatment can be adapted accordingly
Objective
To determine the potential population level reduction in the amount of GH used and impact on height outcome of using this data-driven approach to guide treatment decisions, compared to conventional, ‘experience-based’ GH treatment in prepubertal patients with growth hormone deficiency (GHD) or Turner syndrome (TS).
Methods
A model was developed to study the height outcome and the total amount of GH used in the presence or absence of data-driven treatment decisions. The proportion of patients for whom height outcome could be improved or GH use could be reduced (i.e. for low compliance, high or low responder) was estimated using the KIGS cohort. The analysis assumed that this segmentation allows physicians to tailor dosage to the individual patient’s needs or even to discontinue therapy when it is not effective. The analysis used a 4-year time horizon, with Germany as an example country, but results are extendable to other countries. Only the total amount of GH used was included, and effects were defined as the height outcome after 4 years.
Results
The analysis estimated that an evidence-driven approach may reduce the total amount of GH utilized by 7.0 % over 4 years for the treatment of short stature in prepubertal patients with GHD and TS in Germany. Despite the reduction in drug use the average growth outcomes remained unaffected with the new treatment approach. Univariate and probabilistic sensitivity analyses showed that the results are robust.
Conclusions
Our analysis showed that using a data-driven approach to guide treatment decisions for children with GHD or TS is estimated to result in efficiencies in the amount of GH used, without reducing the average growth in the population.
Key Points for Decision Makers
The objective of this research was to quantify the economic value of using a new data-driven treatment approach to optimize growth hormone treatment.
• By leveraging the real-world data from the KIGS registry, clinicians can identify those patients for whom the growth hormone treatment may need to be tailored.
• Budget holders can realize cost efficiencies with the new approach through appropriate management of patients who are (1) less susceptible to treatment or, (2) who have a low compliance to the prescribed regimen or, (3) who are more susceptible to treatment or overtreated.
• This reduction can result in 7 % savings for total growth hormone budget based on a simulation in Germany.
Introduction
Children are the main recipients of growth hormone (GH) for the treatment of short stature in patients who have conditions which include growth hormone deficiency (GHD), Turner syndrome (TS), or short children born small for gestational age (SGA). Current dosing and treatment for GH is determined mainly on the basis of indication, height, and weight of a patient. However, the response to therapy is highly variable between individual patients [1] and therefore the use of GH in children should be closely monitored to avoid over, under, or ineffective treatment regimens. Although there is no harmonized standard for measuring therapeutic response, physicians generally use two methods: (1) response criteria or cut-off values determined by auxology or clinical outcomes [2, 3] or (2) prediction models based on large data sets from patient registries [1, 4]. However, there are limitations with the two methods because (1) response criteria vary between medical communities and (2) the accuracy of prediction equations vary between models [1]. There is currently also no consensus among paediatric endocrinologists on the standard for determining responsiveness and predicting growth [1]. In principle though, both methods can be combined to guide treatment decisions, and they may also be employed to develop a personalized approach to treatment via evidence from data on other patients treated with GH [5].
In an effort to improve upon the accuracy of prediction models to help guide GH treatment, Ranke et al. [4] proposed a novel ‘data-driven’ approach based on quantitative analysis of a large cohort of patients in the KIGS database (Pfizer International Growth Database, Pfizer Health AB, Strangnas, Sweden). KIGS is a worldwide pharmaco-epidemiologic registry established in 1987 to monitor outcomes and safety of Genotropin® (somatropin, Pfizer Inc, New York, NY, USA) treatment in children with short stature. The KIGS database contains data on about 83,000 patients collected over the last 25 years in more than 50 countries. Ranke’s [4] approach is based on algorithms that take into account both the actual (response) and predicted (responsiveness) growth of an individual patient to determine how treatment can be optimized by the physician. More specifically, these algorithms allow one to identify patients who are
Less susceptible to treatment or
Who have a low compliance to the prescribed regimen or
Who are more susceptible to treatment or overtreated
Adapting treatment regimes in these patients could potentially lead to improved height outcome (by increasing compliance) and a reduction in the overall amount of GH used (by altering GH dosage in patients with a high or a low response).
The objective of this study was to determine the potential population level reduction in GH use and impact on height outcome of using a data-driven approach to guide treatment decisions, compared to conventional, ‘experience based’ GH treatment in prepubertal patients with GHD or TS.
Methods
A model was developed to study the height outcome and GH use in the presence or absence of data-driven treatment decisions. The proportion of patients for whom height outcome could be improved or GH use could be reduced or discontinued (i.e. in the cases of low compliance, high or low responder) was estimated using the KIGS cohort. Using information from this cohort analysis, the model estimated the impact of data-driven treatment decisions on the amount of GH used and growth over a 4-year time horizon. Germany was used as an example country as it represents the largest European KIGS population (about 20 % of the European data in KIGS are from German sites), and outcomes were presented as the number of milligrams of GH used, to maintain transferability to other countries. The analysis was limited to GHD and TS because only for these indications were 4-year prediction models for height and weight available and validated at the time of the analysis [6].
Response and Responsiveness
The concept published by Ranke et al. [4] uses response and responsiveness to GH treatment to identify patient segments based on their treatment outcomes at 12 months.
Conventionally, measures of a patient’s response compared to that of a reference population have been used to guide treatment decisions. In our study, response was defined as the height velocity standard deviation score (SDS): the individual’s height velocity (HV, growth in centimetres per year) in the first year compared to that of the reference population (age and diagnosis matched), divided by the SD of the HV in the reference population.
 |
In line with published literature, a response lower than −1 was considered an inadequate response [4, 7]. A response larger than +1, on the other hand, was considered “high”.
Although response identifies whether a patient’s HV is below or above the average, it does not take into account the individual characteristics of a patient nor does it explain why the response deviates. The index of responsiveness (IoR), however, compares the patients’ HV with the individually predicted HV using published growth prediction algorithms [8, 9]. These prediction algorithms include many important baseline parameters such as indication, age, weight, and GH dose (Appendix 1). The IoR is defined as
 |
An IoR lower than −1.28 or higher than +1.28 (corresponding to the 10th and 90th centile) was considered outside the normal range [4]. In patients with a low IoR there should be suspicion of non-compliance or of the effect of an unknown variable that is absent from the prediction algorithms [4]. If, on the other hand, both the response and IoR are high, this is most likely due to patients being genetically more responsive to GH (i.e. patients are high responders). However, the possibility of patients taking a dose of GH higher than the prescribed dose should also be considered.
By combining the response and the responsiveness, four patient segments were defined (Fig. 1). Patients with a response lower than the reference population were stratified according to their IoR into suspected non-compliant patients (response less than 1, responsiveness less than −1.28) and low responders (response less than 1, responsiveness from −1.28 to +1.28). It should be noted that there may be some overlap between the suspected non-compliance and low response groups defined here. Average responders were those with a similar response to the reference population (response from −1 to +1) and high responders are those with a response higher than the reference population, and a responsiveness that is similar to or higher than predicted (response greater than 1, responsiveness greater than −1.28). Inconsistent response groups (i.e. response greater than 1 and responsiveness less than −1.28, or response less than −1 and responsiveness greater than 1.28) were not considered, as they are unrealistic because of the high degree of correlation between response and responsiveness.
Fig. 1.
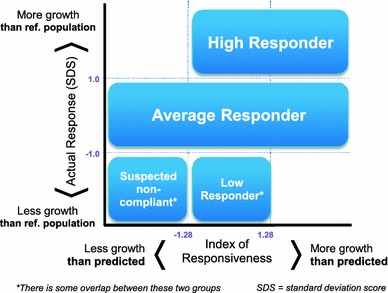
Patient segmentation based on response and index of responsiveness
To provide truly accurate growth projections, a prediction system must take all possible sources of variation into account. As the prediction algorithms explain between 29 and 70 % of the growth response during GH therapy (30–70 % for GHD, 29–46 % for TS) [8, 9], they should be used in conjunction with the physician’s clinical knowledge and judgement.
Patient Population and Segmentation
In the base case analysis all prepubertal patients with GHD or TS with sufficient data to assess their actual and predicted first-year response to GH treatment from the KIGS database were included in the patient segmentation. This includes 3,276 GHD and 2,535 TS patients from 30 European countries. For a sensitivity analysis only data from patients in Germany was included (GHD, n = 989; TS, n = 696). The response and responsiveness criteria were applied to each patient, and for each segment the mean dose, and observed and predicted HV was calculated.
Figure 2 shows that the relative size of the patient segments in the German cohort was comparable to that in the whole European cohort for the two indications. For GHD patients, the average GH dose was similar in each response group. For TS patients the average dose was lower in the non-responder group, and similar in the other segments. All observed average doses were within the maximum dosing ranges stated in the Summary of Product Characteristics (SPC) [10]. The dosing ranges for GHD are 0.025–0.035 mg/kg body weight/day, and for TS the dosing ranges are 0.045–0.050 mg/kg body weight/day.
Fig. 2.
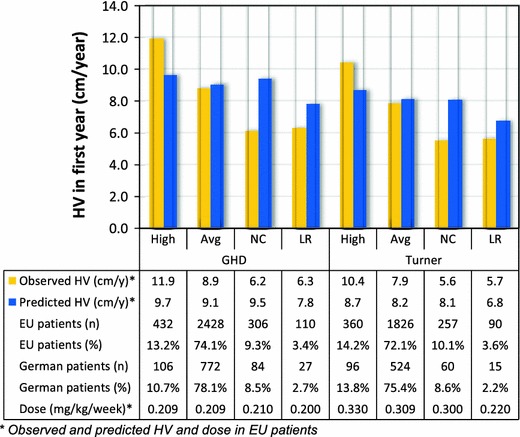
First-year outcomes for each patient segment in the KIGS database. High high response, Avg average response, NC suspected non-compliance, LR low response, HV height velocity in the first year of treatment
Health Resource Implication Model
A health resource implication model was developed to predict the growth outcome and GH use for a cohort of GHD and TS patients. The cohort size is based on all active German patients currently in the KIGS database: 1,934 GHD patients and 326 TS patients, including those without sufficient data for segmentation (this compares to the initial German population used for segmentation described in Sect. 2.2 which included both active and inactive patients with sufficient data to assess their actual and predicted first-year response to GH treatment from the KIGS database).
The baseline characteristics and average GH dose are also based on the German KIGS population (Table 1). As this model is only based on patients registered in the KIGS database, all patients are considered to be treated on Genotropin.
Table 1.
Input values used for the model which apply to the German situation
| Input | ||
|---|---|---|
| Patients in KIGS database | ||
| Paediatric GH deficiency | 1,934 KIGS patients | |
| Turner syndrome | 326 KIGS patients | |
| Patient characteristics at start of treatment | ||
| Mean age | 7.99 years | |
| Mean height | 109 cm | −2.91 SDS |
| Mean body mass index | 14.8 kg/m2 | −0.50 SDS |
| Mean parental height | 166 cm | −0.46 SDS |
KIGS Pfizer International Growth Database, SDS standard deviation score
Using a decision tree structure, we divided the cohort into response segments as specified above. The growth and dose for average responders were estimated using published growth and weight prediction algorithms in GHD and TS [6, 8, 9]. The growth and dose for high responders, non-responders and non-compliant patients were estimated using the predicted outcomes for average responders and the HV and dose in the patient segments (Fig. 2), and are further described in "Appendix 2". To calculate the total amount of GH we assumed that the dose is only increased once per year on the basis of a patient’s gain in weight, as is common practice.
The time horizon of the model is limited to 4 years because the prediction equations for height and weight have only been validated over that time period [6, 11]. Response to GH is strongest in the first years after treatment initiation, and these 4 years therefore represent the most effective period of GH therapy [8, 12].
Impact of Data-Driven Treatment Decisions in the Model
In a data-driven approach, we assumed that in high responders the GH dose may be reduced, while still maintaining their growth target [4]. The average HV (annual growth) in high responders is 3 (GHD) and 2.5 (TS) cm/year above that in average responders (Fig. 2, column 1 and 5). Both groups were treated on a similar dose and have a similar predicted HV which suggests that high responders are more sensitive to GH therapy. A possible mechanism for dose reduction is to maintain the absolute dose (milligrams) in the second year of treatment, thereby lowering the relative dose (milligrams per kilogram) because patients will have gained weight during their first year of treatment. In this scenario, we assumed that high responders still achieve their predicted height while reducing GH use.
For patients that are suspected to be non-compliant with their prescribed GH regimen this analysis demonstrated that their actual growth is 3.3 cm/year (in GHD) and 2.5 cm/year (in TS) less than predicted (Fig. 2, column 3 and 7). By identifying these low compliant cases, treating physicians can try to find the cause of low compliance and subsequently act on these findings at their own discretion with the goal of improving HV for these patients. For the analysis presented here, the model assumes, on the basis of recommendation from experienced endocrinologists, that compliance can be improved in around 75 % of these patients, and that long-term non-compliant patients may need to discontinue therapy [13, 14]. In the model, patients with improved compliance are assumed to reach the same height as average responders (Table 2).
Table 2.
Interventions by patient segment and their impact on GH use and height outcomes
| Subgroup | Intervention | Impact on GH use | Impact on height |
|---|---|---|---|
| High response | Not increasing absolute dose after first year, thereby lowering relative dose due to an increase in patient’s weight | Relative dose is decreased | Reduced: patients only reach their predicted height, which is close to the height of average responders |
| Average response | Continue with conventional treatment | Maintain relative dose (mg/kg) | Maintain average height outcome |
| Low response | Discontinue therapy after the first year for 80 % of the patients who are not responding to therapy | 100 % of GH use is saved for years 2–4 for 80 % of the patients | No impact assumed |
| Suspected low compliance | Improve compliance for ~75 % of patients, and discontinuing therapy for the remainder of patients who cannot comply | No GH use for the ~25 % who discontinue after the first year. Patients with improved compliance have the same GH use as average responders | Improved for ~75 %. Patients with improved compliance are assumed to reach average height outcome |
For low response patients with GHD, the average HV (growth) is 2.5 cm/year less than that of average response patients, although both patient segments are treated on a similar dose. This suggests that low response patients may be less sensitive to GH therapy (Fig. 2, column 4). Among these patients, a large proportion will never benefit from treatment.
The situation is slightly different in the case of TS: the low response group had an average HV (growth) of 2.2 cm/year less than that of average response patients. However the average dose in the low response groups was also considerably less than the dose used to treat the patients with an average response (0.220 vs 0.330 mg/kg/week or 0.031 vs. 0.047 mg/kg/day, Fig. 2, column 6 and 8). It is therefore possible that the HV could be improved in a number of these low response patients if they were to be treated on a higher, but still appropriate, dose.
In the case of GHD low response patients and in a fraction of TS low response patients, cessation of therapy should be considered when all other inhibiting factors are ruled out. This is in line with international guidelines [2, 15, 16]. Through identification of these cases after the first year of treatment, 100 % of the GH use in these patients may be saved in subsequent years. On the basis of recommendation from endocrinologists, the model assumes that 80 % of low response patients would stop therapy after the first year of treatment (Table 2). As these patients did not show a response to GH in the first year, it is assumed that discontinuation will not affect their growth [17].
Sensitivity Analysis
A probabilistic sensitivity analysis (PSA) was performed on the European patient segmentation using 1,000 Monte Carlo simulations to incorporate uncertainty in the individual model parameters. A univariate sensitivity analysis was performed by varying each parameter over its lower and upper 95 % confidence interval (CI). For expert inputs, a standard deviation of 20 % of the mean was assumed.
Results
Amount of GH Therapy Used and Height Gained
The predicted total amount of GH used over a 4-year time period for all diagnosed prepubertal paediatric GHD patients (n = 1,934) and TS patients (n = 326) in Germany is 2.229 million mg without data-driven treatment decisions and 2.072 million mg with data-driven decisions (Table 3). The estimated reduction is thus 7.0 % of the total amount of GH used (157,006 mg). Assuming a vial size of 12 mg, this would correspond to an estimated reduction of 13,084 vials of GH (an average of 5.8 vials per patient). Table 3 shows that the estimated reduction in GH use for GHD patients is 7.1 % (129,795 mg) and for TS patients 6.8 % (27,210 mg). In addition, this table shows that results were equivalent whether the EU or German patient segments were used.
Table 3.
GH use and height achieved for patients with growth hormone deficiency (GHD, n = 1,934) and Turner syndrome (TS, n = 326) using the European or German patient segmentation
| Indication | Conventional treatment | Data-driven treatment approach | Efficiencies gained | |||
|---|---|---|---|---|---|---|
| GH use (million mg) | Height (cm) | GH use (million mg) | Height (cm) | Total (million mg) | Per patient (mg) | |
| European patient segmentationa | ||||||
| GH deficiency | 1.827 | 137.2 | 1.698 | 137.1 | 0.130 | 67 |
| Turner syndrome | 0.402 | 132.1 | 0.375 | 132.2 | 0.027 | 83 |
| Total | 2.229 | 136.5 | 2.072 | 136.4 | 0.157 | 69 |
| German patient segmentationb | ||||||
| GH deficiency | 1.828 | 136.9 | 1.715 | 136.9 | 0.113 | 58 |
| Turner syndrome | 0.400 | 132.2 | 0.378 | 132.2 | 0.021 | 65 |
| Total | 2.228 | 136.2 | 2.093 | 136.2 | 0.135 | 59 |
aSegmentation based on EU KIGS population (3,276 GHD + 2,535 TS)
bSegmentation based on German KIGS population (989 GHD + 696 TS); see text for details
The predicted average height outcome in the total population without and with data-driven decisions was similar: 136.5 and 136.4 cm (difference of 0.05 cm, Table 3). Although the height outcome for high responders was slightly reduced because of the decreased dose, this is compensated by the improved height outcome for low compliant patients.
Sensitivity Analysis
The PSA scatterplot in Fig. 3 shows that the predicted effects on height outcome range from 0.6 cm reduction to 0.3 cm additional growth (95 % CI −0.32; 0.17 cm). The predicted reduction in GH use range between 70,000 and 250,000 mg (95 % CI 106,481; 210,591 mg). All replications showed a reduction in the amount of GH used for using data-driven treatment decisions, while maintaining similar average height outcomes.
Fig. 3.
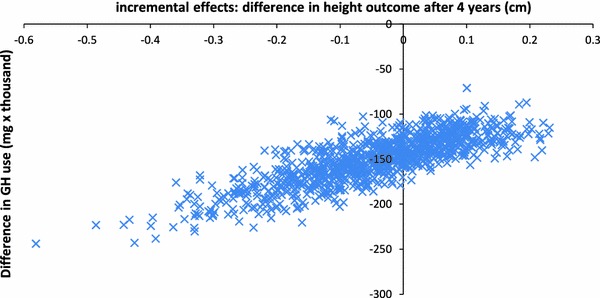
Probabilistic sensitivity analysis: scatterplot of difference in GH use and height outcome after 4 years of treatment with a data-driven approach
The univariate analysis presented in Fig. 4 shows that the future compliance (with data-driven treatment decisions) is the most influential parameter on both GH use and effects. Higher compliance would result in more growth, but also increases the amount of drug used, as more patients continue treatment. To further explore the impact of this parameter, an analysis was run in which compliance is improved in 0 or 100 % of non-compliant patients. When compliance cannot be improved in any of the non-compliant patients, the predicted reduction in GH use according to a data-driven approach would be 282,474 mg (as compared to 157,006 mg in the base case), and the average height outcome would decrease by 0.6 cm. When compliance could be improved in all non-compliant patients, the predicted reduction in GH use would be 111,908 mg with an increased average height outcome of 0.2 cm.
Fig. 4.
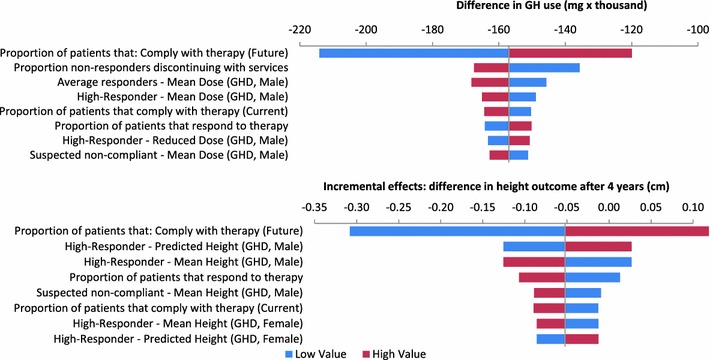
Tornado diagram of eight most influential parameters on incremental GH use and effects
Discussion
In this paper we demonstrated the potential population level reduction in the total amount of GH used and impact on growth when data sets like KIGS are used to help determine whether patients are responding properly to GH therapy. This model is unique compared to previous models as it is possible to estimate the benefits of tailoring GH therapy to the treatment response in individual patients, rather than comparing standard GH regimens.
The model presented here estimates that when a data-driven treatment approach is used in German patients treated with Genotropin, the GH use can potentially be reduced by 7.0 % (157,006 mg) over a 4-year period. Through probabilistic and univariate sensitivity analyses we were able to show that these results are robust. Moreover we showed that the relative reduction is equivalent for German or European patient segments. The proportional amount of saving presented here for Germany is therefore likely to be achievable in other European countries.
Compared to other studies on cost-effectiveness of GH treatment in children [18, 19], the mean age at the start of treatment is slightly lower in our model, because a minimal treatment period of 4 years was a prerequisite. However, current recommendations suggest that treatment should begin before 8 years of age (which is more in alignment with our model), in order to achieve greater height gain [18]. Mean height SDS at the start of therapy varies by indication and in our model was −2.91, which is within the range that is observed by other authors [18, 19].
It is important to consider that, although the model seeks to differentiate between suspected non-compliant and low-responding patients, there may be an overlap between both groups, because they often cannot be distinguished on the basis of auxological response criteria alone. From a clinical perspective more information in addition to the KIGS data must be considered before making decisions on individual treatment regimes. However, the KIGS data can help identify patients that potentially have a low compliance. In the analysis presented here we have accounted for this uncertainty in the sensitivity analysis.
The low-response rate in our model is lower than that reported by others [20]. This may be due to selection bias by including only patients with complete follow-up over 4 years, and may also be due to the definition of low response, which was based on 80 % confidence limits. Also, the rate of non-compliance of 8.5–10 % in our model is more conservative than the rates of more than 30 % found in two other studies [21, 22].
A modelling study such as this is limited by the quality of the data and the inputs that were selected. For the GH use and height outcome associated with each subgroup in our study, we took population averages to calculate overall outcomes, rather than predicting outcomes for individual patients using discrete event simulations. Therefore, the average cohort outcomes may not represent those of the individual patients. In addition, the resource use only includes the amount of drug used, and does not include other resources such as doctor visits, devices, etc. This indicates that the variability in resource use between patients may be underestimated, and that the estimated efficiencies are probably conservative.
Our analysis compared conventional, ‘experience-based’ GH treatment with data-driven treatment decisions. Although this could be considered overoptimistic, as physicians could also individualise treatment without data, no studies could be identified that describe in what proportion of patients the treatment would be adjusted. However, the sensitivity analyses show that data-driven treatment decisions are likely to result in a reduction in the amount of GH used.
To ensure the quality of the data, only the population in the KIGS database that had sufficient data were analysed. This may have introduced a bias towards patients that were monitored more closely and may be performing better than the average population (e.g. less low-responders and non-compliant patients). However, this would indicate that more efficiencies can be gained in real-world practice.
Conclusion
If prediction algorithms are used in combination with a data-driven approach in children receiving GH treatment, usage of GH can be more efficient by lowering the total dose of GH in some patients and by improving growth outcomes in others. In conclusion, our analysis showed that using a data-driven approach to guide treatment decisions for children with GHD or TS is estimated to result in substantial efficiencies in the amount of GH used while the average growth in the population remains unaffected.
Acknowledgments
This paper was supported by Pfizer. Stefan Kaspers is a past employee of Pfizer. Donald Han, Jane Loftus, Hartmut Wollmann, and Anders Lindberg are currently employed by Pfizer. Michael B. Ranke is a member of the International KIGS Board and receives lecture fees from Pfizer, Eli Lilly, Novo Nordisk, and Ipsen and was a paid consultant in the development of this manuscript. Mathieu Roelants and Joris Kleintjens have received consultancy fees from Pfizer. Stefan Kaspers, Michael Ranke, and Hartmut Wollmann designed the study and assisted with the analyses. Joris Kleintjens and Anders Lindberg performed the analyses. Matthieu Roelants supported the analyses. Joris Kleintjens, Jane Loftus, and Donald Han helped design the study and write the manuscript. All authors revised, read, and approved the final manuscript.
The guarantor for the overall content is Hartmut Wollmann.
Statistical analyses were performed by Pfizer Health AB, Sweden and Quintiles Consulting, USA and The Netherlands.
The authors would like to thank Rickard Sandin and Sixten Borg, who contributed to the design and development of the model. The authors would also like to thank Quintiles Consulting in the Netherlands for their support on the sensitivity analysis and contribution to the final paper.
Appendix 1
See Table 4.
Table 4.
Components of the KIGS algorithms for predicting height velocity in prepubertal children treated with GH
| Population/prepubertal year of therapy (N) | Intercept | Model parameters | Statistics | |||||||||||||
|---|---|---|---|---|---|---|---|---|---|---|---|---|---|---|---|---|
| Age at onset (years) | Age at puberty (years) | Birth wt (SDS) | GH dosea | Number of GH injections per week | Maximum GH level (Ig/L) | Ht–MPH (SDS) | MPH (SDS) | Wt (SDS) | Previous year’s HV (cm/year) | Sex (boy = 1) | Ox (yes = 1) | R 2 | Error SD (cm) | References | ||
| IGHD | ||||||||||||||||
| 1 (593) | 14.55 | −0.32 | 0.32 | 1.62 | −1.37 | −0.40 | 0.29 | 0.61 | 1.46 | [8] | ||||||
| 1 (593) | 12.41 | −0.36 | 0.47 | 1.54 | −0.60 | 0.28 | 0.45 | 1.72 | [8] | |||||||
| 2 (573) | 5.69 | −0.09 | 0.63 | 0.24 | 0.31 | 0.40 | 1.19 | |||||||||
| 3 (335) | 5.61 | −0.10 | 0.66 | 0.30 | 0.32 | 0.37 | 1.05 | |||||||||
| 4–8 (180) | 6.03 | −0.05 | 0.87 | 0.40 | 0.21 | 0.30 | 0.95 | |||||||||
| Total pubertal growth (303) | 48.31 | −3.02 | 6.46b | −1.32 | 11.34 | 0.70 | 4.19 | [23] | ||||||||
| Early IGHD | ||||||||||||||||
| 1 (265) | 19.32 | −2.27 | 0.12 | 2.30 | −0.96 | −0.26 | 0.22 | 0.54 | 2.12 | [24] | ||||||
| 1 (261) | 17.78 | −2.34 | 0.37 | 2.08 | −0.43 | 0.15 | 0.45 | 2.30 | [24] | |||||||
| Turner syndrome | ||||||||||||||||
| 1 (686) | 8.09 | −0.28 | 2.19 | 0.38 | −0.24 | 0.43 | 1.60 | 0.46 | 1.26 | [9] | ||||||
| 2 (681) | 6.02 | −0.11 | 1.07 | 0.13 | 0.21 | 1.00 | 0.32 | 1.09 | ||||||||
| 3 (293) | 5.64 | −0.10 | 0.88 | 0.21 | 0.23 | 0.69 | 0.29 | 0.99 | ||||||||
| 4–8 (291) | 4.8 | −0.13 | 0.58 | 0.15 | 0.33 | 0.61 | 0.30 | 1.01 | ||||||||
| SGA | ||||||||||||||||
| 1 (613) | 9.39 | −0.31 | 56.51c | 0.11 | 0.30 | 0.52 | 1.35 | [25] | ||||||||
| 2 (385) | 4.67 | −0.11 | 13.46c | 0.30 | 0.34 | 1.10 | ||||||||||
| 2 (379) | 8.01 | −0.20 | 27.48c | 0.16 | 0.19 | 0.30 | 1.14 | [25] | ||||||||
| ISS | ||||||||||||||||
| 1 (657) | 9.11 | −0.29 | 7.28d | −0.33 | 0.31 | 0.39 | 1.18 | [26] | ||||||||
The components listed can be used to predict the HV for a particular patient at a given point during GH treatment. For example, the equation for HV for a patient with IGHD in the third prepubertal year of therapy (table row 4) is HV (cm/year) = 5.61 + [age at onset (years) × −0.10] + [GH dose (ln IU/kg/week) × 0.66] + [weight (SDS) × 0.30] + [previous year’s height velocity (cm/year) × 0.32]
Reprinted from [11] with permission from Elsevier. Only the KIGS algorithms for IGHD and Turner syndrome were used in the analysis
ln natural logarithm, Ht height, HV height velocity, IGHD idiopathic growth hormone deficiency, ISS idiopathic short stature, KIGS Pharmacia International Growth Database, MPH mid-parental height, ox oxandrolone, SDS standard deviation score, SGA small for gestational age, wt weight
aGH dose = ln IU/kg/week except
bIU/kg/week
cmg/kg/day
dmg/kg/week
Appendix 2
Table 5.
Input parameters
| Input parameter | Value | Source | PSA value | Univariate value |
|---|---|---|---|---|
| GHD—mean Genotropin dose | 29.1 µg/kg body weight/day | KIGS | Varied over a normal distribution | 95 % CI low and high |
| TS—mean Genotropin dose | 38.4 µg/kg body weight/day | KIGS | Varied over a normal distribution | 95 % CI low and high |
| Patient characteristics | ||||
| Mean age | 7.99 | KIGS | Varied over a normal distribution | 95 % CI low and high |
| Mean height | −2.91 SDS | KIGS | Varied over a normal distribution | 95 % CI low and high |
| Mean body mass index | −0.5 SDS | KIGS | Varied over a normal distribution | 95 % CI low and high |
| Mean parental height | −0.46 SDS | KIGS | Varied over a normal distribution | 95 % CI low and high |
| Proportion of GHD patients male | 68 % | KIGS | Beta distribution | 95 % CI low and high |
| Proportion non-responders discontinuing with services | 80 % | Assumption | Beta distribution: mean, 80 %; SD, 16 % | 95 % CI low and high |
| Proportion of non-compliant patients in which compliance can be improved | 74 % | Assumption | Beta distribution: mean, 74 %; SD, 15 % | 95 % CI low and high |
| Input parameter | GHD | TS | Source | PSA value | Univariate value |
|---|---|---|---|---|---|
| Proportions in each patient segment | |||||
| High responders | 0.132 | 0.142 | KIGS | Sampled using a Dirichlet distribution | The proportion with a (high or normal) response was varied to its 95 % CI, and the proportion compliant (i.e. not non-compliant) was varied to its 95 % CI. Other segments were re-distributed proportionally |
| Average responders | 0.741 | 0.721 | KIGS | ||
| Suspected non-compliant | 0.093 | 0.101 | KIGS | ||
| Low responder | 0.034 | 0.036 | KIGS | ||
CI confidence interval
Table 6.
Height calculation (calculated using EU patient segmentation)
| Patient segment | Male (cm) | Female (cm) | Calculation | PSA value | Univariate value (cm) |
|---|---|---|---|---|---|
| GHD | |||||
| Average responder—mean height | 137.2 | 136.4 | Calculated height over 4 years using the growth and weight gain prediction algorithms [6, 8] | Individual model parameters were varied over their distributions using the covariance matrix of the regression model | ±1 |
| High responder—mean height | 147.1 | 145.9 | Baseline height plus standard growth (over 4 years) multiplied by the ratio of high and standard responders HV | The observed/predicted HV was varied over a normal distribution | ±1 |
| High responder—predicted height (after dose reduction) | 142.2 | 141.2 | Baseline height plus observed first-year high responder growth plus the predicted growth for standard responders in year 2–4 multiplied by the ratio of predicted high responder and observed standard responders HV | ±1 | |
| Suspected non-compliant—mean height | 128.7 | 128.1 | Baseline height plus standard growth (over 4 years) multiplied by the ratio of non-compliant and standard responders HV | ±1 | |
| Low responder—mean height | 129.2 | 128.5 | Baseline height plus standard growth (over 4 years) multiplied by the ratio of non-sensitive and low responders HV | ±1 | |
| TS | |||||
| Average responder—mean height | – | 132.0 | Calculated height over 4 years using the growth and weight gain prediction algorithms [6, 9] | Individual model parameters were varied over their distributions using the covariance matrix of the regression model | ±1 |
| High responder—mean height | – | 139.4 | Baseline height plus standard growth (over 4 years) multiplied by the ratio of high and standard responders HV | The observed/predicted HV was varied over a normal distribution | ±1 |
| High responder—predicted height (after dose reduction) | – | 136.1 | Baseline height plus observed first year high responder growth plus the predicted growth for standard responders in year 2–4 multiplied by the ratio of predicted high responder and observed standard responders HV | ±1 | |
| Suspected non-compliant—mean height | – | 125.2 | Baseline height plus standard growth (over 4 years) multiplied by the ratio of non-compliant and standard responders HV | ±1 | |
| Low responder—mean height | – | 125.5 | Baseline height plus standard growth (over 4 years) multiplied by the ratio of non-sensitive and low responders HV | ±1 | |
Baseline height height at the start of the treatment period, standard growth growth for standard responders over 4 years, as calculated using the Ranke prediction algorithms, HV height velocity after the first year of GH therapy in cm, as observed in the KIGS patient segmentation, predicted high responder height velocity height velocity for high responders calculated after 1 year using the growth prediction algorithms
Table 7.
Dose
| Patient segment | Total dose over 4 years (mg) | Calculation | PSA value | Univariate value (%) | |
|---|---|---|---|---|---|
| Male | Female | ||||
| GHD | |||||
| Average responder—mean dose | 901 | 901 | Calculated using the growth and weight gain prediction algorithms [6, 8] and the average dose for German GHD patients in KIGS (29.1 µg/kg body weight/day) | Individual model parameters were varied over their distributions using the covariance matrix of the regression model | ±5 |
| High responder—mean dose | 899 | 899 | Standard dose (in mg/4 years) multiplied by the ratio of high responder and normal responder dose in KIGS | The observed doses from KIGS were varied over normal distributions | ±5 |
| High responder—reduced dose | 697 | 697 | Calculated: assumed intervention: no dose increase after year 1. Absolute dose remains equal in years 2–4 | Individual model parameters were varied over their distributions using the covariance matrix of the regression model | ±5 |
| Suspected non-compliant—mean dose | 903 | 903 | Standard dose (in mg/4 years) multiplied by the ratio of non-compliant and normal responder dose in KIGS | The observed doses from KIGS were varied over normal distributions | ±5 |
| Suspected non-compliant or low responder patients—dose over 1st year | 182 | 182 | Calculated dose in first year | Individual model parameters were varied over their distributions using the covariance matrix of the regression model | ±5 |
| Low responder—mean dose | 860 | 860 | Standard dose (in mg/4 years) multiplied by the ratio of non-sensitive and normal responder dose in KIGS | The observed doses from KIGS were varied over normal distributions | ±5 |
| TS | |||||
| Average responder—mean dose | – | 1,179 | Calculated using the growth and weight gain prediction algorithms [6, 9] and the average dose for German TS patients in KIGS (38.4 µg/kg body weight/day) | Individual model parameters were varied over their distributions using the covariance matrix of the regression model | ±5 |
| High responder—mean dose | – | 1,258 | Standard dose (in mg/4 years) multiplied by the ratio of high responder and normal responder dose in KIGS | The observed doses from KIGS were varied over normal distributions | ±5 |
| High responder—reduced dose | – | 976 | Calculated: assumed intervention: no dose increase after year 1. Absolute dose remains equal in years 2–4 | Individual model parameters were varied over their distributions using the covariance matrix of the regression model | ±5 |
| Suspected non-compliant—mean dose | – | 1,144 | Standard dose (in mg/4 years) multiplied by the ratio of non-compliant and normal responder dose in KIGS | The observed doses from KIGS were varied over normal distributions | ±5 |
| Suspected non-compliant or low responder patients—dose over 1st year | – | 255 | Calculated dose in first year | Individual model parameters were varied over their distributions using the covariance matrix of the regression model | ±5 |
| Low responder—mean dose | – | 839 | Standard dose (in mg/4 years) multiplied by the ratio of non-sensitive and normal responder dose in KIGS | The observed doses from KIGS were varied over normal distributions | ±5 |
References
- 1.Bang P, Bjerknes R, Dahlgren J, et al. A comparison of different definitions of growth response in short prepubertal children treated with growth hormone. Horm Res Paediatr. 2011;75(5):335–345. doi: 10.1159/000322878. [DOI] [PubMed] [Google Scholar]
- 2.Werther G. Growth hormone measurements versus auxology in treatment decisions: the Australian experience. J Pediatr. 1996;128(5 Pt 2):S47–S51. doi: 10.1016/S0022-3476(96)70011-2. [DOI] [PubMed] [Google Scholar]
- 3.Werther GA, Wang M, Cowell CT. An auxology-based growth hormone program: update on the Australian experience. J Pediatr Endocrinol Metab. 2003;16(Suppl 3):613–618. [PubMed] [Google Scholar]
- 4.Ranke MB, Lindberg A, KIGS International Board. Observed and predicted growth responses in prepubertal children with growth disorders: guidance of growth hormone treatment by empirical variables. J Clin Endocrinol Metab. 2010;95(3):1229–37. [DOI] [PubMed]
- 5.Bang P, Ahmed SF, Argente J, Backeljauw P, Bettendorf M, Bona G, Coutant R, Rosenfeld RG, Walenkamp MJ, Savage MO. Identification and management of poor response to growth-promoting therapy in children with short stature. Clin Endocrinol. 2012;77(2):169–181. doi: 10.1111/j.1365-2265.2012.04420.x. [DOI] [PubMed] [Google Scholar]
- 6.Ranke MB, Lindberg A, Brosz M, Kaspers S, Loftus J, Wollmann H, et al. Accurate long-term prediction of height during the first four years of growth hormone treatment in prepubertal children with growth hormone deficiency or Turner syndrome. Horm Res Paediatr. 2012;78(1):8–17. doi: 10.1159/000339468. [DOI] [PubMed] [Google Scholar]
- 7.Bakker B, Frane J, Anhalt H, Lippe B, Rosenfeld RG. Height velocity targets from the national cooperative growth study for first-year growth hormone responses in short children. J Clin Endocrinol Metab. 2008;93(2):352–357. doi: 10.1210/jc.2007-1581. [DOI] [PubMed] [Google Scholar]
- 8.Ranke MB, Lindberg A, Chatelain P, Wilton P, Cutfield W, Albertsson-Wikland K, et al. Derivation and validation of a mathematical model for predicting the response to exogenous recombinant human growth hormone (GH) in prepubertal children with idiopathic GH deficiency. KIGS International Board. Kabi Pharmacia International Growth Study. J Clin Endocrinol Metab. 1999;84(4):1174–1183. doi: 10.1210/jcem.84.4.5634. [DOI] [PubMed] [Google Scholar]
- 9.Ranke MB, Lindberg A, Chatelain P, Wilton P, Cutfield W, Albertsson-Wikland K, et al. Prediction of long-term response to recombinant human growth hormone in Turner syndrome: development and validation of mathematical models. KIGS International Board. Kabi International Growth Study. J Clin Endocrinol Metab. 2000;85(11):4212–4218. doi: 10.1210/jcem.85.11.6976. [DOI] [PubMed] [Google Scholar]
- 10.Pfizer Limited. Summary of Product Characteristics, Date of revision of the text: March 2012, electronic Medicines Compendium (eMC). http://www.medicines.org.uk. Accessed Dec 2012.
- 11.Ranke MB, Lindberg A. Predicting growth in response to growth hormone treatment. Growth Horm IGF Res. 2009;19(1):1–11. doi: 10.1016/j.ghir.2008.08.001. [DOI] [PubMed] [Google Scholar]
- 12.Reiter EO, Price DA, Wilton P, Albertsson-Wikland K, Ranke MB. Effect of growth hormone (GH) treatment on the near-final height of 1258 patients with idiopathic GH deficiency: analysis of a large international database. J Clin Endocrinol Metab. 2006;91(6):2047–2054. doi: 10.1210/jc.2005-2284. [DOI] [PubMed] [Google Scholar]
- 13.Golay A. Pharmacoeconomic aspects of poor adherence: can better adherence reduce healthcare costs? J Med Econ. 2011;14(5):594–608. doi: 10.3111/13696998.2011.597808. [DOI] [PubMed] [Google Scholar]
- 14.Roter DL, Hall JA, Merisca R, Nordstrom B, Cretin D, Svarstad B. Effectiveness of interventions to improve patient compliance: a meta-analysis. Med Care. 1998;36(8):1138–1161. doi: 10.1097/00005650-199808000-00004. [DOI] [PubMed] [Google Scholar]
- 15.National Institute for Health and Clinical Excellence (NICE). Human growth hormone (somatropin) for the treatment of growth failure in children (review of NICE technology appraisal guidance 42), Technology Appraisal 188, 2010.
- 16.Department of Health and Aging, Australian Government. Guidelines for the Pharmaceutical Benefits Scheme Growth Hormone Program. http://www.health.gov.au/hgh. Accessed Sep 2010.
- 17.Wilson TA, Rose SR, Cohen P, Rogol AD, Backeljauw P, Brown R, Hardin DS, Kemp SF, Lawson M, Radovick S, Rosenthal SM, Silverman L, Speiser P, Lawson Wilkins Pediatric Endocrinology Society Drug and Therapeutics Committee Update of guidelines for the use of growth hormone in children: the Lawson Wilkins Pediatric Endocrinology Society Drug and Therapeutics Committee. J Pediatr. 2003;143(4):415–421. doi: 10.1067/S0022-3476(03)00246-4. [DOI] [PubMed] [Google Scholar]
- 18.Bryant J, Cave C, Mihaylova B, et al. Clinical effectiveness and cost-effectiveness of growth hormone in children: a systematic review and economic evaluation. Health Technol Assess. 2002;6(18):1–168. doi: 10.3310/hta6180. [DOI] [PubMed] [Google Scholar]
- 19.Takeda A, Cooper K, Bird A, et al. Recombinant human growth hormone for the treatment of growth disorders in children: a systematic review and economic evaluation. Health Technol Assess. 2010;14(42):1–209. iii–iv. [DOI] [PubMed]
- 20.Joshi AV, Munro V, Russell MW. Cost-utility of somatropin (rDNA origin) in the treatment of growth hormone deficiency in children. Curr Med Res Opin. 2006;22(2):351–357. doi: 10.1185/030079906X80503. [DOI] [PubMed] [Google Scholar]
- 21.Kapoor RR, Burke SA, Sparrow SE, et al. Monitoring of concordance in growth hormone therapy. Arch Dis Child. 2008;93:147–148. doi: 10.1136/adc.2006.114249. [DOI] [PubMed] [Google Scholar]
- 22.Cutfield WS, Derraik JG, Gunn AJ, et al. Non-compliance with growth hormone treatment in children is common and impairs linear growth. PLoS One. 2011;6:e16223. doi: 10.1371/journal.pone.0016223. [DOI] [PMC free article] [PubMed] [Google Scholar]
- 23.Ranke MB, Lindberg A, Martin DD, et al. The mathematical model for total pubertal growth in idiopathic growth hormone (GH) deficiency suggests a moderate role of GH dose. J Clin Endocrinol Metab. 2003;88:4748–4753. doi: 10.1210/jc.2003-030600. [DOI] [PubMed] [Google Scholar]
- 24.Ranke MB, Lindberg A, Albertsson-Wikland K, Wilton P, Price DA, Reiter EO. Increased response, but lower responsiveness, to growth hormone (GH) in very young children (aged 0–3 years) with idiopathic GH deficiency: analysis of data from KIGS. J Clin Endocrinol Metab. 2005;90:1966–1971. doi: 10.1210/jc.2004-1051. [DOI] [PubMed] [Google Scholar]
- 25.Ranke MB, Lindberg A, Cowell CT, et al. Prediction of response to growth hormone treatment in short children born small for gestational age: analysis of data from KIGS (Pharmacia International Growth Database) J Clin Endocrinol Metab. 2003;88:125–131. doi: 10.1210/jc.2002-020867. [DOI] [PubMed] [Google Scholar]
- 26.Ranke M, Guilbaud O. Growth hormone levels in response to stimulation tests and responsiveness to growth hormone in children with growth hormone deficiency and idiopathic short stature. Kabi Pharm Int Growth Study. 1992;8(1):34–41. [Google Scholar]