

Abstract
Background
Aggressive neuroblastoma remains a significant cause of childhood cancer death despite current intensive multimodal treatment protocols. The purpose of the present work was to characterize the genetic and clinical diversity of such tumors by high resolution arrayCGH profiling.
Methods
Based on a 32K BAC whole-genome tiling path array and using 50-250K Affymetrix SNP array platforms for verification, DNA copy number profiles were generated for 34 consecutive high-risk or lethal outcome neuroblastomas. In addition, age and MYCN amplification (MNA) status were retrieved for 112 unfavorable neuroblastomas of the Swedish Childhood Cancer Registry, representing a 25-year neuroblastoma cohort of Sweden, here used for validation of the findings. Statistical tests used were: Fisher’s exact test, Bayes moderated t-test, independent samples t-test, and correlation analysis.
Results
MNA or segmental 11q loss (11q-) was found in 28/34 tumors. With two exceptions, these aberrations were mutually exclusive. Children with MNA tumors were diagnosed at significantly younger ages than those with 11q- tumors (mean: 27.4 vs. 69.5 months; p=0.008; n=14/12), and MNA tumors had significantly fewer segmental chromosomal aberrations (mean: 5.5 vs. 12.0; p<0.001). Furthermore, in the 11q- tumor group a positive correlation was seen between the number of segmental aberrations and the age at diagnosis (Pearson Correlation 0.606; p=0.037). Among nonMNA/non11q- tumors (n=6), one tumor displayed amplicons on 11q and 12q and three others bore evidence of progression from low-risk tumors due to retrospective evidence of disease six years before diagnosis, or due to tumor profiles with high proportions of numerical chromosomal aberrations. An early age at diagnosis of MNA neuroblastomas was verified by registry data, with an average of 29.2 months for 43 cases that were not included in the present study.
Conclusion
MNA and segmental 11q loss define two major genetic variants of unfavorable neuroblastoma with apparent differences in their pace of tumor evolution and in genomic integrity. Other possible, but less common, routes in the development of aggressive tumors are progression of low-risk infant-type lesions, and gene amplifications other than MYCN. Knowledge on such nosological diversity of aggressive neuroblastoma might influence future strategies for therapy.
Keywords: High-risk, Unfavorable, Neuroblastoma, Arraycgh, DNA copy number, Gain, Loss, Amplification, Age
Background
Neuroblastoma is a childhood malignancy that arises from embryonic cells of the sympathetic ganglia or the adrenal medulla [1]. It is mainly a disease of infants and toddlers; more than half of patients with neuroblastoma are diagnosed before two years of age and ~90 percent before age six [2,3]. This age dependence of the incidence of neuroblastoma may be a consequence of developmentally determined disappearance of the pool of immature cells from which neuroblastomas are thought to derive. The disease is clinically diverse, and ranges from cases with a very dismal prognosis, despite modern intensive multimodal therapy, to those with an excellent chance of survival [2]. This variation in clinical behavior is also highly age dependent: children who are diagnosed after two years of age suffer predominantly from aggressive forms. Neuroblastomas that are diagnosed during adolescence and young adulthood are rare, but they are of particular concern because they almost invariably progress, although with an indolent course [4,5]. In sharp contrast, tumors that are diagnosed before 18 months of age are generally associated with a favorable prognosis. Such tumors are usually less advanced, have a propensity for spontaneous involution or maturation, and respond well to mild chemotherapy [2].
These clinical differences correspond to clear differences in tumor genetics [2]. As a general rule, prognostically favorable tumors display numerical imbalances of entire chromosomes and have near-triploid DNA content, whereas higher-risk tumors present with segmental chromosomal aberrations (SCAs) and are often pseudo-diploid. MYCN gene amplification (MNA) was one of the first genetic markers for highly aggressive neuroblastoma to be established [6], and remains a powerful prognostic indicator [7]. More recently, an independent prognostic value of a segmental deletion of 11q has also been recognized [7-9]. Both these aberrations are incorporated in the present International Neuroblastoma Risk Group (INRG) classification system for treatment stratification [10]. Several arrayCGH studies in the recent years support the MNA/segmental 11q loss dichotomy of high-risk neuroblastoma and indicate that any type of segmental numerical chromosomal aberration is a negative prognostic sign [11-13]. However, the representativeness of the studied tumor materials may be questioned because the tumors were from multiple sources and, hence, selection bias may have occurred. Therefore, the present study aims at characterizing the heterogeneity of genetic aberrations in aggressive neuroblastoma by exploiting a consecutive, population-based series of tumors, the representativeness of which was tested against data in the Swedish Childhood Cancer Registry. The most striking observations were related to age at tumor presentation: MNA tumors were associated with a particularly early age at diagnosis and low numbers of other chromosomal aberrations suggesting a rapid tumor evolution with few genetic hits involved, whereas 11q deleted tumors were diagnosed at older ages and showed significantly more SCAs, the numbers of which were positively correlated with the age at diagnosis, suggesting a chromosomal instability phenotype with a more stepwise tumor evolution. Other tumors seemed to be the result of late progression of low-risk neuroblastoma or of gene amplifications other than MYCN. This clinicogenetic diversity of unfavorable neuroblastoma is likely to reflect differences in tumor evolution and growth, which may have therapeutic implications.
Methods
Study design
In order to obtain a representative view at high resolution of DNA copy number aberrations in aggressive forms of neuroblastoma a 32K BAC whole-genome tiling path arrayCGH platform was applied to a consecutive, population-based tumor material (described below). The representativeness of the tumor collection was analyzed by comparing the patients’ ages at diagnosis and proportions of tumors in relation to the presence or absence of MNA with the corresponding data of neuroblastomas registered in the Swedish Childhood Cancer Registry during a 25-year period. For verification of the BACarray-based profiles high-resolution SNP array analyses were performed. Based on publically available gene expression data from neuroblastoma, expression profiles were compared between tumor groups for certain chromosomal regions of interest.
Patient material
Fresh frozen specimens of neuroblastoma were collected consecutively during the period 1986–1994 at all Swedish centers at which pediatric tumor surgery is performed [14]. Samples collected between 1995 and 2010 at Uppsala University Hospital, which treats approximately 20 percent of Swedish patients with neuroblastoma, were also included. The inclusion criteria were: high-risk neuroblastoma, as defined by the INRG classification system [10], progression to disseminated fatal disease, and stage L2 tumors in children >12 years of age at diagnosis (one case). The INRG high-risk criteria applied here were: Stage M tumors in children >18 months of age at diagnosis and all tumors with MNA. Stage MS tumors were excluded. The individual clinical data of all 34 cases included in the study are shown in Table 1.
Table 1.
Clinical data and main genetic findings of 34 unfavorable neuroblastomas
|
ID |
Age |
Sex |
Stage |
Outcome |
Followup |
Survival median |
Site |
WCA |
WCA |
SCA |
SCA |
MNA |
11q- |
Array platform |
|---|---|---|---|---|---|---|---|---|---|---|---|---|---|---|
| (mo) | (INRGSS) | (mo) | (mo) | (nr) | (average) | (nr) | (average) | |||||||
| 52* |
4 |
m |
M |
DOD |
10 |
|
adr |
0 |
|
6 |
|
+ |
|
32K |
| 55 |
8 |
f |
M |
DOD |
16 |
|
adr |
0 |
|
6 |
|
+ |
|
32K, Affymetrix |
| 106* |
10 |
f |
M |
NED |
265 |
|
adr |
0 |
|
12 |
|
+ |
|
32K |
| 123* |
11 |
f |
M |
DOD |
3 |
|
adr |
0 |
|
6 |
|
+ |
|
32K, Affymetrix |
| 241* |
11 |
m |
M |
DOD |
8 |
|
adr |
1 |
|
3 |
|
+ |
|
32K, Affymetrix |
| 244 |
14 |
f |
M |
DOD |
22 |
|
adr |
8 |
|
2 |
|
+ |
|
Affymetrix |
| 212 |
15 |
m |
M |
DOD |
5 |
|
adr |
0 |
|
2 |
|
+ |
|
32K, Affymetrix |
| 240* |
21 |
f |
M |
NED |
43 |
|
adr |
0 |
|
3 |
|
+ |
|
32K, Affymetrix |
| 135* |
22 |
m |
L2 |
DOD |
3 |
|
adr |
0 |
|
3 |
|
+ |
|
32K, Affymetrix |
| 95* |
26 |
f |
M |
DOD |
15 |
|
adr |
0 |
|
8 |
|
+ |
|
32K |
| 238 |
30 |
f |
M |
DOD |
24 |
|
adr |
0 |
|
6 |
|
+ |
|
Affymetrix |
| 207 |
37 |
f |
M |
DOD |
7 |
|
adr |
2 |
|
5 |
|
+ |
|
32K, Affymetrix |
| 217 |
37 |
m |
M |
DOD |
36 |
|
adr |
0 |
|
8 |
|
+ |
|
32K |
| 126 |
138 |
m |
M |
DOD |
9 |
|
adr |
0 |
|
7 |
|
+ |
|
32K, Affymetrix |
|
MNAnot11q- |
|
|
|
|
|
9.5 |
|
|
0.8 |
|
5.5 |
|
|
|
| 68 |
41 |
m |
M |
DOD |
12 |
|
adr |
9 |
|
7 |
|
+ |
+ |
32K, Affymetrix |
| 136* |
48 |
f |
L2 |
DOD |
12 |
|
adr |
1 |
|
8 |
|
+ |
+ |
32K |
|
MNA &11q- |
|
|
|
|
|
12.0 |
|
|
5.0 |
|
7.5 |
|
|
|
| 243 |
32 |
f |
M |
DOD |
28 |
|
adr |
2 |
|
10 |
|
|
+ |
Affymetrix |
| 149 |
34 |
m |
M |
DOD |
16 |
|
adr |
0 |
|
12 |
|
|
+ |
32K, Affymetrix |
| 112 |
40 |
m |
M |
DOD |
18 |
|
adr |
1 |
|
3 |
|
|
+ |
32K, Affymetrix |
| 111* |
42 |
f |
M |
NED |
262 |
|
adr |
0 |
|
7 |
|
|
+ |
32K |
| 155 |
52 |
f |
M |
DOD |
19 |
|
adr |
3 |
|
13 |
|
|
+ |
32K, Affymetrix |
| 32* |
57 |
m |
M |
DOD |
12 |
|
adr |
2 |
|
15 |
|
|
+ |
32K, Affymetrix |
| 110 |
60 |
m |
M |
DOD |
12 |
|
adr |
1 |
|
14 |
|
|
+ |
32K, Affymetrix |
| 69* |
60 |
m |
L2 |
DOD |
17 |
|
th |
1 |
|
14 |
|
|
+ |
32K, Affymetrix |
| 41* |
77 |
f |
M |
DOD |
8 |
|
th |
2 |
|
15 |
|
|
+ |
32K, Affymetrix |
| 49 |
82 |
m |
M |
DOD |
14 |
|
adr |
3 |
|
10 |
|
|
+ |
32K, Affymetrix |
| 209 |
129 |
m |
M |
DOD |
35 |
|
adr |
2 |
|
10 |
|
|
+ |
32K, Affymetrix |
| 229 |
169 |
m |
L2 |
DOD |
34 |
|
adr |
1 |
|
21 |
|
|
+ |
32K, Affymetrix |
|
11q-notMNA |
|
|
|
|
|
16.5 |
|
|
1.5 |
|
12.0 |
|
|
|
| 107* |
23 |
m |
M |
DOD |
10 |
|
adr |
1 |
|
2 |
|
|
|
32K, Affymetriix |
| 131 |
37 |
f |
L2 |
DOD |
21 |
|
adr |
13 |
|
1 |
|
|
|
32K, Affymetriix |
| 130 |
46 |
m |
M |
DOD |
57 |
|
adr |
0 |
|
3 |
|
|
|
32K, Affymetriix |
| 208 |
59 |
m |
L2 |
DOD |
25 |
|
renal |
4 |
|
3 |
|
|
|
32K |
| 242* |
90 |
f |
M |
SD |
37 |
|
th |
12 |
|
5 |
|
|
|
32K, Affymetriix |
| 226* |
91 |
m |
M |
SD |
61 |
|
th |
2 |
|
12 |
|
|
|
32K, Affymetriix |
| Not MNA not 11q- | 23.0 | 5.3 | 4.3 |
Cases are sorted on the basis of genetic category, as determined by the presence of MNA and segmental loss of 11q. Within each tumor category, cases are sorted according to age at diagnosis. Abbreviations: DOD: dead of disease; NED: no evidence of disease; SD: stable disease; WCA: whole-chromosome copy number aberration; SCA: segmental chromosomal copy number aberration; adr: adrenal; th: thoracic. Tumors marked with asterisk (*) with IDs: 52, 106, 123, 241, 240, 135, 95, 136, 111, 32, 69, 41, 107, 242, and 226 are reported also by Carén et al. [15] with the respective codes: 7, 14, 8, 2, 4, 13, 12, 37, 40, 42, 44, 39, 66, 73, and 63, as listed in [15; Table S1].
To ensure that the tumor specimens represented viable tumor tissue their quality was assessed from hematoxylin/eosin stained cryosections, requiring a tumor cell content of at least 60–70%. Ethical approval was obtained from the Regional Ethical Review Board in Uppsala (approval 2007/069), and written informed consent was obtained from the parents.
There is an overlap between tumors included in this work and those of a similar Swedish report [15]. However, our study is based on another collection of biopsies from a partially different set of tumors. The previously reported Affymetrix SNParray data [15] was used for verification of our BACarray results on tumors common to both studies (n=15) and for verification of our data on presently unique tumors (n=19) new original SNParray data was produced. Tumors in common with the aforementioned study are indicated in Table 1 and information on their previous codes [15; Table S1] is given in the table legend.
Array-based comparative genomic hybridization
The 32K BAC array was established as reported previously [16]. High-quality DNA was obtained by standard methods [17]. DNA labeling, hybridization, washing, scanning of arrays, and data processing were performed as described earlier [16,18-20]. Experiments using 50K and 250K Affymetrix arrays were performed in accordance with the manufacturer’s protocol (Affymetrix, Inc., Santa Clara, CA), and as described earlier [21].
Microarray expression data
Publically available gene expression data from high-risk metastatic neuroblastomas, series GSE13136 [22], platform Affymetrix Human Genome U133 Plus 2.0, which were selected by the presence of MNA (GSM328993, GSM328996, GSM329000, GSM329006, GSM329007, GSM329008, GSM329011, GSM329012, GSM329013, GSM329015) or segmental 11q loss (GSM328992, GSM328995, GSM328997, GSM328999, GSM329002, GSM329010, GSM329014, GSM329017) were downloaded from Gene Expression Omnibus (http://www.ncbi.nlm.nih.gov/geo/) and normalized in Expression Console v1.1 (3' Expression Arrays-RMA, Affymetrix).
The Swedish childhood cancer database
Clinical data and the MYCN copy number status for neuroblastomas diagnosed in Sweden during the 25-year period of 1984–2008 were obtained from the Swedish Childhood Cancer Registry. The clinical criteria for inclusion were the same as for the array study. The limit for MNA was set at >4 copies of MYCN per haploid genome, as determined by FISH and/or SNParray.
Statistical analysis
To analyze differences in DNA copy number among the tumor groups, Fisher’s exact test was used within the Nexus Copy Number 5.0 analysis program (BioDiscovery, Inc., El Segundo, CA, USA). To search for genes that were differentially expressed among the tumor groups, an empirical Bayes moderated t-test was applied using the ‘limma’ package [23] and p-values were adjusted in accordance with the method of Benjamini and Hochberg [24]. Clinical data were processed using PASW Statistics 18.0 software (SPSS; Chicago, IL, USA). Mean differences in age were examined with the t-test for independent samples. Co-variations were analyzed by correlation analysis, and the results were expressed as Pearson correlation coefficients.
Results
Identification of two major unfavorable neuroblastoma groups with different genomic signatures
To visualize the results from the complete set of tumors, the percentages of tumors with copy number change were calculated and plotted relative to the position along the chromosomes (Figure 1A). All individual profiles are also illustrated (Additional file 1: Figure S1). Partial or complete gain of one or two copies of the 17q arm was the most common aberration (88% of the tumors), followed by loss of 1p segments (56%), MNA (47%), and loss of 11q (47%; 14 tumors with segmental loss and 2 with loss of one entire chromosome 11) (Figure 1A and Additional file 1: Figure S1). Subsequently, we examined the frequencies of copy number changes in tumor subgroups that were defined on the basis of the absence or presence of MNA and segmental 11q loss (11q-); hence, the tumors were separated into four subgroups: MNAnot11q- (n=14), 11q-notMNA (n=12), MNA and 11q- (n=2), and neither MNA nor 11q- (n=6). The results are shown in Figure 1B-D and Additional file 1: Figure S1. Selected profiles from each group are shown in Figure 2. Analysis using Fisher’s exact test of differences between the MNAnot11q- and 11q-notMNA groups (which contained most of the samples, 26/34; 76%) revealed that loci on 1p, 2p, 3p, 5q, 7, 11, 12, 18p, and 20q were differentially altered between the two sets of tumors (Figure 1E). These groups also differed in terms of the number of SCAs (mean 5.5 and 12.0, respectively; Table 1, p<0.001, Wilcoxon’s test), and with regard to an absence of numerical whole chromosomal aberrations, which was the case in 11/14 MNAnot11q- tumors, but in only 2/12 11q-notMNA tumors (Table 1 and Additional file 1: Figure S1). Finally, tumors that showed neither MNA nor 11q- were more heterogeneous in terms of both segmental and whole chromosomal aberrations; two tumors showed aberrations in chromosome number for the majority of chromosomes (ID 131 and ID 242; Table 1 and Additional file 1: Figure S1).
Figure 1.

Genetic findings in unfavorable neuroblastoma. The frequency of copy number changes was calculated for all measurement points in the arrays and plotted relative to the position along the chromosome for: (A): all tumors, (B): MNAnot11q- tumors, (C): 11q-notMNA tumors, (D): neither MNA nor 11q loss tumors. The number of analyzed tumors is indicated (n). Green bars above the horizontal line indicate the percentage of tumors with copy gains and red bars below the horizontal line indicate the percentage of tumors with copy losses. Data for the X chromosome were normalized to female reference DNA and the respective proportion of boys in panels A-D were: 56%, 43%, 67%, and 67%, respectively (E): To search for copy number alterations that differ between the11q-notMNA and MNAnot11q- groups, the frequency percentage difference between the two groups are plotted: Copy number gain difference (green graph): Values above baseline represent regions in which gains are more numerous among 11q-not MNA tumors, and vice versa for values below baseline. Deletion difference (red graph): Values above baseline represent regions in which losses are more common among MNAnot11q- tumors, and vice versa for values below baseline. The regions significantly differentially altered between the groups, identified by using Fisher's exact test within Nexus copy-number software, (p<0.05 and threshold difference in frequency >25%), are shown below the graph, as indicated by a black arrow.
Figure 2.

Examples of individual neuroblastoma profiles within genetic subgroups. (A) MNAnot11q-; (B) 11q-notMNA; (C) combined MNA and segmental 11q loss; (D) neither MNA nor segmental 11q loss; (E) shows an expanded segment of chromosome 12 in panel (D). Amplified genes of particular oncogenic interest are indicated. Each individual clone was assigned a copy number class as follows: i) balanced: two alleles (blue dots); ii) gained: presence of three (red) or more (pink dots) alleles; or iii) deleted: hemizygous deletions (green dots). No homozygous deletions were found in these tumors. Black arrows indicate MNA amplification, 11q loss or other amplifications.
Age dependence of genetic subgroups
As shown in Table 1 and in Figure 3, MNA tumors were diagnosed early in life. In fact, 11 out of the 12 children who were youngest at diagnosis suffered from MNA tumors. If an outlier amongst the MNA group in terms of genetic profile and age (ID126; Table 1 and Additional file 1: Figure S1) is disregarded, only two 11q-notMNA tumors were diagnosed in the same young age range as that of the remaining MNAnot11q- tumors (Table 1 and Figure 3). Statistically, the ages at diagnosis of children with MNAnot11q- tumors differed highly significantly from those of children with 11q-notMNA tumors (mean age: 27.4 vs. 69.5 months, respectively; p=0.008; median age: 18 vs. 58.5 months, respectively; n=14 vs. 12).
Figure 3.
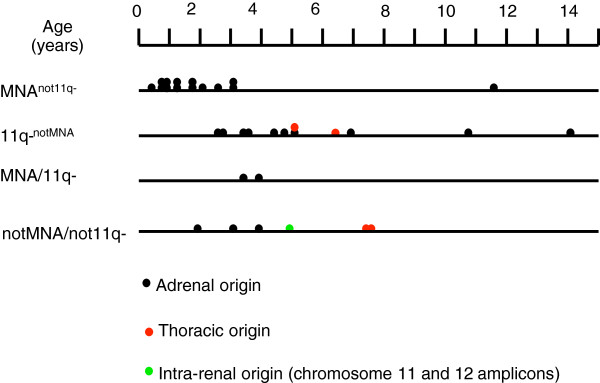
Age at diagnosis in unfavorable neuroblastoma (n=34). Each tumor in the present study is plotted on a time axis according to age at diagnosis and genetic subgroup. Color symbols indicate the likely site of origin.
To test the validity of these findings in a larger sample, we utilized the Swedish Childhood Cancer Registry, which contained clinical information and data on the copy number of MYCN in tumors for 240 cases of neuroblastoma that were diagnosed during almost the same time period as the cases in the present study. Among these, 112 were unfavorable cases (100 high risk and 12 intermediate risk who suffered lethal tumor progression). Of the tumors included in the current study, 25 were represented among these 112 cases in the registry, and 11 of the 25 were cases with MNA. Given that 11q status is not registered consistently in the database, we compared the age at diagnosis of children with MNA tumors to those with non-MNA tumors. This analysis revealed highly significant differences both for the present study (MNA vs. non-MNA: mean: 29.5 vs. 65.6 months; p=0.005; median age: 21 vs. 58 months; n=16 vs. 18) and for cases of unfavorable neuroblastoma in the registry that were not included in the present study (MNA vs. non-MNA: mean age: 29.2 vs. 49.1 months; p=0.001; median age: 24 vs. 43.5 months; n=43 vs. 44). To determine whether the MNA cases included in our study might be biased towards a younger age range, we compared their ages at diagnosis to those of the other MNA cases in the registry and found no statistical difference (mean: 29.5 vs. 29.2 months; median: 21 vs. 24 months; p=0.968; n=16 vs. 43). There was also no statistically significant difference in the distribution of ages at diagnosis for non-MNA tumors (mean: 65.6 vs. 49.1 months; median: 58 vs. 43.5 months; p=0.098; n=18 vs. 44).
When the findings were merged, we were able to conclude that, among Swedish children who were diagnosed with unfavorable neuroblastoma during this time period, MNA tumors were almost four-fold more common than non-MNA tumors when diagnosis was made before two years of age (31 vs. 8), whereas this relationship was reversed in children who were diagnosed after 3.5 years of age (10 vs. 35; Figure 4).
Figure 4.

MYCN amplification status and age at diagnosis of Swedish patients with unfavorable neuroblastoma (n=121). Present cases, representing the period 1986–2010, have been merged with all other cases of unfavorable neuroblastoma found in the Swedish Childhood Cancer Registry during the period 1984–2008. Data is presented in 6-month age intervals. Unfavorable criteria were: lethal tumor progression, MYCN amplification, INRGSS Stage M and >18 months of age at diagnosis, and INRGSS Stage L2 >12 years of age at diagnosis.
In view of the high number of SCAs that were found in tumors with segmental 11q deletion, we investigated the possibility of an age-dependence for the number of SCAs within this tumor subgroup and found a positive correlation with age at diagnosis (Pearson correlation 0.606; p=0.037). When merging the four genetic groups the age dependence of SCA numbers was even more evident with a p-value of 0.001 (Pearson correlation 0.547; Figure 5).
Figure 5.

Age dependence of segmental chromosomal aberrations in unfavorable neuroblastoma (n=34). Data are separated by genetic subtype, as indicated. X-axis: age at diagnosis (years). Y-axis: number of segmental chromosomal aberrations (SCA; amplicons not included).
High copy number amplicons
In total, 17 tumors displayed amplified regions. The number of these amplified regions per tumor varied from one to seven, and their sizes ranged from 0.15 to 6.8 Mb. Of the 16 tumors with MNA, either the MYCN-containing amplicon was the only amplification event or it was accompanied by multiple amplified loci within 2p, and in one case by two amplified loci on chromosome 3q. The regions of amplification, their frequencies, and the genes encompassed are listed in Table 2. In one tumor with MNA and its associated cell line [15], a few novel amplicons were found, which encompassed genes such as GDF7, FSHR, PRKCE, and TMEM18 (Additional file 2: Figure S2). Overall, 20% of the amplified loci did not encompass any gene (Table 2). One unusual case (ID 208) displayed multiple amplicons but not MNA. Genes of particular oncogenic interest within these loci were CCND1, FGF4, FGF19, IGHMBP2, MYEOV, and ORAOV1 on 11q13.2-q13.3 and CDK4, MDM2, and KSR2 on 12q13.3-q15 (Figure 2D-E and Table 2).
Table 2.
Regions of amplification in unfavorable neuroblastoma (n=17)
| Chr Region (Mb) | Cyto-band | Length(Mb) | Genes | Gene Symbols | Group | No of tumors |
|---|---|---|---|---|---|---|
| chr:2:0.366-0.793 |
p25.3 |
0.427 |
1 |
TMEM18 |
NMA |
1 |
| chr:2:2.304-6.219 |
p25.3-p25.2 |
3.915 |
12 |
ADI1, ALLC, COLEC11, LOC150622, LOC400940, LOC730811, MYT1L, RNASEH1, RPS7, SOX11, TSSC1, TTC15 |
NMA |
1 |
| chr:2:3.605-4.280 |
p25.3 |
0.675 |
3 |
ALLC, COLEC11, RPS7 |
NMA |
1 |
| chr:2:5.708-7.439 |
p25.2-p25.1 |
1.731 |
6 |
CMPK2, LOC150622, LOC400940, RNF144A, RSAD2, SOX11 |
NMA |
1 |
| chr:2:6.372-6.855 |
p25.2 |
0.483 |
0 |
|
NMA |
1 |
| chr:2:10.413-11.244 |
p25.1 |
0.831 |
10 |
ATP6V1C2, C2orf50, HPCAL1, KCNF1, NOL10, ODC1, PDIA6, PQLC3, ROCK2, SNORA80B |
NMA |
2 |
| chr:2:11.622-11.878 |
p25.1 |
0.256 |
3 |
GREB1, LPIN1, NTSR2 |
NMA |
1 |
| chr:2:13.097-13.580 |
p24.3 |
0.483 |
0 |
|
NMA |
1 |
| chr:2:14.219-14.292 |
p24.3 |
0.073 |
0 |
|
NMA |
2 |
| chr:2:15.895-16.095 |
p24.3 |
0.200 |
2 |
MYCN, MYCNOS |
NMA |
16 |
| chr:2:16.675-16.705 |
p24.3 |
0.030 |
1 |
FAM49A |
NMA |
6 |
| chr:2:16.846-17.106 |
p24.3-p24.2 |
0.260 |
0 |
|
NMA |
6 |
| chr:2:18.197-18.423 |
p24.2 |
0.227 |
0 |
|
NMA |
3 |
| chr:2:20.546-21.012 |
p24.1 |
0.466 |
3 |
C2orf43, GDF7, HS1BP3 |
NMA |
1 |
| chr:2:22.493-25.674 |
p24.1-p23.3 |
3.181 |
21 |
ADCY3, ATAD2B, C2orf44, C2orf79, C2orf84, CENPO, DNAJC27, DNMT3A, DTNB, EFR3B, FKBP1B, ITSN2, KLHL29, LOC375190, MFSD2B, NCOA1, PFN4, POMC, SF3B14, TP53I3, UBXN2A |
NMA |
1 |
| chr:2:26.853-27.169 |
p23.3 |
0.316 |
9 |
AGBL5, C2orf18, CENPA, DPYSL5, EMILIN1, KHK, LOC100128731, MAPRE3, TMEM214 |
NMA |
2 |
| chr:2:28.022-28.430 |
p23.2 |
0.408 |
1 |
BRE |
NMA |
2 |
| chr:2:29.071-30.833 |
p23.2-p23.1 |
1.762 |
8 |
ALK, C2orf71, CAPN13, CLIP4, FAM179A, LBH, LCLAT1, YPEL5 |
NMA |
2 |
| chr:2:38.841-39.010 |
p22.1 |
0.168 |
4 |
DHX57, GEMIN6, LOC100271715, MORN2 |
NMA |
1 |
| chr:2:45.742-46.467 |
p21 |
0.725 |
2 |
EPAS1, PRKCE |
NMA |
1 |
| chr:2:47.379-47.698 |
p21-p16.3 |
0.319 |
3 |
EPCAM, KCNK12, MSH2 |
NMA |
1 |
| chr:2:48.848-49.512 |
p16.3 |
0.664 |
1 |
FSHR |
NMA |
1 |
| chr:3:170.768-172.093 |
q26.2 |
1.325 |
18 |
ARPM1, CLDN11, EIF5A2, GPR160, LOC100128164, LRRC31, LRRC34, LRRIQ4, MECOM, MYNN, PHC3, PRKCI, RPL22L1, SAMD7, SEC62, SKIL, SLC7A14, TERC |
NMA |
1 |
| chr:3:173.047-173.459 |
q26.31 |
0.411 |
2 |
FNDC3B, TMEM212 |
NMA |
1 |
| chr:11:68.463-69.308 |
q13.2-q13.3 |
0.845 |
9 |
CCND1, FGF19, FGF4, IGHMBP2, MRGPRD, MRGPRF, MYEOV, ORAOV1, TPCN2 |
Not NMA, not 11q- |
1 |
| chr:12:56.182-57.066 |
q13.3-q14.1 |
0.884 |
23 |
AGAP2, AVIL, B4GALNT1, CDK4, CTDSP2, CYP27B1, DCTN2, DDIT3, DTX3, FAM119B, GEFT, KIF5A, LOC100130776, MARCH9, MARS, MBD6, METTL1, OS9, PIP4K2C, SLC26A10, TSFM, TSPAN31, XRCC6BP1 |
Not NMA, not 11q- |
1 |
| chr:12:67.060-68.692 |
q15 |
1.632 |
13 |
BEST3, CCT2, CPM, CPSF6, FRS2, LRRC10, LYZ, MDM2, NUP107, RAB3IP, RAP1B, SLC35E3, YEATS4 |
Not NMA, not 11q- |
1 |
| chr:12:71.578-73.413 |
q21.1 |
1.835 |
1 |
LOC552889 |
Not NMA, not 11q- |
1 |
| chr:12:83.287-83.563 |
q21.31 |
0.276 |
0 |
|
Not NMA, not 11q- |
1 |
| chr:12:116.476-116.802 | q24.22-q24.23 | 0.326 | 1 | KSR2 | Not NMA, not 11q- | 1 |
Regions that involved at least two neighboring clones, with copy number count >3 and normalized fluorescence ratio >2 are shown. For amplicons with regions shared between tumors, the minimal overlapping region is shown. Genes of particular oncogenic interest in neuroblastoma are indicated in bold.
Differentially expressed genes within aberrant regions of MNA and 11q-deleted tumors
Given that MNA and 11q- neuroblastomas present with divergent genomic signatures, we sought differences in gene expression profiles within the regions that differed most consistently between these two groups (1p, 2p, and chromosomes 7 and 11). For this purpose, we compared publicly available gene expression data for high-risk neuroblastomas with recorded MNA and 11q status (see Methods). Among the MNA tumors (n=10), five tumor suppressor genes (among other genes) were underexpressed within the distal 1p: CAMTA1, KIF1B, PRDM2, FABP3, and CDKN2C; whereas MYCNOS and MYCN were the two top differentially upregulated genes on 2p. Several constituents of the extracellular matrix or membrane proteins involved in cell adhesion, motility or proliferation that map to chromosome 7, namely PTN, CNTNAP2, ELN, HSPB1, SEMA3E, and COL1A2, were upregulated in the 11q-deleted group (n=8). In the same group of tumors, CD44 was the top upregulated gene on 11p. Interestingly, on 11q, several tumor suppressor genes and genes encoding DNA-binding proteins involved in DNA repair and negative regulation of transcription were downregulated in the 11q-deleted tumors: C11orf30, RSF1, CREBZF, FAT3, MRE11A, ATM, CADM1, MLL, H2AFX, TBRG1, and CHK1.
Discussion
In this report, we describe the DNA copy number profiles of a consecutive series of neuroblastomas that were selected on the basis of unfavorable characteristics. The findings revealed considerable genetic heterogeneity within this clinically troublesome group, which was particularly evident when comparing tumors with MNA to those with segmental 11q deletions. With few exceptions, MNA and segmental 11q loss were mutually exclusive and defined two genetic subgroups of equal size that comprised more than three-quarters of the total samples. Such genetic dichotomy of advanced neuroblastoma has been well described previously [2,7,8,11,15] and both MNA and segmental 11q loss are included in the current INRG algorithm for pretreatment stratification of risk [10]. Less predictably, we also observed a clear clinical difference between these two genetic subgroups in relation to age: MNA tumors affected the youngest children of the series. It is surprising that this age dependence with respect to the tumor genetics of neuroblastoma has not received much scientific attention previously, although mentioned in several previous studies [9,11,15,25]. In view of the relatively moderate size of the present tumor series, it was important that we were able to confirm a generally low age at diagnosis for children with MNA tumors using independent data from the Swedish Childhood Cancer Registry; these data argued clearly against a bias in the present material. We conclude from the present findings that unfavorable neuroblastomas are predominantly of the MNA type when diagnosed under the age of 2 years, whereas tumors with loss of 11q and other genetic variants predominate after 3.5 years of age.
As the Swedish Childhood Cancer Registry, due to lack of records, could not be used to verify the older age at diagnosis for children with 11q-deleted tumors we searched the literature for this information: Spitz et al. [9] reported on segmental 11q deletions from a cohort of 611 neuroblastomas, found in 159 tumors. The median age at diagnosis of these 11q-deleted tumors was 3–5 years, constituting 59 percent of the tumors of this age range. Michels et al. [11] reported 48 and 28 months as median ages at diagnosis for ten 11q-deleted and 22 MNA tumors, respectively. In a meta study by Vandesompele et al. [25] poor risk neuroblastomas were separated into two genetic “clusters”: The median age of 45 children belonging to the 11q deletion “cluster” was 41 months, although notably only 30 of the tumors were actually 11q deleted. The corresponding figures for 74 children belonging to the MNA “cluster” was 26.9 months median age with actual MNA seen in 51 tumors. Finally, Carén et al. [15] reported a median age of 42 months for 21 children with 11q-deleted tumors (four of which were common with our study) compared to 21 months for 37 children with MNA tumors (seven in common with our study). Together, these data consistently support an age difference between the two groups, although a certain bias towards older ages for 11q-deleted tumors in the present study is observed (58.5 months median age).
Another difference that was observed between MNA and 11q-deleted tumors was the higher number of SCAs in the later group of tumors and a dependence of their prevalence on age, both of which imply a chromosomal instability phenotype, as suggested previously by Carén et al. [15]. Future analyses using larger sample sizes, including multiple tumor specimens (synchronous and metachronous), might be helpful in confirming such chromosomal instability. Also, deep sequencing might shed additional light on differences in genomic integrity at the DNA level among subsets of neuroblastoma. A recent report [26], based on whole-genome sequencing of 87 neuroblastomas of all stages, showed that the frequency of somatic amino-acid-changing mutations strongly correlated to tumor stage, survival, and age at diagnosis. However, no difference in frequency of such mutations was detected when comparing MNA tumors to high-stage non-MNA tumors. Hence, this aformentioned study reported a general age dependence of amino-acid-changing mutations in neuroblastoma, albeit the specific issue of DNA instability in tumors with deleted 11q, as compared to MNA tumors, was not addressed.
On the basis of the profile subtypes that were observed in the presently relatively limited series of tumors, and in view of previous data by others, we speculate on the existence of four genetic routes for the genesis of aggressive neuroblastoma:
The MNA route
MNA neuroblastomas seem to fit into a model of rapid tumor evolution that involves only a few genetic events, which transform the progenitor cells into highly proliferative and primary metastatic tumor cells in a straightforward fashion. The likelihood of such few events to take place would, logically, be more proportional to the pool of cells of origin than for tumors requiring a larger sequence of genetic hits (e.g. 11q deleted tumors), hence explaining the early in life appearance of MNA tumors.
The 11q route
It appears that the pathogenesis of tumors with segmental 11q loss accords with the traditional genetic model for adult cancer, which predicts a micro-evolutionary process of cancer development, with successive genetic hits affecting key cellular functions [27]. Acquisition of chromosomal instability might be fundamental in this process. Our analysis of differential gene expression in 11q-deleted tumors vs. MNA neuroblastomas pinpointed some candidate tumor suppressor/DNA repair genes within the region of 11q that is deleted, such as ATM, MLL, H2AFX, and CHK1. Recently, the importance of aberrant gene expression within this region was underscored by the finding that decreased expression of genes within the region of interest at 11q was observed only in those 11q-deleted tumors with an aggressive clinical phenotype [28]. It is noteworthy, in this context, that a subgroup of 11q-deleted tumors with more favorable clinical characteristics has been described [28,29]. Apart from not showing a disproportionate downregulation of the expression of genes of the deleted region, such tumors were also reported to differ from unfavourable 11q-deleted tumors regarding microRNA expression profiles [29] and by having less SCAs [28]. It is therefore possible that the here suggested 11q route is not an important element in the pathogenesis of less aggressive tumors with 11q deletions. Evidently, our statistics on the present 11q-notMNA tumors represents the unfavorable type of 11q-deleted neuroblastoma since there was only one survivor in this group. It is noticeable in this context that our inclusion criteria would discriminate against tumors of the more favorable subtype.
The tumor progression route
A third possibility in the evolution of aggressive neuroblastoma is progression from lower-risk tumors [13]. Although progression from a low-risk lesion to an aggressive tumor is considered in general to be a rare event, we think that three of the nonMNA/non11q deleted tumors in the present study might have evolved in this way. Two tumors showed genetic similarity to low-risk tumors in that they showed whole chromosome aberrations for more than half of the chromosomes and only few segmental gains or losses. It appears particularly likely that a third tumor (ID 226) was derived from a lower-risk tumor: on diagnosis at 7.5 years of age, it was revealed that a chest X-ray taken 6 years earlier already then showed the primary tumor. Genetically, the tumor had much in common with 11q deleted tumors, but 11q was intact.
Alternative amplicon driven routes
An unusual genetic variant of the present study was a tumor with multiple amplicons on 11q and 12q. There are other examples in the literature of neuroblastoma cell lines and tumors with very similar amplified regions at 11q13 [11,25] or 12q13–q15 [11,21,30], respectively, and in two tumors synchronous amplification on both chromosomes have been reported [11,31,32], as in the present case. CCND1, IGHMBP2, ORAOV1, FGF4 on chromosome 11q13, and CDK4 and MDM2 on 12q13-15 are interesting oncogenes in this context. Generally, neuroblastomas with 11q13 amplicons were reported to be clinically aggressive and associated with an older age at diagnosis compared to children with MNA tumors of the present study. However, those 11q13 amplified neuroblastomas which also displayed MNA were diagnosed at earlier ages [11]. Clinical information on 12q amplified neuroblastoma is sparse in the literature but indicates advanced disease [30,33,34]. MNA may occur also in 12q amplified neuroblastoma [21,30,31]. Amplicons of other chromosomal regions are described in single cases of poor outcome neuroblastoma, involving 16q.21, 4q.33, 6p12-21 [25], 5q33.3 [11], and the MYC containing 8q24 region [26]. Hence, with the support of these previously published data, it seems that our case harboring chromosome 11 and 12 amplifications is not totally unique and implies that such and other non-MYCN amplifications may underlie a minor subset of aggressive neuroblastomas.
Conclusions
On the basis of these categories, we suggest the following metaphor for the genesis of unfavorable neuroblastoma: MNA, segmental deletion of 11q, and low-risk precursor lesions provide an elevator, a staircase, and a first step of a staircase, respectively, towards unfavorable neuroblastoma. This metaphor builds on the notion that the first steps in tumor development take place during a common early developmental phase when the immature cells that are the source of neuroblastoma are still present in the sympathetic nervous system, whereas subsequent tumorigenic events differ in malignant effect between the genetic routes. Our speculations on main routes for the pathogenesis of unfavourable neuroblastoma are summarized in Figure 6, showing the four mentioned routes and adding also adolescent neuroblastoma as a separate, but still obscure, route. The present delineation of genetic subsets of unfavorable neuroblastoma might have therapeutic implications. It would seem that MNA tumors are more proliferative, which calls for a dose-intensive treatment, and the relatively “clean” genetics of MNA neuroblastomas would appear to make them suitable for tailored treatments that target the functions of MYCN, e.g. apoptosis [35]. Novel therapeutic strategies specifically for 11q-deleted neuroblastoma are urgently needed, and the identification of novel subsets of neuroblastomas with non-MYCN amplifications may also have therapeutic consequences, but these will have to await more conclusive information on the genetic and clinical homogeneity of such tumors. Finally, the possibility of a transition from low- to high-risk disease in some cases may have implications for the monitoring of low-risk rest tumors.
Figure 6.

A proposed model for the age dependence of unfavorable neuroblastoma. The model builds on the assumption of an early common cellular origin of all neuroblastomas. Depending on genetic subtype the respective tumorigenic hits differ in type, number and degree of malignant effect - most evident when comparing MNA and 11q- tumors. As tumors with alternative amplifications, putative low-to-high-risk progression, and adolescent presentation are poorly represented in the present study and in the literature these routes for tumor development are largely speculative, indicated by question marks. Abbreviation: NB: neuroblastoma; Symbols: Arrows: tumorigenic hits; Darkness of arrow: degree of malignant transformation; Arrow width/size of symbol for clinical disease: relative frequency of tumor subtype; Solid curved blue line: low-risk neuroblastoma development.
Abbreviations
Adr: Adrenal; BAC: Bacterial artificial chromosome; CGH: Comparative genomic hybridization; DOD: Dead of disease; INRGSS: International Neuroblastoma Risk Group Staging System; MNA: MYCN amplification; NED: No evidence of disease; NB: Neuroblastoma; SCA: Segmental chromosomal aberration; SD: Stable disease; Th: Thoracic; WCA: Whole chromosomal aberration; 11q-: Segmental deletion on 11q.
Competing interests
None of the authors have declared any financial or non-financial competing interests.
Authors’ contributions
CC performed DNA preparations and BAC array analyses, compiled the data, and participated in drafting the manuscript. TM was responsible for Affymetrix SNP array verification analyses and contributed with critical revision of the manuscript. JS contributed with important methodological assistance with the BAC array analyses and critical reading of the manuscript. CT contributed with the data from the Swedish Childhood Cancer Registry. PK contributed with tumor materials and clinical data and conceptually in the drafting of the manuscript, JD had chief responsibility for the development and use of the BAC array platform and contributed with critical revision of the manuscript. TDS had main responsibility for the design and realization of the study, including drafting of the manuscript. FH conceived of the study, participated in its design, was responsible for collecting tumor samples and clinical data throughout the years, and had main responsibility for the drafting of the manuscript. All authors read and approved the final manuscript.
Authors’ information
CC held a postdoc research position at the Department of Immunology, Genetics and Pathology, Uppsala University during the work. TM is a Professor of tumor genetics at the Department of Clinical Genetics, University of Gothenburg and a senior researcher on neuroblastoma. JS was a PhD student at the Department of Immunology, Genetics and Pathology, Uppsala University involved in the development of the BAC array platform and later holds a postdoc position at the Department of Oncology-Pathology, Karolinska Institutet. CT is an MD, PhD, specialist in pediatric oncology and a senior researcher on neuroblastoma at Karolinska Institutet. PK is an MD, PhD, and specialist in pediatric oncology with national responsibilities for neuroblastoma treatment, and senior researcher on neuroblastoma at Karolinska Institutet. JD is a professor of experimental pathology at the Department of Immunology, Genetics and Pathology, Uppsala University. TDS is an associate Professor at the Department of Oncology-Pathology, Karolinska Institutet and formerly at the Department of Immunology, Genetics and Pathology, Uppsala University. FH is an MD, PhD, and specialist in pediatric oncology and senior researcher on neuroblastoma at the Department of Immunology, Genetics and Pathology and Women’s and Children’s Health, Uppsala University.
Pre-publication history
The pre-publication history for this paper can be accessed here:
Supplementary Material
Schematic representation of genetic profiles for neuroblastoma samples included in the study (n=34). Deleted and gained regions are represented by red and green bars, respectively. Cases are arranged according to genetic subgroup.
Novel amplicons in association with MNA on 2p: 32K whole-genome array data are shown from: (A) the primary tumor of case ID55; (B) cell line U2715, which was established from this tumor.
Contributor Information
Cihan Cetinkaya, Email: cihan.cetinkaya@surgsci.uu.se.
Tommy Martinsson, Email: tommy.martinsson@gu.se.
Johanna Sandgren, Email: johanna.sandgren@ki.se.
Catarina Träger, Email: catarina.trager@ki.se.
Per Kogner, Email: per.kogner@ki.se.
Jan Dumanski, Email: jan.dumanski@igp.uu.se.
Teresita Díaz de Ståhl, Email: teresita.diaz.de.stahl@ki.se.
Fredrik Hedborg, Email: fredrik.hedborg@kbh.uu.se.
Acknowledgements
The authors thank: Johan Wadenbäck, Simin Tahmasebpoor, Inga Hansson and Ulrika Larsson for skilled technical support; Robin Andersson for developing SMAP within the LCB Data; Carl Bruder for decisive contributions in producing the BAC arrays; Sven Påhlman for collaboration in organizing the national collection of tumor specimens in 1986–1994; and the Swedish Childhood Cancer Foundation and Karolinska Institutet for financial support.
References
- Brodeur GM. Neuroblastoma: biological insights into a clinical enigma. Nat Rev Cancer. 2003;3(3):203–216. doi: 10.1038/nrc1014. [DOI] [PubMed] [Google Scholar]
- Maris JM. Recent advances in neuroblastoma. N Engl J Med. 2010;362(23):2202–2211. doi: 10.1056/NEJMra0804577. [DOI] [PMC free article] [PubMed] [Google Scholar]
- Park JR, Eggert A, Caron H. Neuroblastoma: biology, prognosis, and treatment. Hematol Oncol Clin North Am. 2010;24(1):65–86. doi: 10.1016/j.hoc.2009.11.011. [DOI] [PubMed] [Google Scholar]
- Franks LM, Bollen A, Seeger RC, Stram DO, Matthay KK. Neuroblastoma in adults and adolescents: an indolent course with poor survival. Cancer. 1997;79(10):2028–2035. doi: 10.1002/(SICI)1097-0142(19970515)79:10<2028::AID-CNCR26>3.0.CO;2-V. [DOI] [PubMed] [Google Scholar]
- Polishchuk AL, Dubois SG, Haas-Kogan D, Hawkins R, Matthay KK. Response, survival, and toxicity after iodine-131-metaiodobenzylguanidine therapy for neuroblastoma in preadolescents, adolescents, and adults. Cancer. 2011;117(18):4286–4293. doi: 10.1002/cncr.25987. [DOI] [PMC free article] [PubMed] [Google Scholar]
- Brodeur GM, Seeger RC, Schwab M, Varmus HE, Bishop JM. Amplification of N-myc in untreated human neuroblastomas correlates with advanced disease stage. Science. 1984;224(4653):1121–1124. doi: 10.1126/science.6719137. [DOI] [PubMed] [Google Scholar]
- Janoueix-Lerosey I, Schleiermacher G, Michels E, Mosseri V, Ribeiro A, Lequin D, Vermeulen J, Couturier J, Peuchmaur M, Valent A. Overall genomic pattern is a predictor of outcome in neuroblastoma. J Clin Oncol. 2009;27(7):1026–1033. doi: 10.1200/JCO.2008.16.0630. [DOI] [PubMed] [Google Scholar]
- Attiyeh EF, London WB, Mosse YP, Wang Q, Winter C, Khazi D, McGrady PW, Seeger RC, Look AT, Shimada H. Chromosome 1p and 11q deletions and outcome in neuroblastoma. N Engl J Med. 2005;353(21):2243–2253. doi: 10.1056/NEJMoa052399. [DOI] [PubMed] [Google Scholar]
- Spitz R, Hero B, Simon T, Berthold F. Loss in chromosome 11q identifies tumors with increased risk for metastatic relapses in localized and 4S neuroblastoma. Clinical cancer research : an official journal of the American Association for Cancer Research. 2006;12(11 Pt 1):3368–3373. doi: 10.1158/1078-0432.CCR-05-2495. [DOI] [PubMed] [Google Scholar]
- Cohn SL, Pearson AD, London WB, Monclair T, Ambros PF, Brodeur GM, Faldum A, Hero B, Iehara T, Machin D. The international neuroblastoma risk group (INRG) classification system: an INRG task force report. J Clin Oncol. 2009;27(2):289–297. doi: 10.1200/JCO.2008.16.6785. [DOI] [PMC free article] [PubMed] [Google Scholar]
- Michels E, Vandesompele J, De Preter K, Hoebeeck J, Vermeulen J, Schramm A, Molenaar JJ, Menten B, Marques B, Stallings RL. ArrayCGH-based classification of neuroblastoma into genomic subgroups. Genes Chromosomes Cancer. 2007;46(12):1098–1108. doi: 10.1002/gcc.20496. [DOI] [PubMed] [Google Scholar]
- Mosse YP, Diskin SJ, Wasserman N, Rinaldi K, Attiyeh EF, Cole K, Jagannathan J, Bhambhani K, Winter C, Maris JM. Neuroblastomas have distinct genomic DNA profiles that predict clinical phenotype and regional gene expression. Genes Chromosomes Cancer. 2007;46(10):936–949. doi: 10.1002/gcc.20477. [DOI] [PubMed] [Google Scholar]
- Schleiermacher G, Janoueix-Lerosey I, Ribeiro A, Klijanienko J, Couturier J, Pierron G, Mosseri V, Valent A, Auger N, Plantaz D. Accumulation of segmental alterations determines progression in neuroblastoma. J Clin Oncol. 2010;28(19):3122–3130. doi: 10.1200/JCO.2009.26.7955. [DOI] [PubMed] [Google Scholar]
- Hedborg F, Lindgren PG, Johansson I, Kogner P, Samuelsson BO, Bekassy AN, Olsen L, Kreuger A, Pahlman S. N-myc gene amplification in neuroblastoma: a clinical approach using ultrasound guided cutting needle biopsies collected at diagnosis. Med Pediatr Oncol. 1992;20(4):292–300. doi: 10.1002/mpo.2950200405. [DOI] [PubMed] [Google Scholar]
- Caren H, Kryh H, Nethander M, Sjoberg RM, Trager C, Nilsson S, Abrahamsson J, Kogner P, Martinsson T. High-risk neuroblastoma tumors with 11q-deletion display a poor prognostic, chromosome instability phenotype with later onset. Proc Natl Acad Sci U S A. 2010;107(9):4323–4328. doi: 10.1073/pnas.0910684107. [DOI] [PMC free article] [PubMed] [Google Scholar]
- Diaz De Stahl T, Sandgren J, Piotrowski A, Nord H, Andersson R, Menzel U, Bogdan A, Thuresson AC, Poplawski A, Von Tell D. Profiling of copy number variations (CNVs) in healthy individuals from three ethnic groups using a human genome 32 K BAC-clone-based array. Hum Mutat. 2008;29(3):398–408. doi: 10.1002/humu.20659. [DOI] [PubMed] [Google Scholar]
- Sambrook JFE, Maniatis T. Molecular Cloning; a Laboratory Manual. Cold Spring Harbor, NY: Cold Spring Harbor Laboratory Press; 1989. [Google Scholar]
- Ameur A, Yankovski V, Enroth S, Spjuth O, Komorowski J. The LCB data warehouse. Bioinformatics. 2006;22(8):1024–1026. doi: 10.1093/bioinformatics/btl036. [DOI] [PubMed] [Google Scholar]
- Andersson R, Bruder CE, Piotrowski A, Menzel U, Nord H, Sandgren J, Hvidsten TR, Diaz de Stahl T, Dumanski JP, Komorowski J. A segmental maximum a posteriori approach to genome-wide copy number profiling. Bioinformatics. 2008;24(6):751–758. doi: 10.1093/bioinformatics/btn003. [DOI] [PubMed] [Google Scholar]
- Yang YH, Dudoit S, Luu P, Lin DM, Peng V, Ngai J, Speed TP. Normalization for cDNA microarray data: a robust composite method addressing single and multiple slide systematic variation. Nucleic Acids Res. 2002;30(4):e15. doi: 10.1093/nar/30.4.e15. [DOI] [PMC free article] [PubMed] [Google Scholar]
- Caren H, Erichsen J, Olsson L, Enerback C, Sjoberg RM, Abrahamsson J, Kogner P, Martinsson T. High-resolution array copy number analyses for detection of deletion, gain, amplification and copy-neutral LOH in primary neuroblastoma tumors: four cases of homozygous deletions of the CDKN2A gene. BMC Genomics. 2008;9:353. doi: 10.1186/1471-2164-9-353. [DOI] [PMC free article] [PubMed] [Google Scholar]
- Lastowska M, Viprey V, Santibanez-Koref M, Wappler I, Peters H, Cullinane C, Roberts P, Hall AG, Tweddle DA, Pearson AD. Identification of candidate genes involved in neuroblastoma progression by combining genomic and expression microarrays with survival data. Oncogene. 2007;26(53):7432–7444. doi: 10.1038/sj.onc.1210552. [DOI] [PubMed] [Google Scholar]
- Smyth GK. Linear models and empirical bayes methods for assessing differential expression in microarray experiments. Stat Appl Genet Mol Biol. 2004;3:Article3. doi: 10.2202/1544-6115.1027. [DOI] [PubMed] [Google Scholar]
- Benjamini YHY. Controlling the false discovery rate: a practical and powerful approach to multiple testing. J R Stat Soc. 1995. pp. 289–300.
- Vandesompele J, Baudis M, De Preter K, Van Roy N, Ambros P, Bown N, Brinkschmidt C, Christiansen H, Combaret V, Lastowska M. Unequivocal delineation of clinicogenetic subgroups and development of a new model for improved outcome prediction in neuroblastoma. Journal of clinical oncology : official journal of the American Society of Clinical Oncology. 2005;23(10):2280–2299. doi: 10.1200/JCO.2005.06.104. [DOI] [PubMed] [Google Scholar]
- Molenaar JJ, Koster J, Zwijnenburg DA, van Sluis P, Valentijn LJ, van der Ploeg I, Hamdi M, van Nes J, Westerman BA, van Arkel J. Sequencing of neuroblastoma identifies chromothripsis and defects in neuritogenesis genes. Nature. 2012;483(7391):589–593. doi: 10.1038/nature10910. [DOI] [PubMed] [Google Scholar]
- Hanahan D, Weinberg RA. Hallmarks of cancer: the next generation. Cell. 2011;144(5):646–674. doi: 10.1016/j.cell.2011.02.013. [DOI] [PubMed] [Google Scholar]
- Fischer M, Bauer T, Oberthur A, Hero B, Theissen J, Ehrich M, Spitz R, Eils R, Westermann F, Brors B. Integrated genomic profiling identifies two distinct molecular subtypes with divergent outcome in neuroblastoma with loss of chromosome 11q. Oncogene. 2010;29(6):865–875. doi: 10.1038/onc.2009.390. [DOI] [PubMed] [Google Scholar]
- Buckley PG, Alcock L, Bryan K, Bray I, Schulte JH, Schramm A, Eggert A, Mestdagh P, De Preter K, Vandesompele J. Chromosomal and microRNA expression patterns reveal biologically distinct subgroups of 11q- neuroblastoma. Clin Cancer Res. 2010;16(11):2971–2978. doi: 10.1158/1078-0432.CCR-09-3215. [DOI] [PMC free article] [PubMed] [Google Scholar]
- Chen QR, Bilke S, Wei JS, Whiteford CC, Cenacchi N, Krasnoselsky AL, Greer BT, Son CG, Westermann F, Berthold F. cDNA array-CGH profiling identifies genomic alterations specific to stage and MYCN-amplification in neuroblastoma. BMC Genomics. 2004;5:70. doi: 10.1186/1471-2164-5-70. [DOI] [PMC free article] [PubMed] [Google Scholar]
- Carr J, Bown NP, Case MC, Hall AG, Lunec J, Tweddle DA. High-resolution analysis of allelic imbalance in neuroblastoma cell lines by single nucleotide polymorphism arrays. Cancer Genet Cytogenet. 2007;172(2):127–138. doi: 10.1016/j.cancergencyto.2006.08.012. [DOI] [PubMed] [Google Scholar]
- Corvi R, Savelyeva L, Amler L, Handgretinger R, Schwab M. Cytogenetic evolution of MYCN and MDM2 amplification in the neuroblastoma LS tumour and its cell line. Eur J Cancer. 1995;31A(4):520–523. doi: 10.1016/0959-8049(95)00031-d. [DOI] [PubMed] [Google Scholar]
- Rudolph G, Schilbach-Stuckle K, Handgretinger R, Kaiser P, Hameister H. Cytogenetic and molecular characterization of a newly established neuroblastoma cell line LS. Hum Genet. 1991;86(6):562–566. doi: 10.1007/BF00201542. [DOI] [PubMed] [Google Scholar]
- Su WT, Alaminos M, Mora J, Cheung NK, La Quaglia MP, Gerald WL. Positional gene expression analysis identifies 12q overexpression and amplification in a subset of neuroblastomas. Cancer Genet Cytogenet. 2004;154(2):131–137. doi: 10.1016/j.cancergencyto.2004.02.009. [DOI] [PubMed] [Google Scholar]
- Amati B, Littlewood TD, Evan GI, Land H. The c-Myc protein induces cell cycle progression and apoptosis through dimerization with Max. EMBO J. 1993;12(13):5083–5087. doi: 10.1002/j.1460-2075.1993.tb06202.x. [DOI] [PMC free article] [PubMed] [Google Scholar]
Associated Data
This section collects any data citations, data availability statements, or supplementary materials included in this article.
Supplementary Materials
Schematic representation of genetic profiles for neuroblastoma samples included in the study (n=34). Deleted and gained regions are represented by red and green bars, respectively. Cases are arranged according to genetic subgroup.
Novel amplicons in association with MNA on 2p: 32K whole-genome array data are shown from: (A) the primary tumor of case ID55; (B) cell line U2715, which was established from this tumor.