

Abstract
The normal gene expression profiles of the tissues in the eye are a valuable resource for considering genes likely to be involved with disease processes. We profiled gene expression in ten ocular tissues from human donor eyes using Affymetrix Human Exon 1.0 ST arrays. Ten different tissues were obtained from six different individuals and RNA was pooled. The tissues included: retina, optic nerve head (ONH), optic nerve (ON), ciliary body (CB), trabecular meshwork (TM), sclera, lens, cornea, choroid/retinal pigment epithelium (RPE) and iris. Expression values were compared with publically available Expressed Sequence Tag (EST) and RNA-sequencing resources. Known tissue-specific genes were examined and they demonstrated correspondence of expression with the representative ocular tissues. The estimated gene and exon level abundances are available online at the Ocular Tissue Database.
1 INTRODUCTION
The expression profile of genes in healthy ocular tissues is useful to better understand which genes are important for healthy ocular tissue function. These genes also provide insight to possible disease processes. A number of variations have been mapped to genes that cause a range of inherited eye diseases including age-related macular degeneration (AMD), (Hageman et al., 2005; Haines et al., 2005; Jakobsdottir et al., 2005; Klein et al., 2005) retinitis pigmentosa (RP), (Hartong et al., 2006; Wright et al., 2010) Leber’s Congential Amarosis (LCA), (den Hollander et al., 2007; den Hollander et al., 2006; den Hollander et al., 1999; Dryja et al., 2001) and Bardet-Beidel Syndrome (BBS). (Sheffield, 2010) In contrast, only a small percentage of the genetic variations causing disorders such as glaucoma and AMD have been mapped to specific variations in a number of genes. There are a number of possible explanations for this, which include: unmapped tissue-specific transcripts containing novel exons (the MAK (Tucker et al., 2011) gene, for example), multiple private mutations across multiple different genes between individuals, defects in the regulation and control mechanisms of gene expression, or the difficulty in identifying the contribution of variations in multiple genes for multifactorial diseases. There also exist examples where multiple genes have been implicated to cause a disease; BBS has 15 distinct genes with disease causing variants, but the genes implicated for BBS have largely demonstrated a Mendelian pattern of inheritance. A list of retinal disease genes is maintained by RetNet (https://sph.uth.edu/retnet/). Given both simple and complex patterns of inheritance, identifying typical expression estimates from the genes and pathways in healthy ocular tissues may be valuable for identifying the genes involved with ocular diseases.
As a tool for profiling expression, microarrays have the limitation of probe affinity bias, (Li and Wong, 2001) but are useful for comparing global transcript expression across multiple samples. Microarrays are traditionally used to profile expression as a confirmatory resource and to prioritize candidate disease genes for disease gene mapping studies. We compare our ocular tissue gene expression data with public data collections, including the EST sequencing-based data at the NEIBank (Wistow et al., 2008) site (http://neibank.nei.nih.gov/index.shtml) and RNA-sequencing available from the Sequence Read Archive (http://www.ncbi.nlm.nih.gov/sra/).
Other studies exist for surveying expression across tissues with EST sequencing (NEIBank), with microarrays in model organisms (Farkas et al., 2004; Ivanov et al., 2006; Wang et al., 2007; Yang et al., 2007) and in single tissues with Serial Analysis of Gene Expression (SAGE).. (Liu et al., 2011; Sharon et al., 2002) Here we report on the expression profiling from ten human ocular tissues and make the Ocular Tissue Database (OTDB) publicly available at https://genome.uiowa.edu/otdb/.
2 MATERIALS AND METHODS
2.1 Tissue Procurement and RNA Extraction
Human donor eyes (20 normal donors) were obtained from the Lions Eye Institute for Transplant and Research (Tampa, FL) and stored in RNALater (Invitrogen) at 4 °C for up to 30 d. Cornea, iris, ciliary body (CB), trabecular meshwork (TM), lens, retina, choroid/retinal pigment epithelia (RPE), sclera, optic nerve (ON), and optic nerve head (ONH) tissues were microscopically dissected and stored at −80 °C. Care was taken to carefully microdissect each tissue; however, it is still possible that there were minor amounts of contamination with other ocular tissues in some of the dissected tissues. Total RNA was extracted using Trizol Plus RNA Purification kits (Invitrogen) as previously described by Wang W-H, et al. (Wang et al., 2001). RNA quality was evaluated using an Agilent Bioanalyzer 2100 RNA 6000 Nano Assay. The postmortem to RNALater time was 4–6 hours for each eye. Only RNA samples with RNA integrity numbers (RIN) (Schroeder et al., 2006) greater than 6 were selected for further analysis. RNA integrity numbers are based on electrophoretic analysis of each RNA sample, examining 28S and 18S ribosomal RNA intensity peaks as well as amounts of RNA degradation products to provide an accurate prediction of RNA integrity. RNA concentrations were determined spectrophotometrically using a Nano-Drop ND-1000 spectrophotometer. For each tissue, RNA was pooled from 6 individuals. For particularly small tissues such as the TM and ONH, this was essential to obtain enough RNA for the analysis. We used this pooling on the more abundant tissues as well so that relative abundance across tissues would be represented similarly. The pooling strategy also allows “normalization” of any variability between individuals. Pooled RNA from each tissue type was processed for hybridization to Affymetrix microarrays according to manufacturer’s instructions.
2.2 DNA Microarray Sample Processing
Microarray hybridizations were performed at the University of Iowa DNA Facility. Briefly, 50 nanograms total RNA were converted to SPIA amplified cDNA using the WT-Ovation Pico RNA Amplification System, v1 (NuGEN Technologies, San Carlos, CA, Cat. #3300) according to the manufacturer’s recommended protocol. The amplified SPIA cDNA product was purified through a QIAGEN MinElute Reaction Cleanup column (QIAGEN Cat #28204) according to modifications from NuGEN. Four micrograms of SPIA amplified DNA was then used to generate ST-cDNA using the WT-Ovation Exon Module v1 (NuGEN Technologies, Cat #2000) and again purified with the Qiagen column as above. Five micrograms of this product was fragmented (average fragment size = 85 bases) and biotin labeled using the NuGEN FL-Ovation cDNA Biotin Module, v2 (NuGEN Technologies, Cat. #4200) per the manufacturer’s recommended protocol. The resulting biotin-labeled cDNA was mixed with Affymetrix eukaryotic hybridization buffer (Affymetrix, Inc., Santa Clara, CA), placed onto Affymetrix Human Exon 1.0 ST Arrays, and incubated at 45 °C for 18 h with 60 rpm rotation in an Affymetrix Model 640 Genechip Hybridization Oven. The human exon 1.0 ST Array interrogates over 1 million exon clusters within the known and predicted transcribed regions of the entire genome. Following hybridization, the arrays were washed, stained with streptavidin-phycoerythrin (Molecular Probes, Inc., Eugene, OR), and signal amplified with antistreptavidin antibody (Vector Laboratories, Inc., Burlingame, CA) using the Affymetrix Model 450 Fluidics Station. Arrays were scanned with the Affymetrix Model 3000 scanner with 7G upgrade and data collected using the GeneChip operating software (GCOS) v1.4.
2.3 Microarrays, Normalization and Background
The Affymetrix GeneChip Human Exon 1.0 ST (HuEx 1.0) microarray consists of 1.4 million probe sets, with approximately four probes per exon and approximately 40 probes per gene (http://www.affymetrix.com/estore/browse/products.jsp?productId=131452#1_1). There are 289,961 probe sets supported by full-length mRNA, 306,583 probe sets supported by Ensembl transcripts, 665,175 probe sets supported by ESTs, and 883,105 probe sets supported by gene prediction. The probe sets are commonly grouped into a “Core” set (18,708 transcripts based on RefSeq mRNAs), “Extended” (147,476 transcripts that extends the “Core” group by adding EST sequences), and the “Full” probe set (297,051 total transcripts which includes the “Core” set plus the “Extended” set plus probes selected by computational gene prediction.) Each GC-content bin (0–25 GC cotent/probe) has up to 1000 non-specific background probes that are used to establish a level of background hybridization, meaning that these probe sets are used as a negative control by the Affymetrix Power Tools analysis software. A probe set specific to an exon would need to have significantly better hybridization signal than the background probes to be considered “detected above background” (or DABG). This platform was selected because it allows for the examination of gene-level expression (averaged across all probes for a transcript) and exon-level differences. This platform also provides good measurement of expression across the whole transcriptome with an overall lower cost than RNA-seq for the number of samples that were used.
Ten Affymetrix GeneChip Human Exon 1.0 ST (HuEx 1.0) microarrays were simultaneously normalized using the Affymetrix Power Tools (APT) probe set summarization tool. Normalization was done at both the probe set and metaprobe set level using the Probe Logarithmic Intensity Error (PLIER -- http://media.affymetrix.com/support/technical/technotes/plier_technote.pdf) method with GC-background correction (http://media.affymetrix.com/support/technical/whitepapers/exon_background_correction_whitepaper.pdf). The analyses were performed in parallel for both the “Core” and “Extended” Affymetrix probe sets. Using the same procedure, gene-level “Core” probe set analyses were performed on both a publicly available GeneChip Human Gene 1.0 ST (HuGe 1.0) dataset from human iris RNA (Gene Expression Omnibus [GEO], accessions GSM572769, GSM572770, GSM572771) and publicly available HuEx 1.0 datasets in the ENCODE RPE cell line (GEO, accessions GSM510514 and GSM510515). Probe set-level detection above background (DABG) estimates were calculated using APT with antigenomic control probes. These estimates were calculated on a chip-by-chip basis, and are applicable to all probe set classification levels (“Core” and “Extended”). DABG p-values are associated with a “not different from background” null hypothesis, such that a p-value of 0 supports the hypothesis that a probe set is measuring expression above background.
2.4 Comparison With Other Data Sources
Gene expression estimates from the corresponding OTDB microarray experiments were compared against publicly available datasets in a human RPE cell line (intraplatform) and human iris samples (interplatform). Intraplatform correlation was performed via matching on transcript cluster identifiers. Interplatform correlation was performed via matching on unique gene symbol identifiers. For both analyses, both a Kendall’s Tau rank correlation coefficient and a Pearson’s product-moment correlation coefficient were estimated using the R stats package “cor” function.
Additionally, both Core and Extended gene expression estimates from the OTDB retina microarray were compared against a publicly available RNA-seq dataset from human retina (sequence read archive [SRA] study SRP002881) by gene symbol matching. This RNA-seq dataset was also compared against the retina EST dataset from the NEIBank project (available online at: http://neibank.nei.nih.gov/cgi-bin/showDataTable.cgi?lib=NbLib0042). Datasets were matched by gene symbol for comparison. For each of these comparisons Kendall’s Tau rank correlation coefficient was calculated as above.
2.5 OTDB Tissue Profile
The PLIER estimated values for expression from the microarrays were log transformed and then a z-score was calculated for each gene. These z-scores were calculated for the expression of each gene (in each tissue -- retina, ONH, ON, CB, TM, sclera, lens, cornea, choroid/RPE and iris) against the distribution of the gene expression in the other tissues. These scores were then ranked within each tissue, and the top 100 genes by z-score for each tissue were selected to be represented (see Figure 1). We selected the top 20 genes from these rankings and provided their gene symbols in Table 1. Additionally, we selected the top 20 genes by expression level and provided their gene symbols by Table 2. Table 3 shows the expression values of tissue-specific representative genes. (Moll et al., 1982; Piatigorsky, 1989; Takanosu et al., 2001);(Liton et al., 2005; Thomson et al., 2005) We also performed a Principal Component Analysis (PCA). (Abdi and Williams, 2010) The expression values from the ten microarray experiments were analyzed by PCA for visualization. The resultant figure (Supplemental figure S1) plots the datasets as single representative points along two axes that maximizes the variability in a two dimensional plane. The distances between points show relative similarity and/or difference between datasets.
Figure 1.

A heatmap of the top 100 genes in each tissue (1000 genes total), based on z-scores (tissues are labeled on the x-axis, and genes are the y-axis). The scale associating the color with the z-score for any given gene is shown on the right. A measure of similarity between tissues is reflected in the degree of positive scores on the off-diagonal. This similarity is most clearly illustrated between the optic nerve and the optic nerve head.
Table 1.
Top 20 genes by Z-score in each tissue.
| Lens | Iris | CB | TM | Cornea | Retina | RPE/Choroid | Sclera | ONH | ON |
|---|---|---|---|---|---|---|---|---|---|
| CRYBA2 | GSTA3 | BCL2A1 | ATP2A1 | KRT3 | MPP4 | TMEM27 | COMP | MYL1 | MT3 |
| CRYBA4 | AREG | AOC2 | CNN1 | DSG1 | USH2A | S100A12 | TCAP | VARS | LGR5 |
| LCTL | CHST9 | TMEM20 | MYOCD | KRT5 | OVCH2 | MMP8 | DPT | PIGK | PTPN4 |
| BFSP2 | C21orf94 | PTPRN | VCL | KRT24 | SAMD7 | PITPNA | MSC | ROCK2 | PRM1 |
| CRYBB2 | HPDL | NDUFAF3 | MYL9 | POF1B | ZNF385B | BCMO1 | SCGB3A2 | ORAI2 | TTYH2 |
| C13orf38 | GALNTL5 | PDE11A | INPP4A | SCEL | ATP1A3 | CXCL9 | PTGIS | NUCKS1 | TMSB4X |
| AMDHD1 | CITED1 | SGMS2 | MRVI1 | ALDH3A1 | RPGRIP1 | SLC26A7 | SLC13A5 | ESM1 | GALNT9 |
| CRYBA1 | DLST | CHRDL2 | SEC23A | DSC3 | SLC24A1 | FAM150B | XPNPEP2 | DUSP18 | GABRG1 |
| CRYBB1 | METTL6 | CHPF2 | CASQ2 | UPK1B | CDHR1 | NETO2 | CCL22 | SSR1 | TAS2R39 |
| LGSN | C6orf124 | FOXC1 | TAGLN | KERA | GNAT2 | BEST1 | AURKC | FPGT | APOC2 |
| BFSP1 | SLC45A2 | TAS2R5 | MYOM1 | MACC1 | ANO2 | GPAM | TSPYL6 | SKIL | INSL3 |
| CRYBB3 | TMEM161B | SLC13A4 | CBLN2 | DSG3 | PPEF2 | MYH7B | RPL13P5 | ERLEC1 | ZNF501 |
| CPB1 | RP9 | RHAG | ST5 | MAL2 | MYO3B | SLC22A8 | NLRC5 | TRAF3IP1 | EPHB6 |
| CRYAA | GPR180 | RFX8 | PKD2L2 | SPINK5 | MCF2L2 | PI3 | SLC43A3 | PDZK1IP1 | OR51D1 |
| SOHLH2 | MNAT1 | SPATA5L1 | SIVA1 | ESRP1 | CNGB1 | EGFL6 | SCUBE1 | LHCGR | LANCL3 |
| MED12L | C1orf129 | TEKT2 | ZNF266 | KRT12 | MAK | PRR14 | ARMC4 | CCDC30 | ZNF189 |
| IDO1 | RASSF9 | CD244 | DGKI | SERPINB5 | PDE6C | C13orf33 | DNAJC22 | NUF2 | C2orf62 |
| MIP | FAM92A1 | OPTC | CTPS | TUFT1 | OPN1LW | CPA3 | NXF5 | CTBP1 | FAM125B |
| HSPA6 | PPIL5 | LRRC47 | ACTG2 | ADH7 | RS1 | CCL26 | ITGAL | MYH13 | ANO3 |
| OR4A16 | LOC100130232 | FAM50B | REPS2 | TMPRSS11D | HCN1 | SGMS1 | AUTS2 | DEPDC1 | ITIH2 |
Table 2.
Top 20 genes by PLIER expression estimates in each tissue.
| Lens | Iris | CB | TM | Cornea | Retina | RPE/Choroid | Sclera | ONH | ON |
|---|---|---|---|---|---|---|---|---|---|
| CRYBA4 | RPS24 | PCP4 | ACTA2 | KRT3 | PDE6H | RPS24 | PLA2G2A | RPS24 | RPS24 |
| CRYAA | PCP4 | RPS24 | RPS24 | KRT24 | RCVRN | TTR | RPS24 | PLP1 | PLP1 |
| CRYBA2 | APOD | ND5 | PCP4 | KRT5 | SAG | ND5 | UBA52 | SBDS | S100B |
| BFSP1 | ND5 | ND4 | RGS2 | KERA | RPS24 | ND4 | RPS20 | CLU | HEPN1 |
| LCTL | ND4 | COX6C | UBA52 | KRT12 | ND5 | COX6C | SLPI | SPARCL1 | ND5 |
| UBA52 | COX6C | ND6 | ND5 | MAL2 | ND4 | MALAT1 | HSP90AB1 | EIF4A2 | ND4 |
| BFSP2 | SHFM1 | NDUFA1 | HSP90AB1 | RPS24 | MALAT1 | PCP4 | CD63 | MALAT1 | MALAT1 |
| CRYBB1 | ND6 | MALAT1 | MYH11 | DSG1 | MYL6 | UBA52 | UBC | ND5 | FDXACB1 |
| CRYBA1 | THYN1 | S100A13 | MYL6 | ALDH3A1 | RHO | ND6 | ANGPTL7 | ND4 | CLU |
| RPS24 | SBDS | UBA52 | MALAT1 | KRT14 | ND6 | SBDS | NUPR1 | CD63 | TUBB4 |
| CARHSP1 | ATP5I | MYL6 | APOD | APOD | PCP4 | NDUFA1 | MALAT1 | HSP90AB1 | UBA52 |
| CSDA | FDXACB1 | THYN1 | ND4 | UBA52 | COX3 | MYL6 | S100A13 | TMSB10 | SBDS |
| FDXACB1 | NDUFA1 | APOD | TPM1 | DSC3 | NDUFA1 | NAMPT | ND5 | FDXACB1 | COX3 |
| LUZP6 | RPS20 | RPS20 | RPS20 | ND4 | PPEF2 | CD63 | APOD | CLDND1 | AQP4 |
| UBC | S100A13 | UBB | UBC | ND5 | CPLX4 | FDXACB1 | ND4 | S100B | MYL6 |
| RPL30 | MALAT1 | TMEM14B | CD63 | NQO1 | HCN1 | MGP | PTN | UBB | UBB |
| MMD | SEC61G | CD63 | RPS6 | MALAT1 | HSP90AA1 | SHFM1 | CHMP2A | S100A13 | ND6 |
| RPS20 | CALM2 | SHFM1 | MYL9 | CLU | SNAP91 | UBB | RPS6 | HNRNPA2B1 | HSP90AB1 |
| CRYGS | GJA1 | SEC61G | NDUFA1 | PERP | HSP90AB1 | CALM2 | TMSB10 | UBA52 | UBC |
| TMSB10 | SKP1 | YWHAE | CHMP2A | SCEL | YWHAE | COX3 | MYL6 | ND6 | CD63 |
Table 3.
Tissue Specific Reference Genes.
| Gene | Choroid | CB | Cornea | Iris | Lens | ON | ONH | Retina | Sclera | TM | Reference Tissue |
|---|---|---|---|---|---|---|---|---|---|---|---|
| RPE65 | 734.79 | 17.67 | 8.17 | 14.47 | 17.79 | 46.21 | 101.66 | 40.77 | 28.45 | 8.33 | Choroid/RPE |
| OPTC | 38.02 | 239.47 | 39.08 | 102.74 | 69.06 | 37.84 | 34.64 | 34.77 | 45.93 | 43.69 | CB/Iris |
| KRT12 | 22.58 | 21.92 | 5395.61 | 14.04 | 12.55 | 18.5 | 15.85 | 23.17 | 31.93 | 13.01 | Cornea |
| QPCT | 194.78 | 97.76 | 23.31 | 561.12 | 7.04 | 8.87 | 27.07 | 34.44 | 28.97 | 66.7 | Iris |
| CRYBA1 | 18.35 | 21.24 | 19.34 | 13.13 | 3635.98 | 21.53 | 11.58 | 11.76 | 12.26 | 14.07 | Lens |
| PLP1 | 44.08 | 43.32 | 30.84 | 40.45 | 27.09 | 2656.6 | 2159.08 | 33.84 | 51.09 | 82.97 | ON/ONH |
| SLC14A1 | 14.71 | 10.8 | 11.29 | 5.12 | 10.12 | 1194.97 | 674.66 | 9.68 | 11.75 | 12.01 | ON/ONH |
| RHO | 105.73 | 24.72 | 23.74 | 32.15 | 69.14 | 27.02 | 51.51 | 1466.11 | 67.97 | 49.94 | Retina |
| MYOC | 45.13 | 242.1 | 134.77 | 319.6 | 16.28 | 11.08 | 41.83 | 2.92 | 1006.33 | 1575.32 | TM/Sclera |
| CHI3L1 | 128.01 | 138.82 | 35.8 | 28.29 | 15.82 | 24.65 | 48.09 | 44.17 | 740.75 | 776.56 | TM/Sclera |
2.6 OTDB Web Interface and Web Services
We extracted probe-level information from Affymetrix annotation files and joined it with experimental data to construct a database for both gene and transcript level information for the ten ocular tissues. A RESTful (Richardson and Ruby, 2007) API was built using this database that allows for flexible data representation. An instance is the public web-based interface to the data is available at https://genome.uiowa.edu/otdb/. Raw intensity files are available in .CEL format at https://genome.uiowa.edu/otdb/cel. These data have been submitted to GEO (GEO series accession number GSE41102).
3 RESULTS
To best identify genes that are specific to each tissue, we used gc-binned background subtraction coupled to PLIER normalization, followed by calculation of the z-score for each gene in each tissue (compared to the same gene in other tissues, see methods). These scores give us a metric of expression specificity, which may be useful in identifying genes that correspond to an abnormal phenotype in a specific tissue. We ranked the genes in each tissue by z-score and selected the top 100 from each tissue to generate the rows in a heatmap (Figure 1). The heatmap effectively illustrates how well the different tissues separate from one another by measuring z-score. Of particular interest are the rows based on the top 100 from ON and ONH. These two tissues are physiologically very similar, which is reflected by very positive z-scores in both tissues in the aforementioned rows. We also manually reviewed the top 20 genes ranked by z-score (Table 1) and by estimated expression level. We found many genes that are known to be specifically and/or highly expressed in their respective tissues from previously published research. For example, the RHO gene is highly expressed in the retina with a PLIER normalized level of expression value of ~1466. Other examples include the MYOC gene in TM with a value of ~1575 and the RPE65 gene expressed at a level of ~735 in the choroid/RPE.
We compared the microarray expression estimates from retinal tissue against an RNA-seq experiment in retinal tissue. Expression estimates from the NEIBank, a currently existing profile of expression in ocular tissues, were also compared against the RNA-seq experiment. A Kendall’s Tau test for correlation determined that the microarray data and the NEIBank are correlated with the RNA-seq experiment to nearly the same degree (Figure 2A). However, when comparing the number of unique HUGO Gene Nomenclature Committee (HGNC) genes represented by each set, there is a clear difference between the datasets, with the microarray experiments representing a much larger set of genes (Figure 2B).
Figure 2.

(A): Correlation estimates (p<0.001) from pairwise comparison of genes from the OTDB and NEIBank with a retina RNA-seq experiment obtained from GEO (accession GSE22765). Here we observe similarities in correlation between the three profiles compared to RNA-seq of the retina. (B): Number of unique HGNC genes with expression data by each source. Thousands of genes that are not represented in the NEIbank data are profiled by the Affymetrix arrays. The Affymetrix human exon array has probe sets that are grouped by annotation into “Core,” “Extended,” and “Full.” Core describes probe sets that have evidence from RefSeq and full-length mRNAs. Extended describes probe sets that are supported by other cDNA evidence beyond that data used for Core probe sets. Full (data not shown) describes probe sets using evidence from computationally derived gene prediction. Therefore, “OTDB Ext” shows the correlation estimates using the Extended probe sets, and “OTDB Core” shows the correlation estimates using the Core probe sets.
To examine reproducibility of experimental results from multiple publicly available sources, we compared the expression profile of the OTDB iris microarray to that of a human gene chip microarray experiment (Figure 3A), and the expression profile of the OTDB retinal pigment epithelium to another human exon array (Figure 3B). Both of these resulted in noisy correlations—an indication of the variability that occurs between multiple experiments in the same tissue, even when the platform on which they were run is controlled. The differences and scatter in Figure 3B may be influenced by comparison of gene expression between isolated RPE cells (x-axis) with choroid/RPE tissue (y-axis). This global comparison shows that even on the same platform there is substantial variation in the data.
Figure 3.
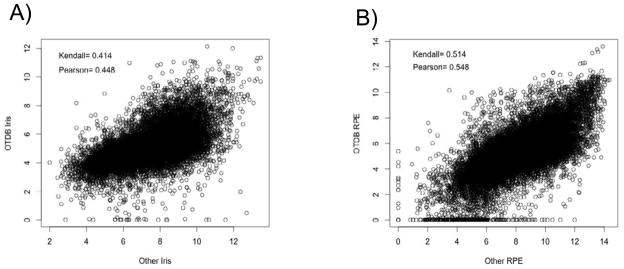
(A): An example pairwise correlation between the OTDB iris and a Human Gene array in iris. (B): Pairwise correlation between the OTDB RPE and Human Exon array in an RPE cell line. This figure illustrates the variability between independent GeneChip experiments. In this context, a single experiment involving ten tissues of the eye provides an excellent resource for studies involving multiple eye tissues.
To make the OTDB easily accessible for browsing, we implemented a web interface to the database. Transcript and exon level expression estimates can be queried by Refseq accession number, Ensembl accession number, Affymetrix transcript cluster identifier (ID), or HGNC gene symbol. The query page allows for a query on all tissues, or a user-selectable subset. Additionally, there is an option to query for a sorted list of all genes in a single tissue by expression estimate. Queries for a single gene display an alternate splicing graph for rapid identification of differential splicing patterns between tissues (Figure 4A). Expression of a gene in a tissue reveals information regarding the probe set-level expression estimates, genomic coordinates, and accessions for each associated probe set (Figure 4B).
Figure 4.

(A): Expression level estimates and probe set estimate graphs for a given gene in each of ten ocular tissues. (*1) Queries can be by Gene Symbol, mRNA accession, Affymetrix transcript cluster ID, or gene description. (*2) Query entry field. (*3) A subset of all tissues may be queried. (*4) Both Core and Extended probe set group analyses are available. (*5) Query results can be exported for download. (*6) Additional information can be found for query results, including associated GO terms, pathways, and protein domains. These associated data are displayed by following their respective links. (B) Selecting a specific tissue from the query result yields detailed information about expression in that tissue. Here we show the first 3 probe sets for the MAK gene in the retina. “DABG” is the p-value for that particular probe set to be detected above background. The “PLIER” column shows the PLIER normalized value for expression.
4 DISCUSSION
The value and insight gained using the OTDB for normal eye expression data are demonstrated by reviewing highly-ranked genes in particular tissues. For example, the rhodopsin (RHO) gene was first sequenced by Nathans and Hodges. (Nathans and Hogness, 1984) Opsin is covalently bound to 11-cis-retinal and is part of the makeup of light-absorbing pigments within the outer segment of the photoreceptor. The absorption of a photon by this complex causes the 11-cis conformation of retinal to isomerize to the all-trans form, thus initiating the visual cascade (Nathans et al., 1986). Variations in RHO have been demonstrated to cause upwards of 30% of autosomal dominant RP. (Dryja et al., 1991) Within the OTDB, RHO is in the top 99.9% of genes in the retina. The PLIER normalized level of expression of RHO in the retina is ~1466, with the next highest tissue being choroid with an expression value of ~105 suggesting that RHO is most prevalent within the retina relative to the other 9 ocular tissues.
In another example, myocilin (MYOC) is the glucocorticoid-inducible response protein in the trabecular meshwork. (Polansky et al., 1997; Shepard et al., 2001) Mutations in MYOC have been show to cause primary open angle glaucoma (Stone et al., 1997) possibly through misregulation of intraocular pressure within the trabecular meshwork. Previous work by Fingert et al. showed that MYOC is widely expressed in other tissues in addition to other structures of the eye. (Fingert et al., 1998) More recently, expression of genes in the TM has been characterized by Lui et al. using serial analysis of gene expression (SAGE). (Liu et al., 2011) Their data showed that the MYOC SAGE tag was observed as 7% of all observed tags (200 tags for MYOC out of 298,834 total tags). Note that as a percentage 7% represents relatively high expression. Using the OTDB (follow the “View gene expression by tissue” link, select the “Trabecular Meshwork” tab, select “show 50 entries”, and MYOC is the 31st gene out of 21,709 Transcript Identities), we can see that MYOC is in the 99.9 percentile of all genes in the TM and has the highest expression in TM (expression value of ~1575) and is also highly expressed in sclera (~1006). Calculating the corresponding percentile for the SAGE data is problematic because we would need the total number of tags observed for all genes and substantially fewer genes are represented in the SAGE data. The next highest tissue after TM and sclera is iris with a value of 319. If we examine the individual probe values for iris by following the link behind the gene level of expression, we can see that probe 2443968 has an expression value of ~0.96 (relatively low) and a DABG p-value value of 0.49 suggesting that this probe set is not expressed significantly above background at an α = 0.05.
The retinal pigment epithelia-specific protein, 65-kD (RPE65) is a gene that has been shown to be expressed in the retinal pigment epithelium and is the enzyme that causes the conformational change of vitamin A to trans-retinol. (Moiseyev et al., 2005) In the OTDB, it is expressed in the top 99.4% of genes in the RPE/choroid. Mutations in REP65 have been shown to cause Leber’s congenital amaurosis. (Lotery et al., 2000) With the understanding of the role of RPE65 within the RPE, human gene therapy trials are being conducted. (Cideciyan et al., 2008) The OTDB shows that RPE65 has the highest expression (~734) within the RPE/choroid. Not unexpectedly, it has the lowest expression in the cornea (~8), constructed of many individual probe set values with insignificant DABG p-values. For example, probe set 2417513 has a DABG p-value of 0.44, highly suggestive that this probe set (and this transcript) is not present above a level of “background” within the cornea tissue.
We compared our data to existing RNA-seq data. Correlation analysis between RNA-seq and microarray data is problematic for a number of reasons. First, RNA-seq has a much greater dynamic range (frequent transcripts get frequent reads), but is also dependent on the depth of sequencing selected (less depth means rarer transcripts are less likely to be observed). Microarray data gets saturated at the high end (frequent transcripts) and is noisy on the low end (few transcripts). This saturation causes distortions and makes it difficult to determine the actual difference between highly expressed genes and lowly expressed genes (however performance between the “high end” and “low end” for microarrays is quite good.)
Our expression study examined 10 ocular tissues, each of which is composed of numerous different cell types. The retina alone has many different cell types and each one is likely to have distinctly different expression patterns. These examples demonstrate the value of measuring expression with microarrays in ten different tissues from the eye. Although some genes (when mutated) cause specific ophthalmic diseases (e.g. RP or cataracts) and are expressed almost exclusively in the affected tissues, other genes are broadly expressed, such as SNRNP200 (Benaglio et al., 2011) (a splicing factor) that causes RP and FYCO1 (Chen et al., 2011) that has been shown to cause cataracts. We anticipate that this will be a valuable resource and may be used for discovery, prioritization efforts, hypothesis generation and confirmation of the expression of genes across the ten ocular tissues.
Supplementary Material
Supplemental Figure S1. A 2-coordinate principle component analysis (PCA) of the ten profiled tissues. Here we see the degree of similarity between samples demonstrating overall differences in gene expression between tissues.
Highlights.
We performed exon-level expression profiling in ten normal human ocular tissues.
Expression was measured with Affymetrix Human Exon 1.0 ST arrays.
We show correlation of expression results using other expression platforms.
Expression values are available at: https://genome.uiowa.edu/otdb/
Acknowledgments
5 FUNDING
National Institutes of Health [NIGMS Bioinformatics Award T32GM082729]
Footnotes
Publisher's Disclaimer: This is a PDF file of an unedited manuscript that has been accepted for publication. As a service to our customers we are providing this early version of the manuscript. The manuscript will undergo copyediting, typesetting, and review of the resulting proof before it is published in its final citable form. Please note that during the production process errors may be discovered which could affect the content, and all legal disclaimers that apply to the journal pertain.
References
- Abdi H, Williams LJ. Principal component analysis. Wiley Interdisciplinary Reviews: Computational Statistics. 2010;2:433–459. [Google Scholar]
- Benaglio P, McGee TL, Capelli LP, Harper S, Berson EL, Rivolta C. Next generation sequencing of pooled samples reveals new SNRNP200 mutations associated with retinitis pigmentosa. Hum Mutat. 2011;32:E2246–2258. doi: 10.1002/humu.21485. [DOI] [PubMed] [Google Scholar]
- Chen J, Ma Z, Jiao X, Fariss R, Kantorow WL, Kantorow M, Pras E, Frydman M, Pras E, Riazuddin S, Riazuddin SA, Hejtmancik JF. Mutations in FYCO1 cause autosomal-recessive congenital cataracts. Am J Hum Genet. 2011;88:827–838. doi: 10.1016/j.ajhg.2011.05.008. [DOI] [PMC free article] [PubMed] [Google Scholar]
- Cideciyan AV, Aleman TS, Boye SL, Schwartz SB, Kaushal S, Roman AJ, Pang JJ, Sumaroka A, Windsor EA, Wilson JM, Flotte TR, Fishman GA, Heon E, Stone EM, Byrne BJ, Jacobson SG, Hauswirth WW. Human gene therapy for RPE65 isomerase deficiency activates the retinoid cycle of vision but with slow rod kinetics. Proceedings of the National Academy of Sciences of the United States of America. 2008;105:15112–15117. doi: 10.1073/pnas.0807027105. [DOI] [PMC free article] [PubMed] [Google Scholar]
- den Hollander AI, Koenekoop RK, Mohamed MD, Arts HH, Boldt K, Towns KV, Sedmak T, Beer M, Nagel-Wolfrum K, McKibbin M, Dharmaraj S, Lopez I, Ivings L, Williams GA, Springell K, Woods CG, Jafri H, Rashid Y, Strom TM, van der Zwaag B, Gosens I, Kersten FF, van Wijk E, Veltman JA, Zonneveld MN, van Beersum SE, Maumenee IH, Wolfrum U, Cheetham ME, Ueffing M, Cremers FP, Inglehearn CF, Roepman R. Mutations in LCA5, encoding the ciliary protein lebercilin, cause Leber congenital amaurosis. Nat Genet. 2007;39:889–895. doi: 10.1038/ng2066. [DOI] [PubMed] [Google Scholar]
- den Hollander AI, Koenekoop RK, Yzer S, Lopez I, Arends ML, Voesenek KE, Zonneveld MN, Strom TM, Meitinger T, Brunner HG, Hoyng CB, van den Born LI, Rohrschneider K, Cremers FP. Mutations in the CEP290 (NPHP6) gene are a frequent cause of Leber congenital amaurosis. Am J Hum Genet. 2006;79:556–561. doi: 10.1086/507318. [DOI] [PMC free article] [PubMed] [Google Scholar]
- den Hollander AI, ten Brink JB, de Kok YJ, van Soest S, van den Born LI, van Driel MA, van de Pol DJ, Payne AM, Bhattacharya SS, Kellner U, Hoyng CB, Westerveld A, Brunner HG, Bleeker-Wagemakers EM, Deutman AF, Heckenlively JR, Cremers FP, Bergen AA. Mutations in a human homologue of Drosophila crumbs cause retinitis pigmentosa (RP12) Nat Genet. 1999;23:217–221. doi: 10.1038/13848. [DOI] [PubMed] [Google Scholar]
- Dryja TP, Adams SM, Grimsby JL, McGee TL, Hong DH, Li T, Andreasson S, Berson EL. Null RPGRIP1 alleles in patients with Leber congenital amaurosis. Am J Hum Genet. 2001;68:1295–1298. doi: 10.1086/320113. [DOI] [PMC free article] [PubMed] [Google Scholar]
- Dryja TP, Hahn LB, Cowley GS, McGee TL, Berson EL. Mutation spectrum of the rhodopsin gene among patients with autosomal dominant retinitis pigmentosa. Proceedings of the National Academy of Sciences of the United States of America. 1991;88:9370–9374. doi: 10.1073/pnas.88.20.9370. [DOI] [PMC free article] [PubMed] [Google Scholar]
- Farkas RH, Qian J, Goldberg JL, Quigley HA, Zack DJ. Gene expression profiling of purified rat retinal ganglion cells. Invest Ophthalmol Vis Sci. 2004;45:2503–2513. doi: 10.1167/iovs.03-1391. [DOI] [PubMed] [Google Scholar]
- Fingert JH, Ying L, Swiderski RE, Nystuen AM, Arbour NC, Alward WL, Sheffield VC, Stone EM. Characterization and comparison of the human and mouse GLC1A glaucoma genes. Genome Res. 1998;8:377–384. doi: 10.1101/gr.8.4.377. [DOI] [PMC free article] [PubMed] [Google Scholar]
- Hageman GS, Anderson DH, Johnson LV, Hancox LS, Taiber AJ, Hardisty LI, Hageman JL, Stockman HA, Borchardt JD, Gehrs KM, Smith RJ, Silvestri G, Russell SR, Klaver CC, Barbazetto I, Chang S, Yannuzzi LA, Barile GR, Merriam JC, Smith RT, Olsh AK, Bergeron J, Zernant J, Merriam JE, Gold B, Dean M, Allikmets R. A common haplotype in the complement regulatory gene factor H (HF1/CFH) predisposes individuals to age-related macular degeneration. Proceedings of the National Academy of Sciences of the United States of America. 2005;102:7227–7232. doi: 10.1073/pnas.0501536102. [DOI] [PMC free article] [PubMed] [Google Scholar]
- Haines JL, Hauser MA, Schmidt S, Scott WK, Olson LM, Gallins P, Spencer KL, Kwan SY, Noureddine M, Gilbert JR, Schnetz-Boutaud N, Agarwal A, Postel EA, Pericak-Vance MA. Complement factor H variant increases the risk of age-related macular degeneration. Science. 2005;308:419–421. doi: 10.1126/science.1110359. [DOI] [PubMed] [Google Scholar]
- Hartong DT, Berson EL, Dryja TP. Retinitis pigmentosa. Lancet. 2006;368:1795–1809. doi: 10.1016/S0140-6736(06)69740-7. [DOI] [PubMed] [Google Scholar]
- Ivanov D, Dvoriantchikova G, Nathanson L, McKinnon SJ, Shestopalov VI. Microarray analysis of gene expression in adult retinal ganglion cells. FEBS letters. 2006;580:331–335. doi: 10.1016/j.febslet.2005.12.017. [DOI] [PubMed] [Google Scholar]
- Jakobsdottir J, Conley YP, Weeks DE, Mah TS, Ferrell RE, Gorin MB. Susceptibility genes for age-related maculopathy on chromosome 10q26. Am J Hum Genet. 2005;77:389–407. doi: 10.1086/444437. [DOI] [PMC free article] [PubMed] [Google Scholar]
- Klein RJ, Zeiss C, Chew EY, Tsai JY, Sackler RS, Haynes C, Henning AK, SanGiovanni JP, Mane SM, Mayne ST. Complement Factor H Polymorphism in Age-Related Macular Degeneration. Science. 2005;308:385–389. doi: 10.1126/science.1109557. [DOI] [PMC free article] [PubMed] [Google Scholar]
- Li C, Wong WH. Model-based analysis of oligonucleotide arrays: Expression index computation and outlier detection. Proceedings of the National Academy of Sciences. 2001;98:31–36. doi: 10.1073/pnas.011404098. [DOI] [PMC free article] [PubMed] [Google Scholar]
- Liton PB, Liu X, Stamer WD, Challa P, Epstein DL, Gonzalez P. Specific targeting of gene expression to a subset of human trabecular meshwork cells using the chitinase 3-like 1 promoter. Investigative ophthalmology & visual science. 2005;46:183–190. doi: 10.1167/iovs.04-0330. [DOI] [PMC free article] [PubMed] [Google Scholar]
- Liu Y, Munro D, Layfield D, Dellinger A, Walter J, Peterson K, Rickman CB, Allingham RR, Hauser MA. Serial analysis of gene expression (SAGE) in normal human trabecular meshwork. Mol Vis. 2011;17:885–893. [PMC free article] [PubMed] [Google Scholar]
- Lotery AJ, Namperumalsamy P, Jacobson SG, Weleber RG, Fishman GA, Musarella MA, Hoyt CS, Heon E, Levin A, Jan J, Lam B, Carr RE, Franklin A, Radha S, Andorf JL, Sheffield VC, Stone EM. Mutation analysis of 3 genes in patients with Leber congenital amaurosis. Arch Ophthalmol. 2000;118:538–543. doi: 10.1001/archopht.118.4.538. [DOI] [PubMed] [Google Scholar]
- Moiseyev G, Chen Y, Takahashi Y, Wu BX, Ma JX. RPE65 is the isomerohydrolase in the retinoid visual cycle. Proceedings of the National Academy of Sciences of the United States of America. 2005;102:12413–12418. doi: 10.1073/pnas.0503460102. [DOI] [PMC free article] [PubMed] [Google Scholar]
- Moll R, Franke WW, Schiller DL, Geiger B, Krepler R. The catalog of human cytokeratins: patterns of expression in normal epithelia, tumors and cultured cells. Cell. 1982;31:11–24. doi: 10.1016/0092-8674(82)90400-7. [DOI] [PubMed] [Google Scholar]
- Nathans J, Hogness DS. Isolation and nucleotide sequence of the gene encoding human rhodopsin. Proceedings of the National Academy of Sciences of the United States of America. 1984;81:4851–4855. doi: 10.1073/pnas.81.15.4851. [DOI] [PMC free article] [PubMed] [Google Scholar]
- Nathans J, Piantanida TP, Eddy RL, Shows TB, Hogness DS. Molecular genetics of inherited variation in human color vision. Science. 1986;232:203–210. doi: 10.1126/science.3485310. [DOI] [PubMed] [Google Scholar]
- Piatigorsky J. Lens crystallins and their genes: diversity and tissue-specific expression. The FASEB Journal. 1989;3:1933–1940. doi: 10.1096/fasebj.3.8.2656357. [DOI] [PubMed] [Google Scholar]
- Polansky JR, Fauss DJ, Chen P, Chen H, Lutjen-Drecoll E, Johnson D, Kurtz RM, Ma ZD, Bloom E, Nguyen TD. Cellular pharmacology and molecular biology of the trabecular meshwork inducible glucocorticoid response gene product. Ophthalmologica. Journal international d’ophtalmologie. International journal of ophthalmology. Zeitschrift fur Augenheilkunde. 1997;211:126–139. doi: 10.1159/000310780. [DOI] [PubMed] [Google Scholar]
- Richardson L, Ruby S. RESTful web services. O’Reilly; Farnham: 2007. [Google Scholar]
- Schroeder A, Mueller O, Stocker S, Salowsky R, Leiber M, Gassmann M, Lightfoot S, Menzel W, Granzow M, Ragg T. The RIN: an RNA integrity number for assigning integrity values to RNA measurements. BMC molecular biology. 2006;7:3. doi: 10.1186/1471-2199-7-3. [DOI] [PMC free article] [PubMed] [Google Scholar]
- Sharon D, Blackshaw S, Cepko CL, Dryja TP. Profile of the genes expressed in the human peripheral retina, macula, and retinal pigment epithelium determined through serial analysis of gene expression (SAGE) Proceedings of the National Academy of Sciences of the United States of America. 2002;99:315–320. doi: 10.1073/pnas.012582799. [DOI] [PMC free article] [PubMed] [Google Scholar]
- Sheffield VC. The blind leading the obese: the molecular pathophysiology of a human obesity syndrome. Transactions of the American Clinical and Climatological Association. 2010;121:172–181. discussion 181–172. [PMC free article] [PubMed] [Google Scholar]
- Shepard AR, Jacobson N, Fingert JH, Stone EM, Sheffield VC, Clark AF. Delayed secondary glucocorticoid responsiveness of MYOC in human trabecular meshwork cells. Invest Ophthalmol Vis Sci. 2001;42:3173–3181. [PubMed] [Google Scholar]
- Stone EM, Fingert JH, Alward WL, Nguyen TD, Polansky JR, Sunden SL, Nishimura D, Clark AF, Nystuen A, Nichols BE, Mackey DA, Ritch R, Kalenak JW, Craven ER, Sheffield VC. Identification of a gene that causes primary open angle glaucoma. Science. 1997;275:668–670. doi: 10.1126/science.275.5300.668. [DOI] [PubMed] [Google Scholar]
- Takanosu M, Boyd TC, Le Goff M, Henry SP, Zhang Y, Bishop PN, Mayne R. Structure, chromosomal location, and tissue-specific expression of the mouse opticin gene. Invest Ophthalmol Vis Sci. 2001;42:2202–2210. [PubMed] [Google Scholar]
- Thomson CE, Vouyiouklis DA, Barrie JA, Wease KN, Montague P. Plp gene regulation in the developing murine optic nerve: correlation with oligodendroglial process alignment along the axons. Developmental neuroscience. 2005;27:27–36. doi: 10.1159/000084530. [DOI] [PubMed] [Google Scholar]
- Tucker BA, Scheetz TE, Mullins RF, DeLuca AP, Hoffmann JM, Johnston RM, Jacobson SG, Sheffield VC, Stone EM. Exome sequencing and analysis of induced pluripotent stem cells identify the cilia-related gene male germ cell-associated kinase (MAK) as a cause of retinitis pigmentosa. Proceedings of the National Academy of Sciences. 2011;108:E569–E576. doi: 10.1073/pnas.1108918108. [DOI] [PMC free article] [PubMed] [Google Scholar]
- Wang JT, Kunzevitzky NJ, Dugas JC, Cameron M, Barres BA, Goldberg JL. Disease gene candidates revealed by expression profiling of retinal ganglion cell development. The Journal of neuroscience: the official journal of the Society for Neuroscience. 2007;27:8593–8603. doi: 10.1523/JNEUROSCI.4488-06.2007. [DOI] [PMC free article] [PubMed] [Google Scholar]
- Wang WH, McNatt LG, Shepard AR, Jacobson N, Nishimura DY, Stone EM, Sheffield VC, Clark AF. Optimal procedure for extracting RNA from human ocular tissues and expression profiling of the congenital glaucoma gene FOXC1 using quantitative RT-PCR. Mol Vis. 2001;7:89–94. [PubMed] [Google Scholar]
- Wistow G, Peterson K, Gao J, Buchoff P, Jaworski C, Bowes-Rickman C, Ebright JN, Hauser MA, Hoover D. NEIBank: genomics and bioinformatics resources for vision research. Mol Vis. 2008;14:1327–1337. [PMC free article] [PubMed] [Google Scholar]
- Wright AF, Chakarova CF, Abd El-Aziz MM, Bhattacharya SS. Photoreceptor degeneration: genetic and mechanistic dissection of a complex trait. Nature reviews. Genetics. 2010;11:273–284. doi: 10.1038/nrg2717. [DOI] [PubMed] [Google Scholar]
- Yang Z, Quigley HA, Pease ME, Yang Y, Qian J, Valenta D, Zack DJ. Changes in gene expression in experimental glaucoma and optic nerve transection: the equilibrium between protective and detrimental mechanisms. Invest Ophthalmol Vis Sci. 2007;48:5539–5548. doi: 10.1167/iovs.07-0542. [DOI] [PubMed] [Google Scholar]
Associated Data
This section collects any data citations, data availability statements, or supplementary materials included in this article.
Supplementary Materials
Supplemental Figure S1. A 2-coordinate principle component analysis (PCA) of the ten profiled tissues. Here we see the degree of similarity between samples demonstrating overall differences in gene expression between tissues.