

Abstract
Objective
To determine the distribution of the perceived intensity of salt, sweet, sour, and bitter in a large population and to investigate factors associated with perceived taste intensity.
Study Design
Cross-sectional population.
Methods
Subjects (n = 2374, mean age=48.8 years) were participants in the Beaver Dam Offspring Study examined during 2005-2008. Perceived taste intensity was measured using paper disks and a general labeled magnitude scale. Multiple linear regression was performed.
Results
Mean intensity ratings were: salt=27.2 (standard deviation [s.d.]=18.5), sweet=20.4 (s.d.=15.0), sour=35.7 (s.d.=21.4), and bitter=49.6 (s.d.=23.3). Females and those with less than a college degree education rated tastes stronger. With adjustment for age, sex, and education, stronger perceived sour and bitter intensities were related to current smoking (Sour:B=2.8, 95% Confidence Interval [CI]=0.4,5.2; Bitter:B=2.8, 95% CI=0.3,5.4) and lipid-lowering medications (Sour:B=5.1, 95% CI=2.5,7.6; Bitter:B=3.2, 95% CI=0.6,5.8). Alcohol consumption in the past year was related to weaker salt (B= −2.8, 95% CI= −5.3,−0.3) and sweet intensity ratings (B= −2.3, 95% CI= −4.3,−0.3) while olfactory impairment was associated with higher sweet ratings (B=4.7, 95% CI=1.4,7.9).
Conclusion
Perceived intensities were strongest for bitter and weakest for sweet. Sex and education were associated with each taste while age did not demonstrate a consistent relationship. Associations with other factors differed by tastant with current smoking and alcohol consumption being related to some tastes.
Keywords: salt taste, sweet taste, sour taste, bitter taste
INTRODUCTION
The sense of taste is an important component of daily living. The taste of foods can provide pleasure as well as protection from toxic items. Together with olfaction and trigeminal function (somatosensory sensation), taste likely influences the selection and consumption of food items1 and thus, may affect chronic disease risk.
Previous work investigating taste function has used many testing methods with varying modes of administration of tastants, concentrations, and outcomes. In general, the work has suggested, that age, sex, medication use, smoking, oral health, surgeries, injury, and other health conditions may contribute to various measures of taste functioning, at threshold and suprathreshold concentrations.2,3
Studies have reported that older adults have higher detection and identification thresholds.4-9 The use of medications and the interaction between medications, play an important role in this decline of taste with age.6,8,10 At suprathresholds levels, some studies have reported no age relationship with taste identification ability or minimal decline in perceived intensity with age,11,12 while others have found that older adults perceived tastes less intensely than young persons.6 Findings on the relationship between sex and gustation have also not been consistent. Some studies found that females demonstrated better taste function12-14 but many other studies found no relationship.3-5,15-17
Regarding taste functioning and lifestyle behaviors, while a smoking relationship was observed in a recent population survey, it was only among current heavy smokers.12 In a clinic-based study, no association between smoking and perceived intensity was reported.18 Alcohol dependence and a family history of alcoholism have been implicated as being related to sweet preference19,20 but again, studies have not consistently found this relationship.21 Among the health conditions found to have a deleterious association with taste, are head trauma,22 multiple sclerosis, cancer, diabetes mellitus,16 hypertension, colds, upper respiratory tract infections, and oral cavity conditions such as tooth loss, infections, and dry mouth.23 Reviews have been published.6,24
Few of the previous studies have been conducted on a population level. An analysis of data from the 1994 National Health Interview Survey provided prevalence estimates for self-reported chemosensory problems.15 The National Social Life, Health, and Aging Project administered a taste identification test in-home using one set of concentrations but no threshold or suprathreshold testing was performed.14 Few studies have performed multivariable adjustment for age, sex, health factors, and medication use.
The purpose of this study was to determine the distribution of the perceived intensity of the 4 basic tastes presented at suprathreshold concentrations in a large population. In addition, the associations between perceived taste intensity and demographic, lifestyle, health, and medication use factors were evaluated.
MATERIALS and METHODS
Subjects
Subjects were members of the Beaver Dam Offspring Study [BOSS], an investigation of aging among the adult children (ages 21-84 years) of participants in the population-based Epidemiology of Hearing Loss Study [EHLS].25-27 The baseline BOSS examination was conducted in 2005-2008. The Health Sciences Institutional Review Board of the University of Wisconsin approved the study and informed consent was obtained.
Of the 3285 BOSS participants, 2843 were examined (442 participants chose to complete a questionnaire only). Among those examined, 40 (1.4%) did not attempt the taste test and 429 (15.1%) did not successfully learn the intensity scale.
Measurements
Taste
Perceived taste intensity was measured using filter paper disks 3 centimeters in size and prepared in the laboratory of LM Bartoshuk. The disks were impregnated with 1.0 M sodium chloride (salt), 1.8 M sucrose (sweet), 0.1 M citric acid (sour) or 0.001 M quinine (bitter).
Participants rated the perceived taste intensity using a general labeled magnitude scale [gLMS] with a range of “No sensation” (0) to “Strongest imaginable sensation of any kind” (100).28 The participants were trained to use the scale and only those who successfully completed the training continued with testing. The disks were introduced in a standard order: salt, sweet, sour, and bitter. The participant kept the disks in her/his mouth for 10 seconds and after removal identified and estimated the intensity of the tastant. Additional details of the testing have been published.26
Covariates
Factors which had been reported to be associated with taste functioning were considered as possible covariates. Age, sex and education (college graduate-16+ years of education) were included in the analyses. Self-reported information on current smoking, alcohol consumption during the past year, and occupational exposure to organic solvents was considered. Height and weight were measured during the exam and obesity was defined as a Body Mass Index [weight in kilograms/(height in meters)2] of 30.0 or greater.
Olfaction was measured with the San Diego Odor Identification Test [SDOIT] using eight odors frequently experienced in the home.29-31 Olfaction impairment was defined as the correct identification of less than six odorants. The agreement between the SDOIT and the Brief Smell Identification Test32 in classifying olfactory impairment was 96%.33 The test-retest agreement for classification of impairment using the SDOIT was also 96%.
Self-reported health history items included sinus problems/cold/stuffy nose, allergies, nasal polyps, deviated septum, ear infections, periodontal disease, tooth loss due to gum disease and chemotherapy treatment. A history of head injury included a broken nose, skull fracture, concussion or loss of consciousness due to a head injury. The participant was considered to have a history of diabetes if it was doctor-diagnosed (other than during pregnancy for females), or if the glycosylated hemoglobin [A1C] was 6.5 or greater.
Participants brought their prescription and over-the-counter medications used in the past month and the medications were recorded and classified. The following non-mutually exclusive classes, based on previous reports of taste effects, were evaluated: ACE inhibitors, high blood pressure medications, lipid-lowering medications, statins, anti-depressants, and anti-anxiety medications. In addition, females were asked if they had taken hormones for birth control or replacement therapy.
Statistical Analyses
Analyses were conducted for the 4 taste intensity ratings separately and data were treated as continuous. Box and whisker plots were generated and multiple linear regression was used with the putative related factors as the independent variables (age in 5-year increments, other factors as dichotomous 0-1 variables) and perceived taste intensity as the dependent variable. The estimated coefficients represent the number of units of change in the perceived intensity associated with the presence of the factor (or 5 years of age). Ninety-five percent confidence intervals [CI] were calculated using the standard errors of the regression coefficient estimates. Any factor significant at the p < 0.05 level in age and sex-adjusted models was included in the multivariable models. Factors no longer significant after full adjustment were removed in the final models. A non-linear relationship between level of alcohol consumption and taste intensity was assessed using indicator variables for 5 categories: 0, 1-14, 15-74, 75-140 and 140+ grams of ethanol/week.
To determine factors associated with rating the intensities very low or very high, the taste intensity distributions were categorized into 3 groups: decile 1, deciles 2 through 9, and decile 10, and multinomial logistic regression with the glogit link was performed. Finally, a Generalized Estimating Equation [GEE] model was fit to adjust for familial correlation. Analyses were performed using SAS, version 9.1 (SAS Institute, Inc., Cary, NC).
RESULTS
There were 2374 participants (ages 21-84 years, mean=48.8 years) included. Approximately 47% were male, 36% had a college degree, 17% were current smokers, and 90% had consumed alcohol in the past year (Table 1). The distribution of perceived intensity varied by taste quality and sex (Figure 1). On average, perceived intensity was highest for bitter (mean=49.6, standard deviation [s.d.]=23.3), followed by sour (mean=35.7, s.d.=21.4), salt (mean=27.2, s.d.=18.5) and sweet (mean=20.4, s.d.=15.0).
Table 1.
Baseline Characteristics of Study Population
| N | % | |
|---|---|---|
| Total N | 2374 | 100.0 |
| Demographica | ||
| Sex (male) | 1107 | 46.6 |
| College Graduate | 843 | 35.7 |
| Behavioral/Environmental | ||
| Current Smoking | 392 | 16.5 |
| Alcohol – Past Year | 2138 | 90.1 |
| Obesity (BMI ≥ 30.0 kg/m2) | 1033 | 43.7 |
| Solvent Exposure – Current | 157 | 6.7 |
| Solvent Exposure – Ever | 353 | 14.9 |
| Health History | ||
| Olfaction Impairment | 90 | 3.8 |
| Cold – Past Week | 278 | 11.7 |
| Stuffy Nose – Current | 650 | 27.4 |
| Sinus – Past Week | 455 | 19.2 |
| Sinus – Ever | 1444 | 60.9 |
| Allergy – Doctor Diagnosed | 953 | 40.3 |
| Allergy – Self Reported | 1557 | 65.6 |
| Nasal Polyps | 76 | 3.2 |
| Deviated Septum | 206 | 8.8 |
| Head Injury | 702 | 29.6 |
| Ear Infection – Adult | 820 | 34.6 |
| Ear Infection – Ever | 1626 | 68.6 |
| Tooth Loss Due to Gum Disease | 97 | 4.1 |
| Periodontal Disease | 437 | 18.5 |
| Diabetes | 121 | 5.1 |
| Chemotherapy | 43 | 1.8 |
| Medications | ||
| Hormones – Birth Control (% of females) | 992 | 78.4 |
| Hormone Replacement (% of females) | 277 | 21.9 |
| ACE Inhibitors | 254 | 10.7 |
| High Blood Pressure Medications | 587 | 24.7 |
| Lipid-lowering Medications | 396 | 16.7 |
| Statins | 351 | 14.8 |
| Anti-depressants | 378 | 15.9 |
| Anti-anxiety Medications | 76 | 3.2 |
Mean age = 48.8, standard deviation = 9.8
Figure 1. Distribution of Taste Intensity by Tastant and Sex.
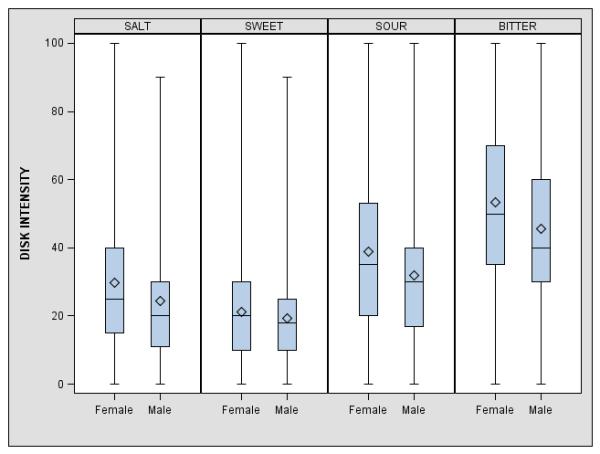
Shaded boxes represent the interquartile range, diamonds within the boxes show the means, horizontal lines within the boxes indicate the medians, and vertical lines show the range of the data.
In age and sex-adjusted models, age, sex and education were significantly related to perceived intensity (Table 2). Older participants perceived stronger intensities, while males and college graduates perceived weaker intensities (negative coefficients). Smokers rated sour and bitter significantly more intense than non-smokers and participants who had consumed alcohol perceived salt, sweet, and sour to be significantly less intense than non-drinkers. Those with an olfactory impairment perceived the sweet disk more intensely, participants with sinus problem histories rated the salt disk as more intense and those with a diabetes history perceived sour more intensely. Sweet was associated with ACE inhibitors, sour was related to high blood pressure medications, lipid-lowering medications, and statins, and bitter was associated with lipid-lowering medications, statins, anti-depressants, and anti-anxiety medications. No significant associations were found with obesity, solvent exposure, cold/stuffy nose/sinus problems in the past week, allergies, nasal polyps, deviated septum, head injury, ear infections, periodontal disease, chemotherapy or hormone use.
Table 2.
Factors Related To Taste Intensity. Linear Regression, Age & Sex Adjusteda
| Salt | Sweet | Sour | Bitter | |||||
|---|---|---|---|---|---|---|---|---|
| B | 95% CI | B | 95% CI | B | 95% CI | B | 95% CI | |
| Demographic | ||||||||
| Age (5 years) | 0.4 | 0.04,0.8 | 0.8 | 0.5,1.1 | 0.8 | 0.4,1.3 | 0.5 | 0.1,1.0 |
| Sex (male) | −5.3 | −6.8,−3.8 | −1.8 | −3.0,−0.6 | −6.8 | −8.6,−5.0 | −7.8 | −9.7,−6.0 |
| College Graduate | −2.4 | −3.9,−0.8 | −1.7 | −2.9,−0.4 | −5.5 | −7.4,−3.6 | −4.6 | −6.5,−2.6 |
| Behavioral/Environmental | ||||||||
| Current Smoking | 0.1 | −1.9, 2.1 | 0.9 | −0.8, 2.5 | 4.0 | 1.6, 6.4 | 3.8 | 1.3, 6.3 |
| Alcohol – Past Year | −2.9 | −5.4,−0.5 | −2.7 | −4.7,−0.6 | −3.5 | −6.6,−0.5 | −2.1 | −5.2,1.0 |
| Health History | ||||||||
| Olfaction Impairment | 1.5 | −2.4,5.4 | 4.6 | 1.4,7.8 | 1.0 | −3.8,5.9 | 0.0 | −4.9,4.9 |
| Sinus – Ever | 1.7 | 0.2,3.2 | 0.6 | −0.7,1.8 | 0.7 | −1.1,2.6 | 1.6 | −0.3,3.5 |
| Diabetes | 2.0 | −1.4,5.4 | 1.7 | −1.1,4.5 | 4.8 | 0.6,9.1 | 2.0 | −2.3,6.2 |
| Medications | ||||||||
| ACE Inhibitors | 1.0 | −1.4,3.5 | 2.0 | 0.02,4.0 | 1.4 | −1.6,4.4 | 0.1 | −3.0,3.2 |
| High Blood Pressure Medications | 1.2 | −0.7,3.0 | 0.9 | −0.6,2.5 | 2.6 | 0.3,4.8 | 1.4 | −0.9,3.7 |
| Lipid-lowering Medications | 0.8 | −1.3,2.9 | 0.7 | −1.0,2.4 | 5.0 | 2.4,7.5 | 3.2 | 0.6,5.8 |
| Statins | 1.1 | −1.1,3.3 | 0.9 | −0.9,2.7 | 5.1 | 2.4,7.8 | 3.2 | 0.5,6.0 |
| Anti-depressants | −0.4 | −2.4,1.6 | 0.7 | −1.0,2.4 | 1.6 | −0.9,4.1 | 2.8 | 0.2,5.3 |
| Anti-anxiety Medications | −1.9 | −6.1,2.3 | 1.2 | −2.2,4.6 | 3.4 | −1.7,8.5 | 5.4 | 0.1,10.7 |
Shading indicates significance, p < 0.05
After full adjustment, age remained significantly related only to sweet (B+5 years=0.6) while sex and a college education continued to be significant for each of the 4 tastes (Table 3). Sex was strongly related to sour (Bmale= −7.3) and bitter (Bmale= −8.2) as was having a college degree (sour: B= −5.2; bitter: B= −4.2). Current smoking was significantly associated with sour (B= 2.8) and bitter (B= 2.8) while any alcohol use in the past year was related to salt (B= −2.8) and sweet (B= −2.3). There was not a significant dose response with number of cigarettes smoked. The relationship between the amount of alcohol consumed and perceived intensity of salt and sweet was non-linear with moderate levels of alcohol (15-74 grams/week) associated with the lowest intensity ratings (salt:B= −3.8; sweet:B= −3.2; reference was 0 grams/week) and heavier consumption (> 140 grams/week) associated with intensity ratings similar to those of the non-drinkers (salt:B= −1.3; sweet:B= −1.2). Other health-related significant factors were ever having a sinus problem (salt:B= 1.8), current olfactory impairment (sweet:B= 4.7) and lipid-lowering medication use (sour:B= 5.1; bitter:B= 3.2). Adjustment for familial correlation did not alter the results substantially although for salt, alcohol use in the past year became only marginally significant (p=0.053). Similar results were observed when the low and high (1st and 10th decile) ends of the perceived intensity distributions were compared to the middle range.
Table 3.
Factors Related to Taste Intensity. Linear Regression, Final Multivariable Adjusted
| Salt | Sweet | Sour | Bitter | |||||
|---|---|---|---|---|---|---|---|---|
| B | 95% CI | B | 95% CI | B | 95% CI | B | 95% CI | |
| Demographic | ||||||||
| Age (5 years) | 0.3 | −0.1,0.7 | 0.6 | 0.3,1.0 | 0.4 | −0.1,0.9 | 0.3 | −0.2,0.8 |
| Sex (male) | −4.9 | −6.5,−3.4 | −1.9 | −3.1,−0.7 | −7.3 | −9.1,−5.5 | −8.2 | −10.1,−6.3 |
| College Graduate | −2.3 | −3.9,−0.8 | −1.6 | −2.8,−0.3 | −5.2 | −7.0,−3.3 | −4.2 | −6.1,−2.2 |
| Behavioral/Environmental | ||||||||
| Current Smoking | 2.8 | 0.4,5.2 | 2.8 | 0.3,5.4 | ||||
| Alcohol - Past Year | −2.8 | −5.3,−0.3 | −2.3 | −4.3,−0.3 | ||||
| Health History | ||||||||
| Olfaction Impairment | 4.7 | 1.4,7.9 | ||||||
| Sinus – Ever | 1.8 | 0.3,3.4 | ||||||
| Medications | ||||||||
| Lipid-lowering Medications | 5.1 | 2.5,7.6 | 3.2 | 0.6,5.8 | ||||
DISCUSSION
Although it was observed that a number of factors were associated with perceived taste intensity, age was not one of these factors. Previous work on the age-taste relationship has been inconsistent for suprathreshold testing with some studies finding no effect11,12,34 and other studies finding a decline in perceived taste intensity and discrimination with age for sour, bitter, and salt.5,35-37 It is important to note that the present study’s adjusted results refer to the association of age with taste independent of sex, education, lifestyle, disease status, and medication use. Much of the previous work did not adjust for other related factors.38 The lack of association of age and taste intensity perception may be a consequence of having the oral cavity innervated with 3 cranial nerves so that any loss of function in one area or nerve results in increased activity from another area to maintain whole mouth tasting.39 It is also possible that because the study population was predominantly middle-aged, there was insufficient power to observe aging effects occurring in later life.
In the present study, females perceived each taste significantly more intensely than males. These results are compatible with an early study of suprathreshold taste intensity, where females displayed greater perceived bitter and sour intensities when stratified by age.40 Previous population studies have also observed that females scored better in taste identification tests.13,14,41,42 The mechanism through which gender affects the sense of taste is not known but it may be related to hormonal influences on taste and trigeminal function during the menstrual cycle, pregnancy, or during and after menopause .43,44
The finding that participants with a college degree demonstrated significantly lower perceived taste intensities has not been previously reported. However, two studies have reported that a higher level of education was associated with better ability to identify tastes41,45 and in an analysis of food shopper data, researchers found that the shoppers who were classified as “adventurous” were highly educated with 46% having a college degree.46 Expanded taste experiences and more extensive familiarity with a range of tastes may be a contributing reason for these findings. Tastants presented at suprathreshold concentrations may not be perceived as intense by individuals exposed to high intensity tastants in daily life.
The finding that smoking and alcohol consumption, modifiable behaviors, were associated with taste intensity perception is of interest in so far as the sense of taste is related to food choice and consumption and consequently, perhaps health. This study is among the first to find a positive association between current smoking and perceived intensity of sour and bitter although no dose response relationship was observed. Previous work has usually found minimal or no association18 but in one cross-sectional study, a direct relationship between current heavy smoking and taste impairment was reported.12 It has been hypothesized that smoking is related to taste functioning through its effect on taste papillae. In a recent study of young individuals, no significant differences were found in the number or size of fungiform papillae in current versus never smokers but morphologic changes were observed most frequently in heavy smokers.18 However, smokers performed significantly worse than non-smokers only in identifying a bitter taste at a very low concentration. The present study’s significant results were restricted to bitter and sour tastes but suggested that smokers perceived these tastes more intensely than non-smokers. It is unknown if these results are related to papillae changes.
Regarding alcohol consumption, participants with moderate levels of alcohol intake perceived salt and sweet less intensely than the non- and heavy-drinkers. Previous studies have reported no association of alcoholism or family history of alcoholism with the perceived intensity of sweet20,21 but have found a positive association with sweet preference.19,20 There may be multiple mechanisms involved in the observed non-linear relationship including papillae changes and a shared genetic component between sensitivity for sweet and alcohol. Mouse studies have found that a sweet taste receptor gene, Tas1r3, is very closely tied to the Ap3q locus which influences ethanol intake and that other separate loci for the two traits are linked.47 Humans may very well have related orthologs.47
Our results suggested that participants with an olfactory impairment perceived sweet significantly more intensely. Recent studies have reported either no association between olfactory loss and taste48 or a deleterious effect of long-term olfaction impairment on taste identification.49 It is possible that a different relationship was observed in the present study because tastes were presented at suprathreshold concentrations and it was not possible to evaluate olfactory impairment duration. We are unlikely to be observing cortical plasticity where the loss of one sense leads to activation of cortical connections used by another sense, such as with vision and hearing.50 Olfactory and gustatory functioning are much more inter-related anatomically and physiologically than other senses.
Numerous medications affect taste with some effects continuing several months after cessation of use. Interactions between medications are a particular problem.8 The effects on taste caused by medications include distortion, attenuation, intensification, and absence, but the underlying mechanisms have not been established.51 In the present study, participants taking lipid-lowering medications perceived sour and bitter more intensely. According to the Physicians Desk Reference,52 7 of 10 lipid-lowering drugs can alter taste.53 Lipid-lowering medications have high lipophilicity leading to easy absorption into the blood stream and concentration in tissues, including the taste buds.8 This concentration of drug in the taste receptors may be contributing to taste alterations. Another possibility is that the metabolic actions of the medications may cause alterations in the functioning of the taste buds or neurons related to the ionic stimuli (sour or salt) or alterations in the second messenger system of signal transduction.51,53
Associations between perceived taste intensity and previously suggested related factors including diabetes,16 oral cavity conditions,23 and head injuries7 were not observed. It is possible that the number of participants with these conditions was too small to detect a relationship. It is not likely that our estimates of the strength of association between the perceived intensities and related factors were impacted by the loss of the sub-sample of participants who were unable to understand the intensity rating scale. However, since younger participants, college graduates and current non-smokers were significantly more likely to have learned the scale, the estimates of the perceived intensity distribution statistics may have been affected slightly.
CONCLUSION
In this large population, whole mouth taste testing was performed to provide an approximation of daily taste experience and perception and tastes were presented at suprathreshold levels. Disorders of suprathreshold measures impact the ability to discriminate different tastes3 and this discrimination may have great influence on food selection and consequently nutritional status. Findings suggested that sex and education, but not age, were strongly associated with all 4 tastants, current smoking and lipid-lowering medications were significantly related to sour and bitter intensity perceptions, and alcohol consumption was related to the perceived salt and sweet intensities.
ACKNOWLEDGEMENTS
The authors thank the participants for their continued commitment to the study.
The project described was supported by R01AG021917 from the National Institute on Aging, National Eye Institute, and National Institute on Deafness and Other Communication Disorders. The content is solely the responsibility of the authors and does not necessarily reflect the official views of the National Institute on Aging or the National Institutes of Health.
Footnotes
Conflicts of Interest: None
Presented at: 2011 Association for Chemoreception Sciences annual meeting, St. Pete Beach, FL, USA, April 17, 2011
REFERENCES
- 1.Glanz K, Basil M, Maibach E, Goldberg J, Snyder D. Why Americans eat what they do: taste, nutrition, cost, convenience, and weight control concerns as influences on food consumption. J Am Diet Assoc. 1998;98(10):1118–1126. doi: 10.1016/S0002-8223(98)00260-0. [DOI] [PubMed] [Google Scholar]
- 2.Schiffman SS. Taste and smell in disease (first of two parts) N Engl J Med. 1983;308(21):1275–1279. doi: 10.1056/NEJM198305263082107. [DOI] [PubMed] [Google Scholar]
- 3.Schiffman SS. Taste and smell in disease (second of two parts) N Engl J Med. 1983;308(22):1337–1343. doi: 10.1056/NEJM198306023082207. [DOI] [PubMed] [Google Scholar]
- 4.Kaneda H, Maeshima K, Goto N, Kobayakawa T, Ayabe-Kanamura S, Saito S. Decline in taste and odor discrimination abilities with age, and relationship between gustation and olfaction. Chem Senses. 2000;25(3):331–337. doi: 10.1093/chemse/25.3.331. [DOI] [PubMed] [Google Scholar]
- 5.Kennedy O, Law C, Methven L, Mottram D, Gosney M. Investigating age-related changes in taste and affects on sensory perceptions of oral nutritional supplements. Age Ageing. 2010;39(6):733–738. doi: 10.1093/ageing/afq104. [DOI] [PubMed] [Google Scholar]
- 6.Schiffman SS. Perception of taste and smell in elderly persons. Crit Rev Food Sci Nutr. 1993;33(1):17–26. doi: 10.1080/10408399309527608. [DOI] [PubMed] [Google Scholar]
- 7.Schiffman SS. Taste and smell losses in normal aging and disease. JAMA. 1997;278(16):1357–1362. [PubMed] [Google Scholar]
- 8.Schiffman SS. Effects of aging on the human taste system. Ann N Y Acad Sci. 2009;1170:725–729. doi: 10.1111/j.1749-6632.2009.03924.x. [DOI] [PubMed] [Google Scholar]
- 9.Stevens JC, Cruz LA, Hoffman JM, Patterson MQ. Taste sensitivity and aging. Chem Senses. 1995;20(4):451–459. doi: 10.1093/chemse/20.4.451. [DOI] [PubMed] [Google Scholar]
- 10.Finkelstein JA, Schiffman SS. Workshop on taste and smell in the elderly: an overview. Physiol Behav. 1999;66(2):173–176. doi: 10.1016/s0031-9384(98)00261-3. [DOI] [PubMed] [Google Scholar]
- 11.Bartoshuk LM, Rifkin B, Marks LE, Bars P. Taste and aging. J Gerontol. 1986;41(1):51–57. doi: 10.1093/geronj/41.1.51. [DOI] [PubMed] [Google Scholar]
- 12.Vennemann MM, Hummel T, Berger K. The association between smoking and smell and taste impairment in the general population. J Neurol. 2008;255(8):1121–1126. doi: 10.1007/s00415-008-0807-9. [DOI] [PubMed] [Google Scholar]
- 13.Landis BN, Welge-Luessen A, Bramerson A, et al. “Taste Strips” – a rapid, lateralized, gustatory bedside identification test based on impregnated filter papers. J Neurol. 2009;256(2):242–248. doi: 10.1007/s00415-009-0088-y. [DOI] [PubMed] [Google Scholar]
- 14.Schumm LP, McClintock M, Williams S, et al. Assessment of sensory function in the National Social Life, Health, and Aging Project. J Gerontol B Psychol Sci Soc Sci. 2009;64(Suppl 1):i76–i85. doi: 10.1093/geronb/gbp048. [DOI] [PMC free article] [PubMed] [Google Scholar]
- 15.Hoffman HJ, Ishii EK, Macturk RH. Age-related changes in the prevalence of smell/taste problems among the United States adult population. Results of the 1994 disability supplement to the National Health Interview Survey (NHIS) Ann N Y Acad Sci. 1998;855:716–722. doi: 10.1111/j.1749-6632.1998.tb10650.x. [DOI] [PubMed] [Google Scholar]
- 16.Michikawa T, Nishiwaki Y, Takebayashi T. Are you conscious of any age-related taste impairment? Prevalence of and factors associated with taste impairment in Japan. J Am Geriatr Soc. 2011;59(5):951–952. doi: 10.1111/j.1532-5415.2011.03397.x. [DOI] [PubMed] [Google Scholar]
- 17.Schiffman SS. Changes in taste and smell with age: psychophysical aspects. In: Ordy JM, Brizzee KR, editors. Sensory Systems and Communication in the Elderly. Raven Press; New York: 1979. pp. 227–246. [Google Scholar]
- 18.Konstantinidis I, Chatziavramidis A, Printza A, Metaxas S, Constantinidis J. Effects of smoking on taste: assessment with contact endoscopy and taste strips. Laryngoscope. 2010;120(10):1958–1963. doi: 10.1002/lary.21098. [DOI] [PubMed] [Google Scholar]
- 19.Kampov-Polevoy A, Garbutt JC, Janowsky D. Evidence of preference for a high-concentration sucrose solution in alcoholic men. Am J Psychiatry. 1997;154(2):269–270. doi: 10.1176/ajp.154.2.269. [DOI] [PubMed] [Google Scholar]
- 20.Wronski M, Skrok-Wolska D, Samochowiec J, et al. Perceived intensity and pleasantness of sucrose taste in male alcoholics. Alcohol Alcohol. 2007;42(2):75–79. doi: 10.1093/alcalc/agl097. [DOI] [PubMed] [Google Scholar]
- 21.Tremblay KA, Bona JM, Kranzler HR. Effects of a diagnosis or family history of alcoholism on the taste intensity and hedonic value of sucrose. Am J Addict. 2009;18(6):494–499. doi: 10.3109/10550490903206023. [DOI] [PMC free article] [PubMed] [Google Scholar]
- 22.Deems DA, Doty RL, Settle RG, et al. Smell and taste disorders, a study of 750 patients from the University of Pennsylvania Smell and Taste Center. Arch Otolaryngol Head Neck Surg. 1991;117(5):519–528. doi: 10.1001/archotol.1991.01870170065015. [DOI] [PubMed] [Google Scholar]
- 23.Ship JA, Duffy V, Jones JA, Langmore S. Geriatric oral health and its impact on eating. J Am Geriatr Soc. 1996;44(4):456–464. doi: 10.1111/j.1532-5415.1996.tb06419.x. [DOI] [PubMed] [Google Scholar]
- 24.Mott AE, Leopold DA. Disorders in taste and smell. Med Clin North Am. 1991;75(6):1321–1353. doi: 10.1016/s0025-7125(16)30391-1. [DOI] [PubMed] [Google Scholar]
- 25.Cruickshanks KJ, Wiley TL, Tweed TS, et al. Prevalence of hearing loss in older adults in Beaver Dam, Wisconsin. The Epidemiology of Hearing Loss Study. Am J Epidemiol. 1998;148(9):879–886. doi: 10.1093/oxfordjournals.aje.a009713. [DOI] [PubMed] [Google Scholar]
- 26.Cruickshanks KJ, Schubert CR, Snyder DJ, et al. Measuring taste impairment in epidemiologic studies. The Beaver Dam Offspring Study. Ann N Y Acad Sci. 2009;1170:543–552. doi: 10.1111/j.1749-6632.2009.04103.x. [DOI] [PMC free article] [PubMed] [Google Scholar]
- 27.Zhan W, Cruickshanks KJ, Klein BE, et al. Generational differences in the prevalence of hearing impairment in older adults. Am J Epidemiol. 2010;171(2):260–266. doi: 10.1093/aje/kwp370. [DOI] [PMC free article] [PubMed] [Google Scholar]
- 28.Bartoshuk LM, Duffy VB, Green BG, et al. Valid across-group comparisons with labeled scales: the gLMS versus magnitude matching. Physiol Behav. 2004;82(1):109–114. doi: 10.1016/j.physbeh.2004.02.033. [DOI] [PubMed] [Google Scholar]
- 29.Murphy C, Anderson JA, Markison S. Psychophysical assessment of chemosensory disorders in clinical populations. In: Kurihara K, Suzuki N, Ogawa H, editors. Olfaction and Taste XI. Springer-Verlag; Tokyo (Japan): 1994. pp. 609–613. [Google Scholar]
- 30.Murphy C, Schubert CR, Cruickshanks KJ, Klein BE, Klein R, Nondahl DM. Prevalence of olfactory impairment in older adults. JAMA. 2002;288(18):2307–2312. doi: 10.1001/jama.288.18.2307. [DOI] [PubMed] [Google Scholar]
- 31.Schubert CR, Cruickshanks KJ, Murphy C, et al. Olfactory impairment in adults. Ann N Y Acad Sci. 2009;1170:531–536. doi: 10.1111/j.1749-6632.2009.04102.x. [DOI] [PMC free article] [PubMed] [Google Scholar]
- 32.Doty RL. The Brief Smell Identification Test™ administration manual. Sensonics Inc.; Haddon Height (NJ): 2001. [Google Scholar]
- 33.Krantz EM, Schubert CR, Dalton DS, et al. Test-retest reliability of the San Diego Odor Identification Test and comparison with the Brief Smell Identification Test. Chem Senses. 2009;34(5):435–440. doi: 10.1093/chemse/bjp018. [DOI] [PMC free article] [PubMed] [Google Scholar]
- 34.Stevens JC, Bartoshuk LM, Cain WS. Chemical senses and aging: taste versus smell. Chem Senses. 1984;9(2):167–174. [Google Scholar]
- 35.Gilmore MM, Murphy C. Aging is associated with increased Weber ratios for caffeine, but not for sucrose. Percept Psychophys. 1989;46(6):555–559. doi: 10.3758/bf03208152. [DOI] [PubMed] [Google Scholar]
- 36.Murphy C, Gilmore MM. Quality-specific effects of aging on the human taste system. Percept Psychophys. 1989;45(2):121–128. doi: 10.3758/bf03208046. [DOI] [PubMed] [Google Scholar]
- 37.Nordin S, Razani LJ, Markison S, Murphy C. Age-associated increases in intensity discrimination for taste. Exp Aging Res. 2003;29(3):371–381. doi: 10.1080/03610730303719. [DOI] [PubMed] [Google Scholar]
- 38.Mattes RD. The chemical senses and nutrition in aging: challenging old assumptions. J Am Diet Assoc. 2002;102(2):192–196. doi: 10.1016/s0002-8223(02)90047-7. [DOI] [PubMed] [Google Scholar]
- 39.Duffy VB. Variation in oral sensation: implications for diet and health. Curr Opin Gastroenterol. 2007;23(2):171–177. doi: 10.1097/MOG.0b013e3280147d50. [DOI] [PubMed] [Google Scholar]
- 40.Hyde RJ, Feller RP. Age and sex effects on taste of sucrose, NaCl, citric acid and caffeine. Neurobiol Aging. 1981;2(4):315–318. doi: 10.1016/0197-4580(81)90041-5. [DOI] [PubMed] [Google Scholar]
- 41.Boesveldt S, Lindau ST, McClintock MK, Hummel T, Lindstrom JN. Gustatory and olfactory dysfunction in older adults: a national probability study. Rhinology. 2011;49(3):324–330. doi: 10.4193/rhino10.155. [DOI] [PMC free article] [PubMed] [Google Scholar]
- 42.Welge-Lussen A, Dorig P, Wolfensberger M, Krone F, Hummel T. A study about the frequency of taste disorders. J Neurol. 2011;248(3):386–392. doi: 10.1007/s00415-010-5763-5. [DOI] [PubMed] [Google Scholar]
- 43.Prutkin J, Duffy VB, Etter L, et al. Genetic variation and inferences about perceived taste intensity in mice and men. Physiol Behav. 2000;69(1-2):161–173. doi: 10.1016/s0031-9384(00)00199-2. [DOI] [PubMed] [Google Scholar]
- 44.Duffy VB, Bartoshuk LM. Food acceptance and genetic variation in taste. J Am Diet Assoc. 2000;100(6):647–655. doi: 10.1016/S0002-8223(00)00191-7. [DOI] [PubMed] [Google Scholar]
- 45.Cowart BJ. Relationships between taste and smell across the adult life span. Ann N Y Acad Sci. 1989;561:39–55. doi: 10.1111/j.1749-6632.1989.tb20968.x. [DOI] [PubMed] [Google Scholar]
- 46.Nie C, Zepeda L. Lifestyle segmentation of US food shoppers to examine organic and local food consumption. Appetite. 2011;57(1):28–37. doi: 10.1016/j.appet.2011.03.012. [DOI] [PubMed] [Google Scholar]
- 47.Bachmanov AA, Kiefer SW, Molina JC, et al. Chemosensory factors influencing alcohol perception, preferences, and consumption. Alcohol Clin Exp Res. 2003;27(2):220–231. doi: 10.1097/01.ALC.0000051021.99641.19. [DOI] [PMC free article] [PubMed] [Google Scholar]
- 48.Stinton N, Atif MA, Barkat N, Doty RL. Influence of smell loss on taste function. Behav Neurosci. 2010;124(2):256–264. doi: 10.1037/a0018766. [DOI] [PubMed] [Google Scholar]
- 49.Landis BN, Scheibe M, Weber C, et al. Chemosensory interaction: acquired olfactory impairment is associated with decreased taste function. J Neurol. 2010;257(8):1303–1308. doi: 10.1007/s00415-010-5513-8. [DOI] [PubMed] [Google Scholar]
- 50.Collignon O, Voss P, Lassonde M, Lepore F. Cross-modal plasticity for the spatial processing of sounds in visually deprived subjects. Exp Brain Res. 2009;192(3):343–358. doi: 10.1007/s00221-008-1553-z. [DOI] [PubMed] [Google Scholar]
- 51.Naik BS, Shetty N, Maben EVS. Drug-induced taste disorders. Eur J Intern Med. 2010;21(3):240–243. doi: 10.1016/j.ejim.2010.01.017. [DOI] [PubMed] [Google Scholar]
- 52.Physicians’ Desk Reference. 56th ed. Medical Economics Company, Inc.; Montvale, NJ: 2002. 2002. [Google Scholar]
- 53.Doty RL, Philip S, Reddy K, Kerr K-L. Influences of antihypertensive and antihyperlipidemic drugs on the senses of taste and smell: a review. J Hypertens. 2003;21(10):1805–1813. doi: 10.1097/00004872-200310000-00003. [DOI] [PubMed] [Google Scholar]