Abstract
Purpose
Unstable posterior fracture-dislocation of the hip is determined by the wall defect or acetabular fracture index. The unstable hip is a result of inadequate posterior acetabular coverage of the femoral head from the posterior acetabular wall fracture. In order to measure total posterior acetabular coverage of the femoral head and avoid using the contralateral acetabulum as a calculation reference, the posterior acetabular arc angle of the femoral head was measured to assess stability of posterior fracture-dislocation of the hip.
Methods
Using coronal computed tomography (CT) scan of the normal contralateral acetabulum at the level of the widest acetabular diameter and thinnest medial wall of 60 acetabular fractures, posterior acetabular arc angles of the femoral head in intact, 20 % and 50 % defects of posterior acetabular walls were measured. The angles were measured from the acetabular centre to the thinnest medial wall and to the top, inner cortex of 80 % and 50 % posterior acetabular walls.
Results
Average intact, 80 % and 50 % posterior acetabular walls were 33.82 ± 4.30, 26.88 ± 3.33 and 16.91 ± 2.15 mm which corresponded to 92.25 ± 11.34, 77.42 ± 10.04 and 50.63 ± 6.58° of posterior acetabular arc angles of the femoral head. The intraclass correlation coefficient (ICC) of the measurements including correlation of conversion of posterior acetabular wall depths to posterior acetabular arc angles of the femoral head were more than 0.82 and 0.89.
Conclusions
The measurement technique of posterior acetabular arc angle of the femoral head has strong reliability. Therefore, stable or unstable posterior fracture-dislocation of the hip can be determined in terms of more than 77 degrees or less than 50 degrees of posterior acetabular arc angles of the femoral head instead of less than 20 % or more than 50 % posterior acetabular wall defect.
Introduction
A posterior stable hip depends on adequate posterior acetabular coverage of the femoral head. Unstable posterior fracture-dislocation of the hip is created by posterior acetabular wall fracture. Preoperative coronal computed tomography (CT) scan of the acetabulum for evaluation of the posterior stable or unstable hip is necessary. Determination of the unstable hip in terms of either percentage of the posterior wall defect or acetabular fracture index are currently in clinical use [1–4]. The defect more than 50 % or acetabular fracture index less than 34 % determines an unstable hip [2, 3]. On the other hand, a defect less than 20 % or acetabular fracture index more than 55 % determines a stable hip [1, 2]. Both measurement techniques include only the posterior acetabular wall and do not include total posterior acetabular coverage of the femoral head. Total posterior acetabular coverage of the femoral head consists of the posterior half of the medial wall and posterior acetabular wall. Moreover, the former measurement techniques need a normal contralateral acetabulum as a reference for calculation. Pythagoras described the principle of circle parts about the central angle and arc [5]. Matta and Merritt used the principle of Pythagoras in terms of acetabular roof arc angles to determine whether there is adequate acetabular coverage of the femoral head in acetabular fractures [6]. In order to measure total posterior acetabular coverage of the femoral head and avoid using a normal contralateral acetabulum as calculation reference, we applied the Pythagoras principle as a method to assess either stable or unstable posterior fracture-dislocation of the hip by determining posterior acetabular coverage of the femoral head in terms of posterior acetabular arc angle of the femoral head and tested the reliability of the measurement techniques.
Materials and methods
The study was carried out after receiving a certificate of ethical approval from the Siriraj Institutional Review Board.
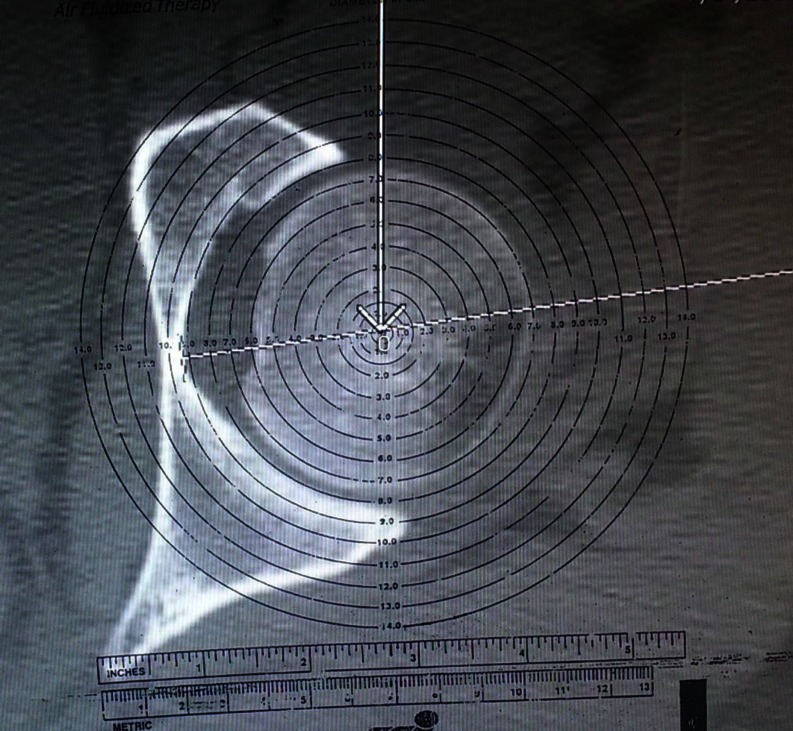
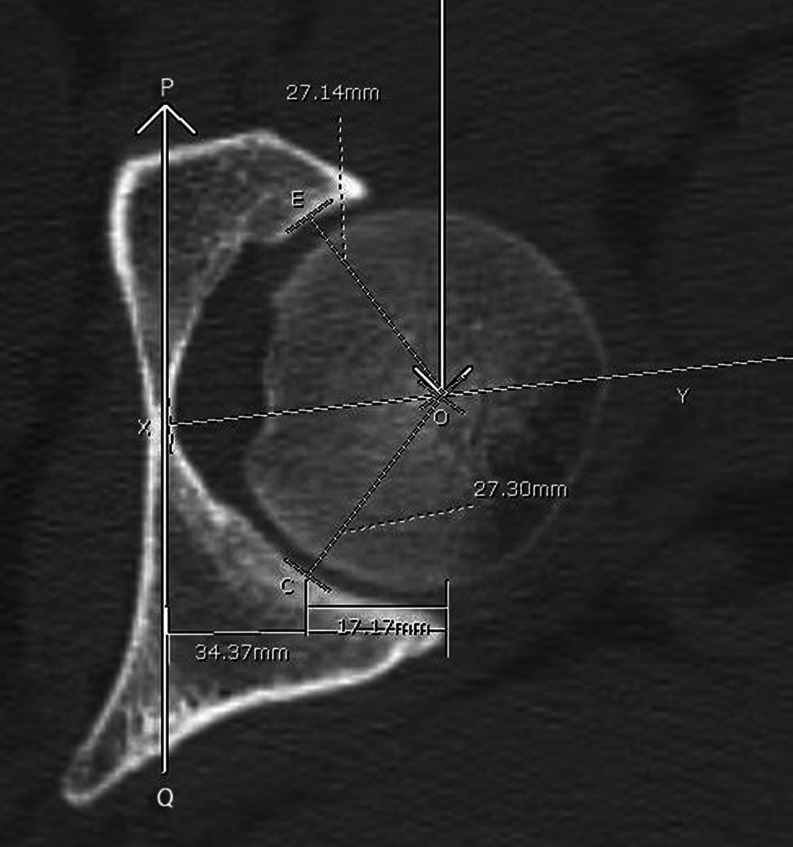
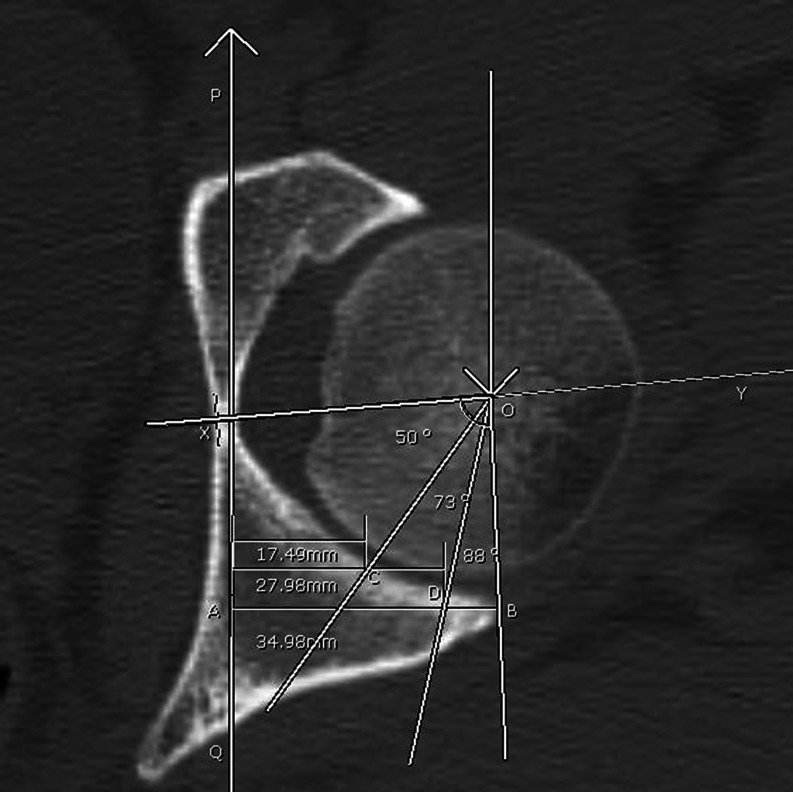
Between 2000 and 2010, one millimetre coronal cut CT scan of the normal contralateral acetabulum of adult patients who suffered acetabular fracture were studied. Exclusion criteria were acetabular deformities, osteoarthritis of the hip and patients who were less than 16 years of age. The study used PAC digital system with measurement tools. One millimetre serial coronal cut CT scans of the normal contralateral acetabulum were viewed and one selected at the level of the widest acetabular diameter with the thinnest medial acetabular wall for the measurements. The measurement technique was designed by the first and fourth authors (TH and TH). An XY line was drawn perpendicularly to the medial wall at the thinnest point of the wall (X). The XY line passed through the centre of the acetabulum and divided the anterior and posterior halves of the acetabulum following the geometry of the circle [5]. A straight PQ line was drawn along the cortex of the medial acetabular wall to the base of the posterior acetabular wall. The centre of the acetabulum was identified by using a Flexicair circle template. Anterior, posterior acetabular walls and XY line were used as references. Firstly, the centre of the circle template was placed into the XY line and slightly adjusted medially and laterally along the XY line, simultaneously moved up and down referring to curves of anterior and posterior acetabular walls to achieve the most appropriate circle template. The most appropriate circle template was reconfirmed by the parallel of the circumference of the circle template with the curve of the medial acetabular wall. Then, the centre of the acetabulum was definitely identified and marked (O) (Fig. 1). When the acetabular centre was marked, the distances from the acetabular centre to the middle of the articular curve of the anterior wall (OE) and middle of the posterior wall (OC) were measured. OE and OC represented the radius of the acetabular circle and were recorded for determining the reliability of the acetabular centre. Ratios of OC to OE were calculated and accepted in the range of 0.95–1.03 (ideal ratio is 1) (Fig. 2). An intact posterior acetabular wall (AB) was measured as a distance from the top of the wall (B) perpendicular to the PQ line (A). Then, 20 % (AD) and 50 % (AC) defects of the wall were calculated and marked (Fig. 3). Posterior acetabular arc angles of the femoral head were measured in intact, 20 % and 50 % defects of the posterior acetabular wall. The 20 % posterior acetabular wall defect represented a stable hip with 80 % remaining posterior wall and 50 % defect represented an unstable hip with 50 % remaining posterior wall [1]. An OX line was drawn from the centre of the acetabulum (O) to the thinnest medial wall (X). OB, OD and OC lines were drawn from the centre of the acetabulum (O) to the top of the wall (B), inner cortex of the 80 % (D) and of the 50 % (C) posterior walls (Fig. 3). Posterior acetabular arc angles of the femoral head at levels of the intact, 80 % and 50 % posterior acetabular wall were measured as degrees of XÔB, XÔD and XÔC angles, respectively (Fig. 3). The measurements were performed by two orthopaedic surgeons at six-month intervals for inter- and intraobserver evaluation. The data were recorded. Mean, standard deviation and 95 % confidence interval (CI) were calculated. The reliability of the measurements was assessed by inter- and intraobserver error with an intraclass correlation coefficient (ICC); especially the acetabular centre was tested for reliability by using the measurement of OE and OC. The ICC of all measurements more than 0.75 were considered as strong reliability [7]. The constant values as the ratio of conversion from intact, 80 % and 50 % posterior acetabular walls in millimetres to degrees of posterior acetabular arc angles of the femoral head were calculated and correlation was analysed by Pearson correlation coefficient and more than 0.7 considered strong correlation [8].
Fig. 1.
The centre of the acetabulum was identified and marked
Fig. 2.
Parameters for assessment of reliability of the acetabular centre (OE and OC)
Fig. 3.
Intact (AB), 80 % (AD) and 50 % (AC) posterior acetabular walls were measured and marked. XÔB, XÔD and XÔC angles were posterior acetabular arc angles of the femoral head at intact, 80 % and 50 % posterior walls, respectively
Results
CT scans of the normal contralateral acetabulum were available for 60 patients who suffered acetabular fractures, ranging in age from 16 to 81 years old, consisting of 42 men and 18 women, involving 41 left and 19 right sides. The centre of the acetabulum was a definitely marked point and average OE and OC were 23.99 ± 1.82 (20.47–27.69) and 23.53 ± 1.84 (20.39–27.45). Ratio of OC and OE was 0.98 ± 0.02 (0.95–1.02). Average intact, 80 % and 50 % posterior acetabular walls were 33.82 ± 4.30 mm (25.11–44.77), 26.88 ± 3.33 mm (20.08–35.81) and 16.91 ± 2.15 mm (12.55–22.38), which corresponded to posterior acetabular arc angles of the femoral head of 92.25 ± 11.34 (69.00–121.00), 77.42 ± 10.04 (55.00–99.00) and 50.63 ± 6.58° (37.00–64.00), respectively (Table 1). The statistical analysis showed that the measurements including reliability of the acetabular centre exhibited ICC more than 0.82 for inter- and intraobserver reliability (Table 1). Constant values of conversion from posterior acetabular wall depth to degrees of the posterior acetabular arc angles of the femoral head at levels of intact, 80 % and 50 % posterior walls were 2.76 ± 0.43 (1.92–3.80), 2.91 ± 0.47 (2.05–3.93) and 3.04 ± 0.52 (2.22–4.46), respectively (Table 2). Pearson correlation coefficients of the constant values among the conversions of the three levels were more than 0.89 (Table 3).
Table 1.
Inter- and intraobserver error of measurements: ICC
| Parameters | Mean (SD, range) | 95 % CI | ICC | ||
|---|---|---|---|---|---|
| Intraobserver 1 | Intraobserver 2 | Interobserver | |||
| Parameters for reliability of acetabular centre | |||||
| OE (mm) | 23.99 (1.82, 20.47–27.69) | 23.05–24.92 | 0.852 | 0.855 | 0.820 |
| OC (mm) | 23.53 (1.84, 20.39–27.45) | 22.59–24.48 | 0.863 | 0.871 | 0.823 |
| Depths of posterior acetabular wall (mm) | |||||
| 100 % (intact wall) | 33.82 (4.30, 25.11–44.77) | 32.71–34.93 | 0.975 | 0.947 | 0.903 |
| 80 % (20 % wall defect) | 26.88 (3.33, 20.08–35.81) | 26.02–27.74 | 0.972 | 0.980 | 0.899 |
| 50 % (50 % wall defect) | 16.91 (2.15, 12.55–22.38) | 16.35–17.46 | 0.902 | 0.951 | 0.827 |
| Degrees of posterior acetabular arc angles of the femoral head | |||||
| 100 % (intact wall) | 92.25 (11.34, 69.00–121.00) | 89.32–95.18 | 0.987 | 0.956 | 0.913 |
| 80 % (20 % wall defect) | 77.42 (10.04, 55.00–99.00) | 74.82–80.01 | 0.974 | 0.972 | 0.883 |
| 50 % (50 % wall defect) | 50.63 (6.58, 37.00–64.00) | 48.93–52.33 | 0.958 | 0.963 | 0.830 |
Table 2.
Constant values of conversion of the posterior wall depths to the posterior acetabular arc angles
| Constant values | |
|---|---|
| Mean (SD, range) | 95 % CI |
| 2.76 (0.43, 1.92–3.80) | 1.92–3.08 |
| 2.91 (0.47, 2.05–3.93) | 2.05–3.93 |
| 3.04 (0.52, 2.22–4.46) | 2.22–4.46 |
Table 3.
Pearson correlation coefficients of the constant values among the conversions of the intact, 50 % and 80 % posterior acetabular walls to posterior acetabular arc angles of the femoral head
| Pearson correlation coefficient | |
|---|---|
| K100 vs K50 | 0.910 |
| K100 vs K80 | 0.935 |
| K50 vs K80 | 0.899 |
K100, K50 and K80 were the constant values of conversions of the intact, 50 % and 80 % wall depths in millimetres to degrees of posterior acetabular arc angles of the femoral head
Discussion
The acetabulum and femoral head have a circular shape and concentric articulation. Hence, the centres of the acetabulum and femoral head are the same point. In unstable posterior fracture-dislocation of the hip, the femoral head displaces posteriorly. So, degrees of the posterior acetabular arc angles of the femoral head were measured by using the acetabular centre as the apex of the angle instead of the femoral head centre. The identification technique of acetabular centre can be applied even in cases of posterior acetabular wall fracture, because anterior and medial walls including the remaining part of the posterior acetabular wall can also be used as references. Moreover, measurement of the posterior acetabular arc angle of the femoral head from a coronal CT scan can be performed although there is obliquity of the pelvis, because the acetabulum has a circular shape and the technology of the CT scan can adjust and reconstruct CT images for correction of pelvic oblique position. The level of the CT cut was selected at the thinnest medial wall and widest acetabulum for measurements. This level represented the centre of the acetabular medial wall and maximal acetabular coverage of the femoral head. The posterior acetabular arc angle of the femoral head was measured by using the acetabular centre as the apex of the angle which covered both the posterior half medial wall and posterior acetabular wall. So, posterior acetabular coverage of the femoral head in terms of arc angle is quantitatively measured and represents the amount of posterior acetabular coverage of the femoral head in cases of posterior fracture-dislocation of the hip associated with posterior acetabular wall fracture. The measurement technique includes total posterior acetabular coverage and needs no normal contralateral acetabulum as calculation reference which is different from acetabular fracture index [2]. Our study selected 20 % and 50 % posterior acetabular wall defects to represent stable and unstable posterior hips from posterior acetabular wall fracture as standard recommendation [1, 3, 4]. The results showed that posterior acetabular arc angles of the femoral head at levels of 20 % and 50 % wall defects were 77.42 and 50.63° on average. The reliability of measurements in the study were assessed using ICC and Pearson correlation coefficient and more than 0.70 was considered strong agreement and correlation [7, 8]. The results showed that the acetabular centre was confirmed reliably by using ICC of OE and OC which represented the radius of the acetabular circle. The ICC showed more than 0.82 which indicated strong reliability [7]. Moreover, the ratio of OC to OE ranged from 0.95 to 1.02 which was in the accepted range of the study. For the other measurements including depth of posterior acetabular wall and posterior acetabular arc angle of the femoral head, the statistical analysis showed strong inter- and intraobserver reliability with an ICC of more than 0.82. The constant values of conversion of the posterior acetabular wall depth to posterior acetabular arc angles of the femoral head had a Pearson correlation coefficient of more than 0.89, which indicated strong correlation [8], all of which confirmed that conversion of posterior acetabular wall depth in millimetres to degrees of the posterior acetabular arc angles of the femoral head is reliable.
In conclusion, the study showed that the posterior acetabular arc angle of the femoral head is a reliable method to assess stability of posterior fracture-dislocation of the hip from posterior acetabular wall fracture and needs no normal contralateral acetabulum as calculation reference. Either stable or unstable posterior acetabular wall fracture can be assessed by more than 77 degrees or less than 50 degrees of posterior acetabular arc angles of the femoral head instead of less than 20 % or more than 50 % posterior acetabular wall defects, respectively.
References
- 1.Keith JE, Jr, Brashear HR, Jr, Guilford WB. Stability of posterior fracture-dislocations of the hip. Quantitative assessment using computed tomography. J Bone Joint Surg Am. 1988;70(5):711–714. [PubMed] [Google Scholar]
- 2.Calkins MS, Zych G, Latta L, et al. Computed tomography evaluation of stability in posterior fracture dislocation of the hip. Clin Orthop Relat Res. 1988;227:152–163. [PubMed] [Google Scholar]
- 3.Vailas JC, Hurwitz S, Wiesel SW. Posterior acetabular fracture-dislocations: fragment size, joint capsule, and stability. J Trauma. 1989;29(11):1494–1496. doi: 10.1097/00005373-198911000-00007. [DOI] [PubMed] [Google Scholar]
- 4.Moed BR, Ajibade DA, Israel H. Computed tomography as a predictor of hip stability status in posterior wall fractures of the acetabulum. J Orthop Trauma. 2009;23(1):7–15. doi: 10.1097/BOT.0b013e31818f9a5c. [DOI] [PubMed] [Google Scholar]
- 5.Kohn E. Geometry (Cliffs quick review) New York: Hungry Minds; 2001. [Google Scholar]
- 6.Matta JM, Merritt PO. Displaced acetabular fractures. Clin Orthop. 1988;230:83–97. [PubMed] [Google Scholar]
- 7.Rosner B. Fundamentals of biostatistics. 7. Boston: Thomson-Brooks/Cole; 2011. [Google Scholar]
- 8.Jackson SL. Research methods and statistics: a critical thinking approach. Belmont: Thomson/Wadsworth; 2009. [Google Scholar]


