

Abstract
Although the reductase domain of cytochrome P450 BM3 (BMR) catalyzes the reduction of cytochrome c and 2,6-dichlorophe-nolindophenol, we observed a catalytically independent loss of activity. By varying the incubation time for the enzyme prior to reaction initiation, we measured an inactivation rate of 0.22 min−1. We hypothesized that either an active BMR dimer dissociates to an inactive monomer or BMR undergoes denaturation. We were not able to trap or destabilize a dimer, and BMR inactivation proved to be irreversible. Addition of excess FMN only slightly decreased the rate of inactivation from 0.22 to 0.13 min−1, indicating inactivation likely does not reflect loss of flavin. When inactivation rates as a function of temperature were fit to the Arrhenius equation, the energy required to inactivate BMR was 9.9 kcal mol−1—equivalent to a few hydrogen bonds. The potential instability of BMR under certain conditions raises concerns for the use of BMR as a model or surrogate P450 reductase in other systems.
Keywords: Cytochrome, P450, BM3, BMR, Reductase, Thermal stability, Inactivation, Domain
Microsomal cytochrome P450s (P450)1 are a ubiquitous superfamily of monooxygenases that play a central role in Phase I drug metabolism, steroidogenesis, metabolism of fatty acids, and conversion of procarcinogens and promutagens to deleterious genotoxic compounds [2]. The enzymatic cycle includes P450 substrate binding, first electron transfer, oxygen binding, second electron transfer, substrate oxidation, and finally product dissociation. The transfer of two electrons is necessary to activate oxygen at the P450 heme active site. The sources of the electrons are the redox partners cytochrome P450 reductase (CPR) and possibly cytochrome b5 in some cases [9]. The flavoenzyme CPR mediates the transfer of a hydride (equivalent to two electrons and a proton) from NADPH to FAD, which then transfers the electrons to FMN based on the redox potential of the flavins [32]. The reduced FMN molecule is then the electron donor for P450 or other electron acceptors. The ability to transfer electrons from CPR to P450 depends on the redox state of CPR and the interface between these enzymes. Poor electron coupling will not only compromise the rate of P450 substrate oxidation, but will result in the formation of reactive oxygen species at the heme site due to the collapse of reactive intermediates [6]. An understanding of the structure, function, and redox reactions of the microsomal P450-dependent monooxygenase system would be an important step toward appreciating the biological role of P450 activity.
A wealth of our knowledge of P450 structure–function relationships derives from studies of bacterial P450s due to their solubility and high expression in recombinant systems. To date, the best available model for the eukaryotic microsomal P450 system is P450 BM3 (119 kDa), a self-sufficient fatty acid monooxygenase from Bacillus megaterium [16,19,20]. P450 BM3 consists of heme- (BMP) and FAD/FMN-containing reductase (BMR) domains linked together on a single polypeptide. This arrangement results in very efficient coupling of electrons during the substrate oxidation [17], a characteristic of an ideal multi-component microsomal P450 complex. The P450 BM3 domains were initially isolated by limited trypsinolysis [20] and later cloned and overexpressed in Escherichia coli [5,13,21]. Being a soluble multidomain electron-transfer protein, this enzyme and the respective domains represent excellent models for studying structure–function relationships in P450s and the mechanism of electron transfer.
Because of the inherent instability of intermediates during O2 activation, the flow of electrons from reductase to P450 is an important determinant in P450 activity and, in some cases, may be rate-limiting [6]. Numerous studies have utilized BMR as a model P450 reductase[5,7,26,27] to assess electron-transfer properties among the flavins and to electron acceptors as well as utilizing BMR as a surrogate reductase [3,8] for the microsomal P450 complex. BMR shares 35% identity and 56% similarity to rat CPR [29], with highly conserved segments that are likely to be involved in the binding of the flavins and pyridine nucleotides [23]. Based on sequence analysis, BMR has a discrete multidomain structure, with an amino-terminal FMN-binding domain and a carboxyl-terminal FAD- and NADPH-binding domain [21] like CPR. This division of structures is common to the FNR (ferredoxin NADP+ reductase) family of flavoprotein oxidoreductases [11]. Despite the low sequence identity between CPR and BMR, these enzymes share a surface of localized negatively charged residues which mediate interactions with P450 [3], although the kinetic and thermodynamic control of the flavins in BMR is significantly different from that in microsomal P450 reductase [26].
In addition, Helvig and co-workers fused microsomal epoxygenase P450 2C11 and BMR to create a self-sufficient catalytic unit [8]. The fusion of P450 2C11 to BMR yielded a protein that metabolized arachidonic acid to products similar to those obtained with reconstituted systems containing P450 2C11 and native rat P450 reductase. The authors suggested that the simpler modular P450 system could then be utilized for cell and/or organ transfection in studies characterizing cDNA-dependent, arachidonic acid monooxygenase-associated phenotypes.
While conducting steady-state experiments monitoring BMR reduction of artificial electron acceptors, we measured a dependence of product formation on the order in which enzyme and substrates were added to the reaction. Specifically, the highest rate of reduction of cytochrome c (cyt c) or dichlorophenolindophenol (DCIP) was measured if BMR was added last to initiate the reaction. Because the latter conditions minimize the incubation of BMR under reactions conditions, we varied the time of BMR incubation prior to reaction initiation and discovered a time-dependent loss of activity independent of catalysis (vide infra). If BMR is to serve as a surrogate for CPR and model reductase for improving our understanding of the P450 monooxygenase system, then the elucidation of the mechanism of BMR inactivation is imperative.
The goals of this study were to characterize the catalytically independent loss of BMR activity and assess potential mechanisms. Because artificial electron acceptors are excellent diagnostic tools for monitoring activity for reductases, e.g., CPR [21,31,33] and BMR [5], we assessed the role of buffer, incubation time, and temperature on BMR activity toward the model proteinaceous substrate, cyt c, and the organic molecule DCIP. We designed experiments to assess whether the catalytically independent inactivation reflected the dissociation of an active BMR dimer or underwent thermal denaturation.
Experimental procedures
Reagents
Terrific broth, ampicillin, isopropyl β-d-thiogalacto-pyranoside (IPTG), lysozyme, buffers, dithiothreitol (DTT), protease inhibitors, and other basic chemicals were purchased from Fisher Scientific (Houston, TX). NADPH, DCIP, cyt c, flavins and 2′,5′-ADP-agarose were obtained from Sigma–Aldrich (St. Louis, MO). The cross-linkers, dithiobis-(succinimidyl propionate) (DSP) and 3,3′-dithiobis-(sulfosuccinimidylpropionate) (DTSSP), were purchased from Pierce Biotechnology (Rockford, IL).
BMR preparation
The following protocol reflects minor alterations of a previously published method [28]. E. coli BL21(DE3) cells were transformed with the plasmid pT7-7-BMR provided courteously by T.L. Poulos (University of Califormia-Irvine) [5] and grown in Terrific Broth (Difco) supplemented with 1.0 mM FMN and 200 μg ampicillin mL−1 at 37 °C. At OD600 between 0.6 and 1.0, BMR production was induced upon addition of IPTG to a final concentration of 1 mM and incubation at 28 °C. After an 18–24 h, cells were harvested by centrifugation using a GS3 rotor at 6000 rpm (6000g) rotor for 10 min at 4 °C.
After discarding the supernatant, the cells were resuspended in 50 mM Tris-acetate, pH 8.0, at 4 °C (or pH 7.2 at 25 °C), 0.25 mM DTT, 0.25 mM EDTA, 250 mM sucrose, and 20% glycerol (v/v) supplemented with fresh lysozyme at a final concentration of 0.1 mg mL−1 and mixed for 30 min at 4 °C. The resulting spheroblasts were harvested by centrifugation as described previously. The supernatant was discarded and the cells were resuspended in 50 mM Tris-acetate, pH 8.0, at 4 °C (or pH 7.2 at 25 °C), 0.25 mM DTT, and 20% glycerol (v/v) with the addition of a protease cocktail (0.4 KIU mL−1 aprotinin, 0.2 mM 4-(2-aminoethyl) benzenesulfonyl fluoride (AEBSF), 0.01 mg mL−1 leupeptin, and 0.05 mg mL−1 benzamidine). The resuspended cells were transferred to a stainless steel beaker on ice and subjected to sonication—four 45 s at setting 7, 100% duty with 1 min rest using the flat tip probe with a Branson 450 sonifer. The resulting lysed cell preparation was subjected to ultra-centrifugation at 35,000 rpm (100,000g) using 50.2Ti at 4 °C for 1 h. To increase the ionic strength of the supernatant following ultracentrifugation, KCl was added to a final concentration of 500 mM.
BMR was isolated from the resulting cell lysate by affinity chromatography. The preparation was applied to a 5 mL 2′,5′-ADP-agarose (Sigma–Aldrich) column previously equilibrated with Buffer A (20 mM potassium phosphate, pH 7.8, 1.0 μM FMN, 0.1 mM DTT, 0.1 mM EDTA, and 10% glycerol (v/v)). The column was then washed with five column volumes of Buffer A, then five column volumes of Wash I (Buffer A with 5 mM adenosine), and finally five column volumes of Wash II (Buffer A with 500 mM potassium phosphate, pH 7.8). BMR was eluted with Elution Buffer (Buffer A with 15 mM 2′/3′-AMP—mixed isomers) and dialyzed against Storage Buffer (50 mM potassium phosphate, pH 7.6, 0.1 mM EDTA, and 20% glycerol (v/v)). The total amount of protein was determined by bicinchoninic acid (BCA) protein assay (Pierce), and BMR was quantitated by flavin absorbance (ε = 21 mM−1 cm−1) [4]. Purity of BMR was assessed by SDS–PAGE analysis.
Catalytic assays
Reductases are capable of transferring electrons to a variety of proteinaceous and artificial acceptors. We have chosen three different reductase substrates to investigate the mechanism underlying BMR inactivation. Due to the redox potential of these compounds, cytochrome c3+ (cyt c) and 2,6-dichlorophenolindophenol (DCIP) are almost exclusively reduced by FMN, whereas potassium ferricyanide (PFC) is reduced predominantly by FAD [21]. Standard reaction conditions were 20 mM KMOPS, pH 7.4, 100 mM KCl at 30 °C unless otherwise specified. The reduction of all three substrates was monitored spectrophotometrically with a Jasco V-550 UV/visible spectrophotometer (Jasco). The reduction of cyt c3+ results in the formation of cyt c2+, which can be monitored continuously at 550 nm (ε550 21 mM−1 cm−1) [14]. For cyt c reactions, final concentrations were 0.3 nM BMR, 20 μM cyt c, and 50 μM NADPH due to high activity. The kinetics of DCIP reduction were assessed spectrophotometrically as loss in signal at 600 nm (ε600 = 21 mM−1 cm−1) [10]. For DCIP reactions, final concentrations were 1.0 nM BMR, 20 μM DCIP, and 25 μM NADPH to minimize the background reaction between NADPH and DCIP and maximize the observed BMR-catalyzed rate of reduction. The FAD activity was assessed by monitoring the reduction of PFC as determined by the decrease in absorbance at 420 nm (ε420 = 1.02 mM−1 cm−1) [12]. For PFC reactions, final concentrations were 5.0 nM BMR, 2.0 mM PFC, and 250 μM NADPH due to low rates of turnover.
The methodology for assessing the loss of BMR activity was the same for all substrates. To obtain the activity for BMR without pre-incubation under reaction conditions, BMR was added last to initiate the reaction. All other reactions were initiated upon addition of NADPH and monitored for 2–5 min until the reaction ran to completion. Each reaction was run in triplicate and the values for either the initial rates or total percent product formed were averaged. To obtain the rate of BMR inactivation, BMR activity was measured following pre-incubation at no less than 10 different times over a 40 min period, and the resulting data were fit to a single exponential decay function. The values for the corresponding rate of inactivation (kinact) and percent of product formed along with the standard error from the fit using GraphPad Prism software.
Cross-linking
To determine if BMR exists as an active dimer, we utilized the cross-linking agents glutaraldehyde and the structurally similar compounds, dithiobis-(succinimidyl propionate) (DSP, Pierce) and 3,3′-dithiobis-(sulfosucc-inimidylpropionate) (DTSSP, Pierce) to trap potential BMR complexes. These reagents react with lysines, but utilize different chemical reactions and spacing between reactive groups. These experiments were performed at high (500 nM) and low (5 nM) enzyme concentrations in reaction buffer. The glutaraldehyde reaction was initiated upon addition of reagent to 40 mM, incubated on ice for 2 h, and then quenched upon addition of Tris–HCl, pH 7.4, at a final concentration of 100 mM. We followed the protocols for DSP and DTSSP cross-linking as provided by the manufacturer. For example, cross-linker was added to the protein samples at a 50-fold molar excess because the concentrations were below 5 mg mL−1. The reactions were carried out on ice for 2 h and then quenched upon addition of Tris–HCl, pH 7.4, at a final concentration of 100 mM. Due to the low concentration of BMR, protein was precipitated by TCA (final 10%). The extent of cross-linking was assessed by SDS–PAGE analysis under both reducing and non-reducing conditions (DTSSP possesses a disulfide bond).
Results and discussion
Like cytochrome P450 reductase (CPR), BMR is capable of transferring electrons not just to P450, but to artificial acceptors, such as cytochrome c3+ (cyt c) and 2,6-dichlorophenolindophenol (DCIP), as well. These molecules serve as model substrates for the reductase to assess how alterations in structure or reaction conditions affect enzyme catalysis. Cyt c is a small protein (12 kDa) capable of undergoing one electron reduction by BMR. Because BMR possesses a negatively charged surface to bind proteinaceous electron acceptors [3], the steady-state kinetics will likely reflect cyt c–BMR binding events as observed for CPR [25,30]. The reduced cyt c then must dissociate to liberate free enzyme. In contrast, DCIP is a small organic molecule lacking a defined binding site on the BMR surface. The events defining the steady-state kinetics for the reduction of these molecules are likely quite different. Our studies utilize this point to illustrate a common mechanism affecting BMR activity.
While monitoring the reduction of cyt c by BMR, we measured a dependence of product formation on the order in which BMR, NADPH, and cyt c were added. Specifically, if BMR was added last to initiate the reaction, we observed 42% conversion of cyt c3+ to cyt c2+, whereas the addition of NADPH or cyt c3+ last resulted in only 30% conversion to product. Because the concentrations of the substrates are the same, one of the distinguishing features among these experiments is the incubation time for BMR under reaction conditions.
The incomplete turnover of the substrate could reflect contribution from catalytically independent and dependent processes; however, the focus of this study was on the mechanism underlying the loss of BMR activity in the absence of catalysis. We simplified the analysis by employing the same substrate concentrations for all experiments, which would provide a common catalytic mechanism during the time course. Although we found no dependence on the observed rate when either substrate was used to initiate the reaction, we added NADPH last to start all reactions. To enable the measurement of catalytic parameters for cross-linking and dilution experiments (vide infra), BMR concentrations were ranged from 0.3 to 5 nM; however, a similar rate of 0.22 min−1 for inactivation was observed regardless of the BMR concentration (data not shown). In other words, the observed effects on catalytic turnover only reflect a catalytically independent process.
To assess the effect of pre-incubation time of the enzyme on reaction kinetics, we added enzyme to the reaction mixture and after varying times the reaction was initiated upon addition of NADPH. Fig. 1A shows that longer pre-incubation times result in a significant decease in BMR activity. A plot of either the initial rates or total amount of product formed as a function of pre-incubation time could be fit to a single exponential (Fig. 1B) resulting in the same rate of BMR inactivation, 0.22 min−1 (Table 1). In other words, the kinetic processes from the initiation of cyt c to the completion of the reaction are affected equally by a catalytically independent rate of inactivation that begins as soon as BMR is added to the reaction mixture. Thus, either technique offers a suitable parameter to monitor the catalytically independent loss of BMR activity. Because the amount of product formed during a full time course is more easily and reproducibly measured, all further studies utilized this methodology.
Fig. 1.

Loss of BMR activity toward cyt c as a function of time in minutes. (A) Time course for cyt c reduction by BMR whereby conditions were 0.3 nM BMR, 20 μM cyt c, and 50 μM NADPH at 30 °C. All reactions were initiated upon addition of NADPH. Numbers indicate the time of incubation of BMR under reaction conditions prior to reaction initiation. (B) Plot of initial rate, 엯, and total amount of product formed, ●, as a function of pre-incubation time. Data were fit to a single exponential decay function.
Table 1.
Inactivation of BMR activity toward cyt c in various buffers
| Buffer | kinact (min−1) | Product formed (%) |
|---|---|---|
| 20 mM KMOPS, pH 7.4 | ||
| 100mM KCl (110mM) | 0.22 ± 0.02 | 37±1 |
| 300mM KCl (310mM) | 0.33 ± 0.05 | 9.0 ±0.5 |
| Potassium phosphate, pH 7.4 | ||
| 50mM (111mM) | 0.16 ± 0.02 | 26±1 |
| 150mM (333mM) | 0.12 ± 0.02 | 8.9 ±0.6 |
BMR inactivation not dependent on cyt c
To assess if BMR inactivation was limited to cyt c reduction, we measured the effects of BMR incubation with cyt c prior to reaction initiation. We found that the presence or absence of cyt c did not prevent the loss in BMR activity, thus potential protein–protein interactions were not sufficient to stabilize BMR. As another control, we pre-incubated cyt c in reaction buffer at 30 °C for 10 min and then initiated a reaction upon addition of NADPH and BMR. The resulting 10% decrease in activity was much less than the 8-fold drop in activity observed during the BMR pre-incubation experiment. Therefore, the lack of a stabilizing affect due to the presence of cyt c did not reflect an alteration of cyt c that prevented turnover of the substrate.
As a complement to the cyt c studies, we performed a similar experiment using DCIP as the reductase substrate (Fig. 2). Like the cyt c assays, the pre-incubation time did adversely affect substrate turnover, although the rate of decay was slower, 0.16min−1 (Table 2). These data clearly implicate a process independent of catalysis as a principle mechanism in BMR inactivation. Such a prospect underscores important concerns regarding the use of BMR as a model P450 reductase for kinetic studies [22] and attempts to engineer fused P450-reductase complexes [8].
Fig. 2.

Loss of BMR activity toward DCIP as a function of time in minutes. (A) Time course for cyt c reduction by BMR whereby conditions were 1.0 nM BMR, 20 μM DCIP, and 25 μM NADPH at 30 °C. All reactions were initiated upon addition of NADPH. Numbers indicate the time of incubation of BMR under reaction conditions prior to reaction initiation. (B) Plot of total amount of substrate depleted, ∎, as a function of pre-incubation time. Data were fit to a single exponential decay function.
Table 2.
Inactivation of BMR activity toward DCIP in various buffers
| Buffer | kinact (min−1) | Substrate depleted (%) |
|---|---|---|
| 20 mM KMOPS, pH 7.4 | ||
| 100mM KCl (110mM)a | 0.22 ± 0.01 | 25± 4 |
| 300mM KCl (310mM) | 0.28 ± 0.03 | 24± 2 |
| Potassium phosphate, pH 7.4 | ||
| 50mM (111mM) | 0.15 ± 0.02 | 30± 2 |
| 150mM (333mM) | 0.20 ± 0.02 | 26± 1 |
Mechanism of BMR inactivation independent of catalysis
The inactivation of BMR may in fact depend on an intrinsic, physical property of BMR. In other words, the conformational identity of the enzyme changes over time to a less active form. The source of the conformational change could be proteolytic cleavage by a contaminating E. coli protease as reported by Miles et al. [15]. Their preparations of BMR yielded a proteolytic fragment of 45 kDa over time. Nevertheless, the addition of various protease inhibitors present during purification (see Experimental procedures) to the cyt c reaction did not affect the observed kinetics (kinact = 0.24 ± 0.05 min−1). In addition, the incubation of BMR for 2 h at 30 °C did not result in the production of a lower molecular weight band as determined by SDS–PAGE analysis (data not shown). Based on these results and earlier studies, we hypothesized that either an active BMR dimer undergoes dissociation to an inactive monomer or the conformational integrity is compromised under the reaction conditions, e.g., through denaturation.
Investigating the possibility of an active BMR dimer
In the context of our studies, a BMR dimer is the only active form of the enzyme. Upon addition of enzyme to the reaction mixture, substrate undergoes turnover, but as time progresses, the BMR dimer dissociates to an inactive monomer effectively decreasing concentration of active enzyme and subsequently the rate of product formation. By the end of the reaction time, all of the BMR dimer has shifted in favor of the monomer leading to the reaction not going to completion. Similarly, the pre-incubation of the more diluted form of BMR would result in a correlation between the time of pre-incubation and the significance in the decrease in activity as observed in Figs. 1 and 2. For this mechanism, the interactions driving the dimerization would have to be non-covalent to enable the monomers to be liberated into solution.
Earlier work by Govindaraj and Poulos [5] demonstrated that BMR can form a homodimer through the formation of intermolecular disulfide bonds. The region responsible for these disulfide linkages is likely the FAD domain of BMR, because when the FAD and FMN domains of BMR are expressed as discrete proteins, only the FAD domain forms disulfide-linked homodimers. SDS–PAGE analysis of our BMR preparation under non-reducing and reducing conditions did not result in the observation of a dimer (not shown), although we normally add the thiol reductant DTT to our protein purification solutions. Structurally and functionally, the formation of the reported BMR dimer is an unintended consequence of the gene construction whereby cysteine(s) is unmasked. P450 BM3 holoenzyme does not form homodimers through disulfide bonds. Rather, P450 BM3 dimerizes through non-covalent interactions [1,5]. A similar mechanism could apply to a dimerization interaction for BMR.
Efforts to trap a BMR dimer by cross-linking
The proposed dimerization of BMR indicates the respective populations of monomer and dimer will depend on the concentration of BMR. The ability to distinguish between these forms of BMR offers the potential opportunity to assess the appropriateness of this mechanism as an explanation for BMR inactivation. In order to obtain a stabilized dimer, we attempted to cross-link BMR using a high concentration of enzyme (500 nM) and 0.5 mM disuccinimidyl suberate (DSS), 0.5 mM dithiobis-(succinimidyl propionate) (DSP), or 40 mM (0.4%) glutaraldehyde. These reagents react with lysines, but utilize different chemical reactions and spacing between reactive groups, which enhances the prospect of trapping a BMR dimer. We also subjected a low concentration sample (5 nM) to these reagents as a control for monomerized BMR. None of these samples demonstrated the formation of a cross-linked species as determined by SDS–PAGE analysis (data not shown). Although these results suggest BMR does not form a dimer, there exists the possibility that lysines involved in the cross-linking reaction are not appropriately positioned to enable the trapping of a dimer.
BMR inactivation not reversible
If the mechanism of inactivation derives from an equilibrium distribution of protein species, such as the equilibrium between an active dimer and an inactive monomer, then the process would be reversible such that activity can be regained under favorable conditions. To test this possibility, we prepared a 500 nM stock of BMR in reaction buffer and stored at 4 °C. Half of the BMR stock was diluted to 5 nM BMR and the cyt c activity of this fraction was determined at 30 °C (final conditions: 5 nM BMR, 25 μM cyt c, and 50 μM NADPH). The diluted stock was incubated at 30 °C for 1 h and then the activity toward cyt c was assayed again. In an effort to regain activity, the diluted stock at 5 nM was reconcentrated to 500 nM BMR using Microfilterfuge tubes with a 10,000 MWCO (Rainin Instrument). The activity of the resulting heat-treated sample was compared to the original 500 nM BMR stock stored at 4 °C. The reconcentration of BMR following incubation of BMR at 30 °C resulted in protein demonstrating only negligible activity (Fig. 3). These data indicate BMR inactivation is irreversible contrary to the prediction from the dimer–monomer model or any equilibrium model.
Fig. 3.
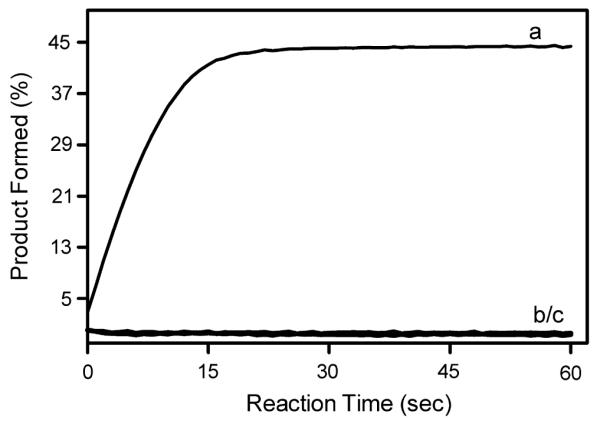
Irreversible loss of BMR activity following incubation under reaction conditions. The reaction conditions for all time courses were 5.0 nM BMR, 20 μM cyt c, and 50 μM NADPH at 30 °C. All reactions were initiated upon addition of NADPH. (a) The activity of BMR toward cyt c was determined from a 500 nM BMR solution stored at 4 °C. (b) After 1 h incubation under reaction conditions, BMR activity was lost. (c) BMR incubated under reaction conditions for 1 h was reconcentrated to 500 nM BMR like the solution used previously. The activity for this sample is shown.
BMR denaturation under reaction conditions
The time-dependent, irreversible loss of activity is a hallmark of inactivation by environmental conditions. During these experiments, BMR undergoes a change in buffer conditions as well as temperature. The activity of BMR in storage buffer at 4 °C did not decrease for at least a month. The change in these conditions could lead to destabilization of BMR to promote the formation of inactive conformers. The process of denaturation can derive from buffer effects as well as changes in temperature, although the former is more often associated with multi-subunit complexes, such as a protein dimer. The following studies assess the effects of the reaction conditions on the loss of BMR activity.
Phosphate buffer slightly stabilizes BMR
One of the changes that occurred during the BMR catalytic reaction was the transition from storage buffer (100 mM potassium phosphate, pH 7.4, 20% glycerol) to reaction buffer (20 mM KMOPS, pH 7.4, 100 mM KCl). The activity of BMR in storage buffer at 4 °C did not decrease for at least a month. Under the conditions for the catalytic assay, the KMOPS/KCl buffer may destabilize BMR relative to potassium phosphate. To assess this possibility, we assayed the activity of BMR toward cyt c3+ and DCIP in 50 mM potassium phosphate, pH 7.4, under identical enzyme and substrate concentrations as described previously. We chose this concentration of potassium phosphate in order to compare buffers at similar ionic strength—110 mM for 20 mM KMOPS, pH 7.4, 100 mM KCl and 111 mM for 50 mM potassium phosphate, pH 7.4, respectively.
The use of the different buffer systems did alter the inactivation kinetics for BMR (Tables 1 and 2). For both reductase substrates the inactivation rate decreased slightly in the phosphate buffer from 0.22 to ~ 0.16 min−1. The similar ~27% decrease indicates phos phate stabilizes BMR relative to the chloride ion, because this effect is observed for substrates whose reductions require different reaction mechanisms. In addition, the percent of cyt c2+ product formed decreases from 37 ± 1 to 26 ± 1% with the use of phosphate as a buffer. Although these experiments were performed at one substrate concentration, a likely explanation for this observation is an increase in the apparent Km value leading to less efficient turnover of substrate under these reaction conditions. The reduction of cyt c3+ likely relies on a binding component between enzyme and substrate that is sensitive to ionic strength, such as electrostatic interactions, which play a role in CPR-catalyzed reduction of cyt c3+ [24]. In contrast, discrete binding interactions are not believed to be necessary for DCIP turnover. As expected, the depletion of DCIP was not affected by the buffer substitution.
Effect of ionic strength on BMR inactivation
The solvation of charged residues introduces an entropic penalty against formation of a salt bridge, thus ion pairs contribute little to protein stability and are typically poorly conserved among homologous proteins. The burial of an ion pair in a low dielectric significantly increases the strength of the bond; however, these interactions are more often observed in protein complexes. For example, electrostatic interactions by ion pairs play an important role in stabilizing CPR–P450 complexes [9] and the P450 BM3 dimer [3]. If BMR exists as a homodimer, then electrostatic interactions may play a role in stabilizing the quaternary structure of the enzyme, a trait sensitive to ionic strength. On the other hand, if BMR undergoes thermal denaturation, the ionic strength would not likely have an affect on the rate of inactivation. For these studies, both buffers were used in order to further assess the significance of the stabilizing effect of phosphate over KMOPS/KCl. We increased the ionic strength of the reaction buffers KMOPS/KCl and potassium phosphate from ~110 to ~320 mM and measured BMR catalytic activity.
Overall, the change in ionic strength affected the rate of BMR inactivation, but the nature of the effects depended on the respective buffer and reductase substrate. When KMOPS/KCl was the reaction buffer, the 3-fold increase in ionic strength resulted in a ~40% increase in the rate of inactivation regardless of substrate (Tables 1 and 2). The use of potassium phosphate resulted in mixed results. Higher ionic strength decreased kinact by 25% when cyt c3+ was the substrate. As a complement to the earlier buffer comparison study, these results provide further support for the stabilizing effect of phosphate over chloride ion. Similar to the trend observed for KMOPS/KCl, the rate of inactivation increased by 25% at higher ionic strength when DCIP was the BMR substrate. Despite the stabilizing effect of phosphate, BMR still undergoes a significant rate of inactivation.
Whereas the amount of DCIP depleted was not significantly affect by the increase in salt, the production of cyt c2+ dropped for both buffer systems from an initial 37% for KMOPS/KCl and 26% for potassium phosphate to a final value of 9%. A stark difference between these substrates is the role of protein–protein interactions in the formation of the collision complex poised for turnover. As demonstrated by ionic strength effects [25] and site-directed mutagenesis of negatively charged residues [30], electrostatic interactions between cyt c3+ and CPR ultimately determine the catalytic efficiency of substrate turnover. Interruption of ion pairs by either technique increases the turnover of substrate (kcat), but decreases the ability to form the Michaelis complex (Km). A similar mechanism may also apply to BMR, such that higher ionic strength results in decreased formation of a catalytically competent complex, while BMR continues to undergo a significant rate of inactivation. The net result is a decreased amount of product formation.
Thermal denaturation of BMR
Although the denaturation of BMR has not been reported, Munro et al. [18] investigated the unfolding and refolding of P450 BM3 holoenzyme in the presence of the chaotropic agent guanidinium hydrochloride (GdnHCl). Enzymatic activities were lost at GdnHCl concentrations too low to cause major changes in secondary structure (0.1–0.5 M); rather, the P450 BM3 inactivation derived from the complete dissociation of FMN by 0.7 M GdnHCl and FAD by 1.5 M GdnHCl, as revealed by fluorescence and visible circular dichroism spectra. The removal of the GdnHCl by dilution to promote refolding resulted in only a small regain in activity. The addition of exogenous flavins increased resistance to denaturation, suggesting that conformational changes may occur subsequent to flavin loss and that these changes were not readily reversed upon dilution of GdnHCl. These studies demonstrated that the most significant effects on P450 BM3 activity occurred with the reductase domain (BMR) at low GdnHCl concentrations.
A similar mechanism may explain BMR inactivation under our reaction conditions, whereby BMR undergoes thermal denaturation instead of denaturation due to a chaotropic agent. For our mechanism, the increase in temperature from storage at 4 °C to the reaction temperature at 30 °C induces thermal fluctuations that destabilize the BMR scaffold leading to loss of the flavins, especially FMN. BMR inactivation is irreversible due to a conformational change that prevents reconstitution of the reductase with a full complement of the flavins. The linking of FMN dissociation and a thermally induced conformational change produces a single step transition from active to inactive states for BMR. This process would result in a single exponential decay in activity as observed for both cyt c and DCIP reduction (vide supra)—two substrates reduced almost exclusively by the FMN domain of BMR. To confirm the temperature dependence of inactivation rather than the dilution of protein (and bound FMN), we assessed the loss of activity for a dilute BMR sample (0.3 nM) in reaction buffer stored for 24 h at 4 °C. This pre-incubation of BMR resulted in only a ~10% decrease in cyt c under standard reaction conditions.
In addition, exogenous flavins should retard the rate of BMR inactivation, although the addition of flavins after denaturation should not result in a regain in activity. As expected, the addition of 1.0 and 0.1 μM FMN to the reaction buffer decreased the rate of BMR inactivation from 0.22 ± 0.2 to 0.13 ± 0.2 min−1 resulting in an increase in cyt c product formation. A lower concentration of FMN (0.01 μM) was not sufficient to stabilize BMR against denaturation. Due to the limited effect of exogenous FMN, it was not possible to titrate FMN in the reaction to obtain an apparent KD based on the stabilizing effect of the flavin. As observed for P450 BM3 following GdnHCl-induced denaturation [18], the addition of 1.0 μM FMN did not reconstitute BMR activity following denaturation (thermal inactivation).
Loss of FAD-mediated activity
Whereas reductase activity is typically measured by activity toward substrates reduced by the reductase FMN moiety, e.g., cyt c and DCIP, thermal inactivation could include the alterations of the FAD-binding domain. To more fully characterize the extent of BMR inactivation, we measured the rate of reduction for potassium ferricyanide (PFC) as a function of incubation time as described for cyt c and DCIP. Based on redox potential (+356mV), PFC is preferentially reduced by the FAD domain [27]. As observed for cyt c and DCIP, activity toward PFC decreased with longer incubation times, a process that could be fit to a single exponential decay (Fig. 4). As the reaction rate fell to a negligible value, the rate of inactivation was determined to be 0.30 ± 0.03min−1. The similarity of this decay rate to that for loss of cyt c or DCIP activity (0.22min−1) indicates the extensive effects of thermal denaturation on BMR function.
Fig. 4.
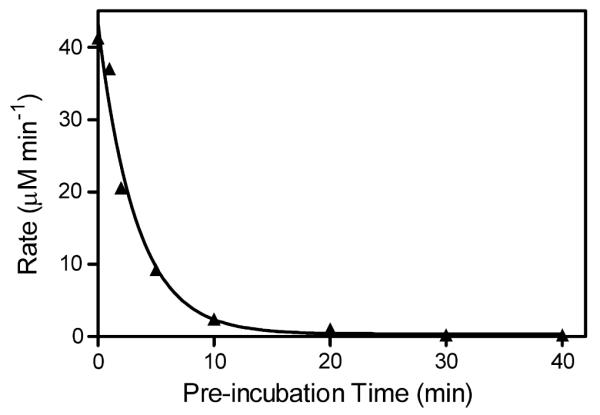
Loss of BMR activity toward PFC as a function of time in minutes. Plot of initial rates, ▴, for PFC reduction as a function of pre-incubation time under the following conditions: 5.0 nM BMR, 2.0 mM PFC, and 250 μM NADPH at 30 °C. All reactions were initiated upon addition of NADPH. Data were fit to a single exponential decay function.
Arrhenius analysis of BMR denaturation
As a two-state system, we were able to assess the energy necessary to inactivate BMR by deriving an Arrhenius plot of the rate of BMR inactivation as a function of temperature. The rate of BMR inactivation toward cyt c was measured from 22 to 36 °C in 2 °C increments. A complementary analysis of the loss in DCIP reduction was not possible due to the complication of the background reaction between DCIP and NADPH, which became comparable to the enzyme-catalyzed reaction at high temperatures.
At the highest reaction temperature (36 °C), we observed a single exponential burst of product formation followed by a linear phase of residual activity (Fig. 5A). The first phase of product formation is consistent with earlier studies at 30 °C in which we characterized the single exponential decay of BMR activity. The residual activity was not expected. Studies at 30 °C did not reveal any residual activity likely due to a more significant contribution of the first phase to substrate turnover when compared to residual activity. For example, over the 5 min time course of the experiment at 30 °C, only 0.14% of the substrate turnover can be attributed to the residual activity. Longer reaction times (10–30 min) were necessary to measure residual activity at temperatures less than 36 °C. With respect to the inactivation experiments, the residual activity did not affect the determination of kinact. The residual activity proved to be linearly dependent on reaction temperature (Fig. 5B, m = 0.86 ± 0.06, R2 = 0.983) suggesting the observed rate derives from a thermostable enzymatic species independent of results attributed to BMR inactivation. Although SDS–PAGE analysis only revealed a single band corresponding to the expected size of BMR, a trace contaminant cannot be ruled out. Alternatively, the inactivation of BMR could reflect the conversion of a very active form of BMR to a much less active form.
Fig. 5.

Residual activity following BMR inactivation of activity toward cyt c. (A) Sample time course for cyt c reduction (0.3 nM BMR, 20 μM cyt c, and 50 μM NADPH at 36 °C) indicating a linear rate of product formation follows an initial burst product. All reactions were initiated upon addition of NADPH. (B) Plot of the observed residual rate as a function of temperature fit to a linear regression.
The rate of BMR inactivation is clearly temperature dependent (Fig. 6A). A replot of the data—ln (kinact) versus reciprocal temperature—provides a linear relationship (Fig. 6B). This representation of the data enables a fit to the Arrhenius equation: ln (kinact) = ln A – Ea/RT, where A is the Arrhenius constant, Ea is the activation energy, R is the perfect gas law constant, and T is temperature (in Kelvin). The activation energy in this equation is the energy necessary to transform BMR from an active state to an inactive state. The value for BMR denaturation is 9.9 ± 0.3 kcal mol−1, which is equivalent to the breakage of a few hydrogen bounds. This value is consistent with the relative ease in which the reductase domain (BMR) of P450 BM3 underwent GdnHCl-induced denaturation [18].
Fig. 6.

Arrhenius analysis of BMR activation. (A) Plot of the rate of inactivation of activity toward cyt c as a function of temperature and (B) replot of the data in order to fit data to a linear regression to obtain Arrhenius parameters (see text).
Concluding remarks
BMR has been utilized by many laboratories as a model reductase to understand the role of electron-transfer events in P450 catalysis [22] and serve as a surrogate electron donor in reconstituted P450 complexes including the creation of P450-reductase fusions [8]. Because the integrity of BMR is critical for these applications, we embarked on a series of studies to characterize the dependence of the observed catalytically activity on the time BMR was incubated under reaction conditions prior to reaction initiation. We found no evidence to support the transition from an active dimer to an inactive monomer; rather our data were most consistent with irreversible thermal denaturation of BMR. Our data indicate that BMR undergoes inactivation through thermal denaturation. This prospect raises concerns for the use of BMR as a model or surrogate P450 reductase in other systems.
Acknowledgments
We thank Stacie M. Bratton for her preliminary studies characterizing BMR inactivation. Sandra Eliaz is acknowledged for the preparation of BMR used in all the studies.
Footnotes
This work was supported by National Institutes of Health NCRR COBRE Grant 1 P20 RR15569-02 and American Cancer Society Institutional Research Grant 91-021-09.
Abbreviations used: P450, cytochrome P450; CPR, cytochrome P450 reductase; NADPH, nicotinamide adenosine dinucleotide phosphate (reduced); NADP+, nicotinamide adenosine dinucleotide phosphate (oxidized); FAD, flavin adenine dinucleotide; FMN, flavin mononucleotide; BMR, P450 BM3 reductase; cyt c, cytochrome c3+; DCIP, 2,6-dichlorophenolindophenol; PFC, potassium ferricyanide, K3Fe(CN)6; DTT, dithiothreitol; EDTA, ethylenediaminetetraacetic acid; TCA, trichloroacetic acid; DSP, dithiobis-(succinimidyl propionate); DTSSP, 3,3′-dithiobis-(sulfosuccinimidylpropionate).
References
- [1].Black SD, Martin ST. Biochemistry. 1994;33:12056–12062. doi: 10.1021/bi00206a007. [DOI] [PubMed] [Google Scholar]
- [2].Danielson PB. Curr. Drug Metab. 2002;3:651–697. doi: 10.2174/1389200023337054. [DOI] [PubMed] [Google Scholar]
- [3].Davydov D, Kariakin AA, Petushkova NA, Peterson JA. Biochemistry. 2000;39:6489–6497. doi: 10.1021/bi992936u. [DOI] [PubMed] [Google Scholar]
- [4].French JS, Coon MJ. Arch. Biochem. Biophys. 1979;195:565–577. doi: 10.1016/0003-9861(79)90383-7. [DOI] [PubMed] [Google Scholar]
- [5].Govindaraj S, Poulos TL. J. Biol. Chem. 1997;272:7915–7921. doi: 10.1074/jbc.272.12.7915. [DOI] [PubMed] [Google Scholar]
- [6].Guengerich F. J. Biol. Chem. 2002;383:1553–1564. doi: 10.1515/BC.2002.175. [DOI] [PubMed] [Google Scholar]
- [7].Haines DC, Sevrioukova IF, Peterson JA. Biochemistry. 2000;39:9419–9429. doi: 10.1021/bi000255p. [DOI] [PubMed] [Google Scholar]
- [8].Helvig C, Capdevila JH. Biochemistry. 2000;39:5196–5205. doi: 10.1021/bi992578v. [DOI] [PubMed] [Google Scholar]
- [9].Hlavica P, Schulze J, Lewis DF. Inorg. Biochem. 2003;96:279–297. doi: 10.1016/s0162-0134(03)00152-1. [DOI] [PubMed] [Google Scholar]
- [10].Ide S, Hayakawa T, Okabe K, Koike M. J. Biol. Chem. 1967;242:54–60. [PubMed] [Google Scholar]
- [11].Karplus P, Bruns CM. J. Bioenerg. Biomembr. 1994;26:89–99. doi: 10.1007/BF00763221. [DOI] [PubMed] [Google Scholar]
- [12].Kurzban GP, Strobel HW. J. Biol. Chem. 1986;261:7824–7830. [PubMed] [Google Scholar]
- [13].Li HY, Darwish K, Poulos TL. J. Biol. Chem. 1991;266:11909–11914. [PubMed] [Google Scholar]
- [14].Massey V. Biochim. Biophys. Acta. 1959;34:255–256. doi: 10.1016/0006-3002(59)90259-8. [DOI] [PubMed] [Google Scholar]
- [15].Miles JS, Munro AW, Rospendowski BN, Smith WE, McKnight J, Thomson AJ. Biochem. J. 1992;288:503–509. doi: 10.1042/bj2880503. [DOI] [PMC free article] [PubMed] [Google Scholar]
- [16].Miura Y, Fulco AJ. Biochim. Biophys. Acta. 1975;388:305–317. doi: 10.1016/0005-2760(75)90089-2. [DOI] [PubMed] [Google Scholar]
- [17].Munro A, Leys DG, McLean KJ, Marshall KR, Ost TW, Daff S, Miles CS, Chapman SK, Lysek DA, Moser CC, Page CC, Dutton PL. Trends Biochem. Sci. 2002;27:250–257. doi: 10.1016/s0968-0004(02)02086-8. [DOI] [PubMed] [Google Scholar]
- [18].Munro AW, Lindsay JG, Coggins JR, Kelly SM, Price NC. Biochim. Biophys. Acta. 1996;1296(2):127–137. doi: 10.1016/0167-4838(96)00061-1. [DOI] [PubMed] [Google Scholar]
- [19].Narhi LO, Fulco AJ. J. Biol. Chem. 1986;261:7160–7169. [PubMed] [Google Scholar]
- [20].Narhi LO, Fulco AJ. J. Biol. Chem. 1987;262:6683–6690. [PubMed] [Google Scholar]
- [21].Oster T, Boddupalli SS, Peterson JA. J. Biol. Chem. 1991;266:22710–22725. [PubMed] [Google Scholar]
- [22].Peterson JA, Sevrioukova I, Truan G, Graham-Lorence SE. Steroids. 1997;62:117–123. doi: 10.1016/s0039-128x(96)00169-9. [DOI] [PubMed] [Google Scholar]
- [23].Ruettinger RT, Wen LP, Fulco AJ. J. Biol. Chem. 1989;264:10987–10995. [PubMed] [Google Scholar]
- [24].Sem DS, Kasper CB. Biochemistry. 1995;34:12768–12774. doi: 10.1021/bi00039a037. [DOI] [PubMed] [Google Scholar]
- [25].Sem DS, Kasper CB. Biochemistry. 1994;33:12012–12021. doi: 10.1021/bi00206a002. [DOI] [PubMed] [Google Scholar]
- [26].Sevrioukova I, Shaffer C, Ballou DP, Peterson JA. Biochemistry. 1996;35:7058–7068. doi: 10.1021/bi960060a. [DOI] [PubMed] [Google Scholar]
- [27].Sevrioukova I, Truan G, Peterson JA. Biochemistry. 1996;35:7528–7535. doi: 10.1021/bi960330p. [DOI] [PubMed] [Google Scholar]
- [28].Sevrioukova IF, Hazzard JT, Tollin G, Poulos TL. J. Biol. Chem. 1999;274:36097–36106. doi: 10.1074/jbc.274.51.36097. [DOI] [PubMed] [Google Scholar]
- [29].Sevrioukova IF, Peterson JA. Biochimie. 1995;77:562–572. doi: 10.1016/0300-9084(96)88172-7. [DOI] [PubMed] [Google Scholar]
- [30].Shen AL, Kasper CB. J. Biol. Chem. 1995;270:27475–27480. doi: 10.1074/jbc.270.46.27475. [DOI] [PubMed] [Google Scholar]
- [31].Smith GCM, Tew DG, Wolf CR. Proc. Natl. Acad. Sci. USA. 1994;91:8710–8714. doi: 10.1073/pnas.91.18.8710. [DOI] [PMC free article] [PubMed] [Google Scholar]
- [32].Strobel HW, Hodgson AV, Shen SJ. NADPH cytochrome P450 reductase and its structural and functional domains. In: de Montellano P.R. Ortiz., editor. Cytochrome P450: Structure, Mechanism, and Biochemistry. Plenum Press; New York: 1995. pp. 225–244. [Google Scholar]
- [33].Vermilion JL, Coon MJ. J. Biol. Chem. 1978;253:2694–2704. [PubMed] [Google Scholar]