Abstract
Long before the introduction of matrix-assisted laser desorption (MALDI), electrospray ionization (ESI), Orbitraps and any of the other tools that are now used ubiquitously for proteomics and metabolomics, the highest performance mass spectrometers were sector instruments, providing high resolution mass measurements by combining an electrostatic energy analyzer (E) with a high field magnet (B). In its heyday, the four sector mass spectrometer (or EBEB) was the crown jewel, providing the highest performance tandem mass spectrometry using single, high energy collisions to induce fragmentation. During a time in which quadrupole and tandem triple quadrupole instruments were also enjoying increased usage and popularity, there were nonetheless some clear advantages for sectors over their low collision energy counterparts.
Time-of-flight mass spectrometers are high voltage, high vacuum instruments that have much in common with sectors and have inspired the development of tandem instruments exploiting single high energy collisions. In this retrospective we recount our own journey to produce high performance time-of-flights and tandems, describing the basic theory, problems and the advantages for such instruments. An experiment testing impulse collision theory (ICT) underscores the similarities with sector mass spectrometers where this concept was first developed. Applications provide examples of more extensive fragmentation, side chain cleavages and charge-remote fragmentation, also characteristic of high energy sector mass spectrometers. Moreover, the so-called curved-field reflectron has enabled the design of instruments that are simpler, collect and focus all of the ions, and may provide the future technology for the clinic, for tissue imaging and the characterization of microorganisms.
The time-of-flight mass spectrometer
Without question, the time-of-flight mass spectrometers of today play a key analytical role in proteomics research. They are also the instruments of choice for molecular imaging; and a number of instrument manufacturers now provide systems specifically aimed at the detection and identification of bioagents and microorganisms. It was the introduction of matrix-assisted laser desorption/ionization in 1986 (1,2) that provided the demand for a high mass instrument to record the molecular masses of singly-charged peptides, proteins and oligonucleotides; and the time-of-flight was particularly well-suited to this new pulsed ionization technique. Completion of the human genome sequence and the subsequent interest in the human proteome provided the incentive to improve instrument performance, particularly mass resolution. Improvements to the Mamyrin reflectron (3) combined with the use of delayed extraction techniques (4–6) provided significant increases in mass resolution. With the introduction of orthogonal extraction/acceleration methods by Guilhaus (7) in 1989 and Dodonov (8) in 1991, and subsequent improvements, the time-of-flight is now regarded as a high mass resolution analyzer, with resolution specifications currently quoted in some commercial instruments as one part in 40,000. Time-of-flight mass analyzers are used in hybrid instruments to enhance the mass resolution of quadrupoles and ion traps. Here, like the Orbitrap and the Fourier transform mass spectrometer (FTMS), ion selection and activation are carried out in a first mass analyzer (such as a linear ion trap or LTQ) and the products are recorded in high resolution in the time-of-flight. Coupled with RF ion guides, the orthogonal time-of-flight configuration is not confined to laser desorption, but can accommodate atmospheric ionization methods and continuous (i.e. not pulsed) sources such as electrospray.
Such high performance was not always the case, and indeed the time-of-flight mass spectrometer was not always held in high regard. The earliest time-of flight instrument suggested by Stephens in 1946 (9), and the velocitron constructed by Cameron and Eggers in 1948 (10) could barely distinguish the components of air. Far better performance was realized using the time-lag focusing scheme devised by Wiley and McLaren (11) in 1955, which led to the first successful commercial instrument manufactured by the Bendix Corporation. This instrument had a mass resolution of (at best) 500 and a mass range of about 400 Da, due in large part to the boxcar recording method that required thousands of cycles to construct a single mass spectrum. Thus, it earned its reputation as a low duty cycle, low resolution instrument. But, in their groundbreaking paper Wiley and McLaren provided a comprehensive analysis of the factors affecting mass resolution that continues to guide instrument design to this day and, indeed, anticipated many of the techniques which we now use. Specifically, for a simple time-of-flight mass spectrometer, an ion of mass/charge m/e should have a flight time:
| [1] |
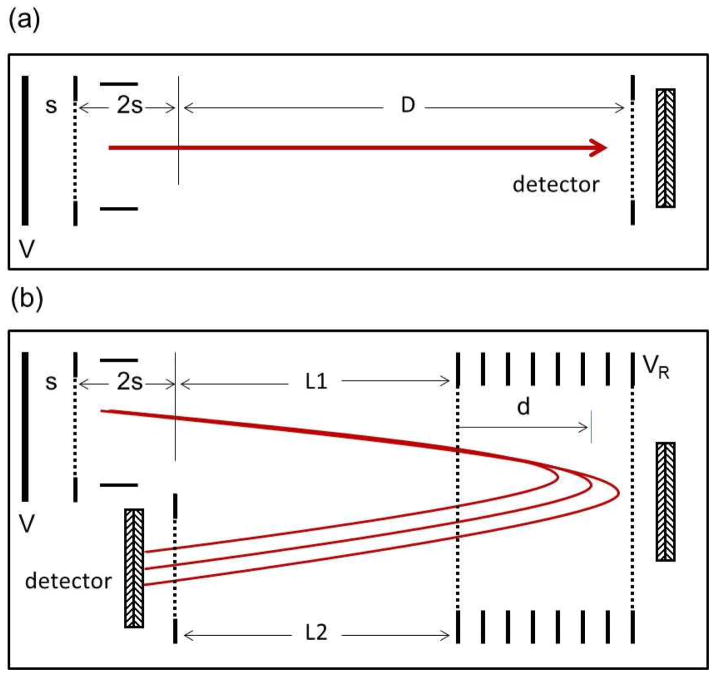
where V is the accelerating voltage and D is the drift length (Figure 1a). Indeed calibration of the mass scale uses this simple square root relationship. However, the ion source is not a point source; ions formed in different locations s0 of a source of length s are accelerated to different kinetic energies eE0, and the ionization process itself may impart additional initial kinetic energy U0. Thus, a somewhat simplified version of the Wiley and McLaren analysis for an ion of mass m:
| [2] |
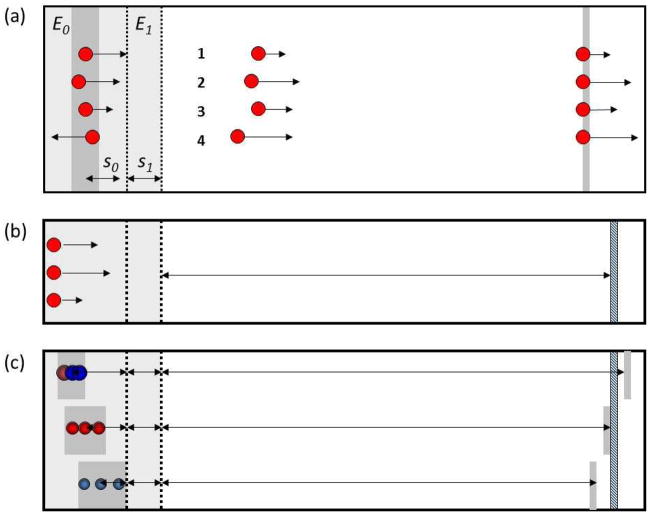
suggests that there will be a distribution in flight times Δt for ions of the same mass but having a spread in initial positions Δs0 and initial kinetic energies ΔU0, and that this is responsible for the loss in mass resolution. While it is not possible to simultaneously correct for these two independent (uncorrelated) distributions of space and energy, their time-lag focusing approach (Figure 2a) greatly improved mass resolution, and presaged the now common delayed extraction technique used in MALDI instruments (4–6). In MALDI instruments the formation of ions on a flat surface by a laser effectively eliminates one of these distributions (Δs0), and so greatly improves our chances of focusing ions in time (Figure 2b). When the delayed extraction pulse is applied, the ions have distributed themselves in space, but in a manner in which the faster ions have moved farther along the extraction axis than the slower ions (Figure 2c). Thus, the spatial and energy (velocity) distributions are correlated as described by Colby and Reilly (12). Space-velocity correlated distributions can be corrected to much higher order, though the correction (usually by tuning the delay time) is mass dependent. In addition to providing the 15,000 to 30,000 mass resolutions now commonly claimed on commercial instruments of this design, delayed extraction provides an effective mode for focusing in the first mass analyzer of a tandem instrument (as will be described below), in which the delay time can be optimized for the mass-selected ion.
Figure 1.
Diagram of (a) a simple “linear” time-of-flight mass spectrometer and (b) a single-stage reflectron mass spectrometer.
Figure 2.
(a) the time-lag focusing scheme developed by Wiley and McLaren to focus ions with different initial kinetic energies (ΔU0) and positions (Δs0) in the ion source, (b) the simplified initial condition in a MALDI experiment dominated by a kinetic energy spread, and (c) the location of ions of different masses following application of the delayed extraction pulse.
The benefits of orthogonal extraction are consistent with the Wiley/McLaren analysis. In instruments using this approach, ion guides collimate and inject ions through a small orifice that results in a very finely focused beam that presents a minimal spatial distribution to the orthogonal extraction direction. The kinetic energy distribution is in fact a velocity distribution that in this case has components in only one direction, so it is minimized as well. But, in the tandem instruments we describe below, we will utilize pulsed extraction schemes exclusively, as most orthogonal extraction configurations limit the possibilities for very high energy, single collisions.
From the bones of dinosaurs
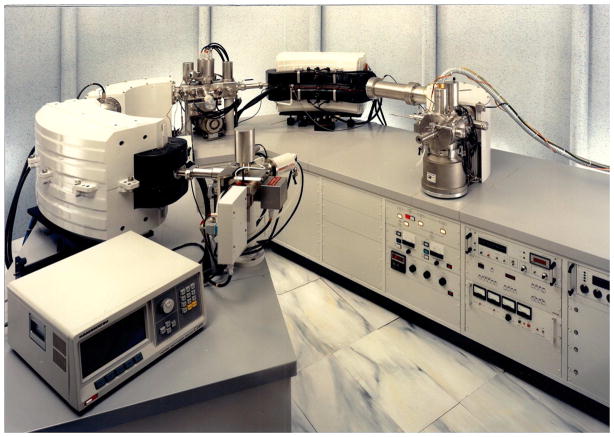
Time-of-flight mass spectrometers have much in common with sector instruments, those mass spectrometers using combinations of electrostatic energy analyzers (ESA) and magnetic fields (B) that are not as familiar to mass spectroscopists in this period of MALDI and electrospray. But they were the highest performance instruments for electron impact (EI) and chemical ionization (CI), for GCMS, and for the high mass accuracy measurements used to determine elemental compositions of synthetic and natural products. Mass spectrometers comprising two, three and four sectors enjoyed this exalted position well into the 1980s (Figure 3), when fast atom bombardment (FAB) had extended their utility into the range of biological macromolecules (13,14).
Figure 3.
Kratos four sector (EBEB) mass spectrometer with fast atom bombardment (FAB) ion source. (Photo courtesy of Andrew Bowdler, Kratos Analytical Instruments).
In fact, in his 1946 report (9), Stephens noted his intent was to build a mass spectrometer without a magnet. Similar to a sector instrument, an accelerating voltage would eject ions of all masses from the source; but since ions of different mass would have different velocities, measuring their flight times across a fixed distance would obviate the need for the magnet. He went on to build an instrument that accelerated ions to constant momentum (15), a scheme that produces a linear relation between flight time and mass, but most time-of-flight instruments accelerate ions to a constant energy:
| [3] |
where e is the charge on an ion and V is the accelerating voltage. Since the velocity v = D/t this leads to the time-of-flight equation:
| [4] |
This same high voltage acceleration to a constant energy is used on magnetic sector instruments. There the ion will move in a circle under the influence of the magnetic field, so that the substitution mv2/R = e(v⃗XB⃗) then leads to the mass equation (the so-called B2 scan):
| [5] |
where B is the strength of the magnetic field and R is the radius of the ion trajectory through the magnet. Both kinds of instruments follow a quadratic mass scale. In both sector and time-of-flight instruments, mass accuracy and mass resolution depend upon ions that have the same kinetic energy (eV) as they enter the mass analyzer, though there are some analogous means (electrostatic analyzers and reflectrons, respectively) used to correct for small differences in kinetic energy. Thus, though sector instruments are now regarded as dinosaurs in most of the mass spectrometry world, they nonetheless influenced much of our own efforts to develop a tandem time-of-flight instrument. What they have in common is the ability to carry out high energy collisions, using the high kinetic energy obtained from their acceleration from the source to induce fragmentation. In the process, in both instruments, product ion masses carry only a proportional part of their original kinetic energy and those same energy devices (electrostatic analyzers and reflectrons, respectively) must be adjusted to reveal and focus the product ions.
Prompt and nearly prompt fragmentation
In 1980 we constructed a laser desorption time-of-flight mass spectrometer using a CVC Products (Rochester, NY) model 2000 mass spectrometer with an extended (2 meter) flight tube and a Tachisto (Needham, MA) model 215G pulsed carbon dioxide laser with a wavelength of 10.6 microns and a pulse width of 40 ns. Spectra were obtained initially using a Polaroid camera recording of the oscilloscope traces, but the instrument was then upgraded with a Biomation (Cupertino, CA) model 8100 waveform recorder with a sampling rate of 100 Msamples/sec and a spectral record length of 2 Kbytes (Figure 4). Laser firing and data acquisition were controlled by an Apple (Cupertino, CA) II+ microcomputer.
Figure 4.
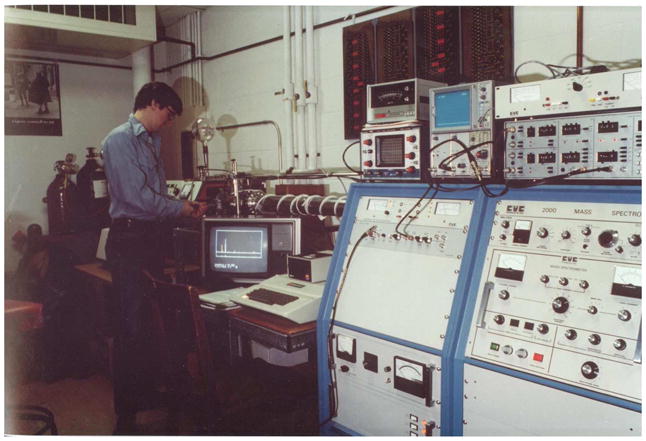
The author’s first laser desorption time-of-flight mass spectrometer, a CVC Products model 2000 TOF with a Tachisto pulsed carbon dioxide laser, operated here by Richard van Breemen.
In both sector and time-of-flight mass spectrometers, fragmentation must occur in a field-free region to be recorded. Fragmentation during ion acceleration will result in an indeterminant mass measurement. In the time-of-flight mass spectrometer, where the accelerating field is imposed across the source, fragmentation must therefore occur very promptly within the nanosecond or subnanosecond time frame of the laser pulse. Alternatively, it is possible to utilize a short delay before imposition of the accelerating field to ensure that the resultant fragment ions will be accelerated to the same energy as their molecular precursors (16).
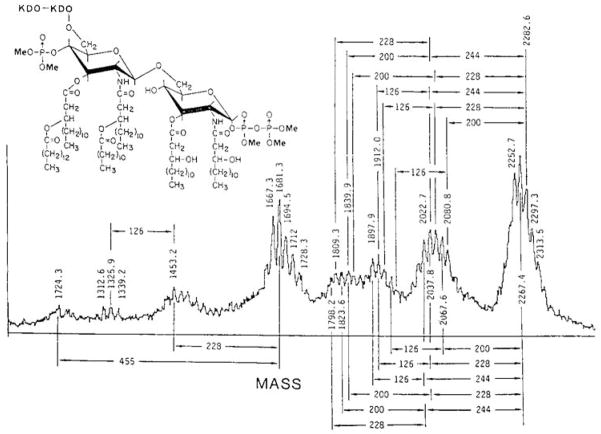
The CVC 2000 was in fact equipped with time-lag focusing whose range we extended up to 50 microseconds. Figure 5 shows an infrared laser desorption (IRLD) mass spectrum of the lipid A from E. coli obtained 20 microseconds after the laser pulse. Lipid A is the highly acylated diglucosamine anchor for the larger lipopolysaccharide structures found on the outer layer of the outer membrane of gram negative bacteria. Lipid A is in fact a highly heterogeneous mixture with respect to the number and kinds of fatty acyl groups and phosphates attached to the diglucosamine. The mass spectrum shows the microheterogenous mixture of the hexa-acylated species carrying three phosphates. The upper mass portion of the spectrum shows a mixture of molecular ions, followed by losses of fatty acyl groups linked to the 3 and 3′ positions. The peaks at m/z 1224.3, 1453.2 and 1681.3 are ions from two-bond ring cleavages (17). A systematic nomenclature for such cleavages had not been developed at that time, but the subsequent Costello and Domon nomenclature (18) would designate these as 0,2A2, 1,3A2 and 3,5A2, respectively, with all occurring on the reducing sugar. It should also be noted that these nearly prompt fragmentation processes would later be known as in-source decay (19). Neither MALDI nor the current delayed extraction methods had been introduced at this time; nonetheless, we were able to obtain amino acid sequence fragment spectra for a number of peptides using the infrared laser and classic time-lag focusing (20).
Figure 5.
Infrared laser desorption (IRLD) time-of-flight mass spectrum of the hexa-acyl lipid A mixture from E. coli. Reprinted with permission from Reference 17.
Metastable fragmentation
The flight tube on a time-of-flight mass spectrometer is a field free region. Fragmentation occurring in the flight tube can also be observed, but only if the instrument is equipped with a reflectron (Figure 1b). When a molecular ion fragments in this region: m1 → m2 + n, the product ions will have the same velocities and thereby the same times of flight in a simple linear (non-reflectron) time-of-flight. However, the kinetic energy of the product ion E2 will be only a portion of that of the molecular ion E1:
| [6] |
When these lower energy product ions enter the reflectron, they will not penetrate the retarding field as deeply, will re-emerge sooner than their molecular counterparts and thus have a shorter flight time. For a simple, single-stage reflectron (Figure 1b) the flight time of any molecular ion is given by:
| [7] |
where L1 and L2 are the drift lengths before and after the reflectron and d is the penetration depth. Note that the molecular ions follow the same square root law as the linear time-of-flight instrument described by Equation [1]. The flight time for the product ion is:
| [8] |
and in this case the mass scale for m2 is linear. The generation of product ion mass spectra from processes occurring in the drift region (rather than the source) is generally known as post-source decay (PSD), a term introduced by Spengler et al. (21). It is of course, in sector parlance, a classic example of metastable fragmentation or unimolecular decomposition. The relationship between the molecular and product ion flight times can be somewhat better appreciated from Figure 6. The molecular ions at m/z 2000, 3000 and 4000 are shown on a quadratic scale. The product ions from each of these are on a linear scale that extends from the flight time of the precursor to approximately one-half the flight time of the precursor. This occurs because molecular ions in a single-stage reflectron spend one half their time in the field-free region and half in the reflecting region; and in only the reflecting region is there time dispersion between the molecular ion and its products. Note from the example in Figure 6 that the molecular ion with m/z 2000 is observed at 4 microseconds, while the m/z 2000 products from m/z 3000 and 4000 are at (approximately) 7 and 12 microseconds, respectively. This overlapping of mass scales is resolved only when there is good precursor mass selection.
Figure 6.
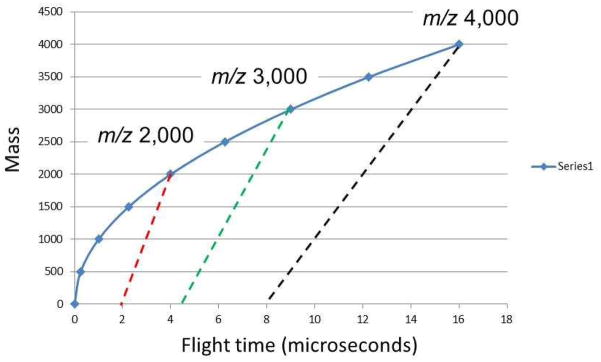
Mass/charge vs. flight time scan lines for MS and MS/MS spectra on a single-stage reflectron mass spectrometer. The blue line illustrates the quadratic time dependence of the molecular ion mass, while the red, green and back dashed lines represent the linear dependence of fragment ions resulting from the decay of m/z 2,000, m/z 3,000 and m/z 4,000, respectively.
One of the drawbacks of PSD is the need to retune or step the reflectron voltage to bring different mass ranges of the product ion mass spectrum into focus. This is not surprising, when one considers the analogous situation in double focusing mass spectrometers with an electrostatic energy sector (E) and a magnetic sector (B). Fragmentation in the so-called first field-free region (FF1) just outside the ion source produces ions with lower kinetic energy, according to Equation [6], and this requires scanning of the electric sector as well as the magnetic field, the so-called B/E scan:
| [9] |
Since this is a product ion scan, the values of B and E are those of the molecular ion m1 and are used to establish the B/E ratio which is constant for all products m2 of that ion. In addition, Equation [6] suggests that both B and E are scanned linearly. In the time-of-flight mass spectrometer, the inability to focus all the product ions simultaneously arises from the fact that the lower mass ions do not reach the optimal penetration depth d of the reflectron, but instead turn around at a more shallow depth of (m2/m1)d. Lowering the reflectron voltage in steps enables different segments of the mass range to turn around at the optimal depth. The common element in both sector and time-of-flight mass spectrometers is that the kinetic energy (velocity in the case of the time-of-flight and momentum in the case of the sector) is an integral part of the mass measurement. Fragment ions in both instruments have proportionately lower kinetic energies that must be accommodated by the energy focusing elements, i.e. the electrostatic energy analyzer or reflectron, to maintain focus and accurate mass measurement. In both instruments, the “scan” law is quadratic for the molecular ions and linear for the product ions.
Of course another downside to post-source decay is that mass selection occurs within the flight tube region L1 where the ions are in poor temporal focus, a problem not unsimilar to the difficulties in both mass selection and resolution observed for B/E scanning. In their day, the ultimate solution for a truly high performance tandem mass spectrometer was a four sector (EBEB) instrument comprising two double focusing instruments to resolve both precursor and product ions, separated by a collision chamber. Our first design for a tandem time-of-flight mass spectrometer was in fact intended to be the analog of that four sector mass spectrometer, with the capability of carrying out single, high energy collisions of mass-selected molecular ions.
The TOF version of a four sector tandem mass spectrometer
It is common to refer to an ion’s kinetic energy as the collision energy in a CID experiment. However, the real energy available to induce fragmentation in a collision between a molecular ion M and a neutral target n is the relative energy (Erel) in the center-of-mass frame:
| [10] |
where Elab is the laboratory energy and is close to the ion kinetic energy if the target is at rest or (in the case of a collision gas) thermal. Thus, there is not a specific number or quantity on the instrumental scale that defines a high energy collision, as this depends upon the mass of the molecular ion and the collision gas. As shown in Table 1, for instruments with kilovolt collision energies in the laboratory frame, the energy available for collisional excitation decreases dramatically for large proteins.
Table 1.
Relative collision energies (Erel) in the center-of-mass frame at different laboratory energies (Elab) for the collision of protein molecular ions with helium gas.
| Protein | MW | Laboratory collision energies | ||
|---|---|---|---|---|
| 1 keV | 8 keV | 20 keV | ||
| Substance P | 1,348 | 2.97 ev | 23.7 ev | 59.4 ev |
| Ubiquitin | 8,566 | 0.47 ev | 3.7 ev | 9.3 ev |
| Cytochrome C | 12,328 | 0.32 ev | 2.6 ev | 2.5 ev |
| C fragment of tetanus toxin | 51,819 | 0.08 ev | 0.6 ev | 1.5 ev |
| Bovine serum albumin | 66,430 | 0.06 ev | 0.5 ev | 1.2 ev |
Low energy collisions are not ineffective. If they are very low, in the thermal range (0.03 ev), then they have a cooling effect such as is observed in ion guides and ion traps using helium bath gas. In the few ev range the internal energy of the molecular ion is increased, and fragmentation occurs usually after a large number of collisions occur within a short time frame.
However the other requirement for kilovolt instruments (sectors and time-of-flights) is that fragmentation occurs from a single collision. This ensures that the velocity (or momentum) of the molecular ion is minimally altered by the collision, so that the product ion mass measurements can be based upon the product ion energies. In actuality there are small kinetic shifts from the collision, and the fragmentation process itself may partition the collision energy into internal modes as well as into the kinetic energies of the product ion and neutral fragment. But, for the tandem time-of-flight mass spectrometer, a design that ensures a single collision is a requirement. At the same time, there are advantages to high energy collisions that have been observed for as long as mass spectroscopists have compared sector instruments and quadrupoles. Among these are charge-remote fragmentation processes as described by Gross, et al. (22).
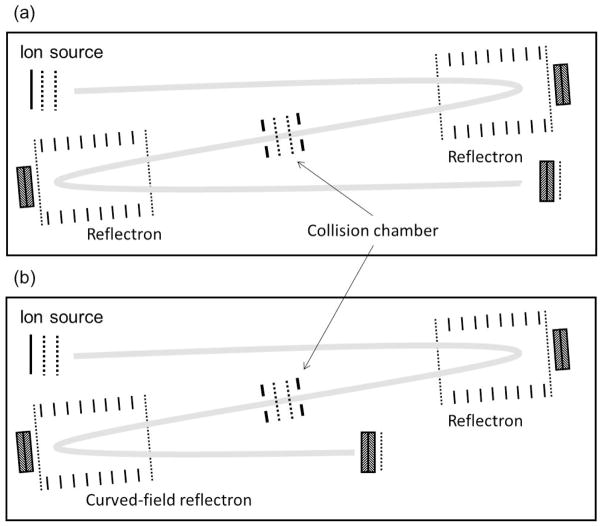
The first versions of the tandem time-of-flight mass spectrometer constructed in our laboratory in 1993 were configured in a z-geometry with either two dual-stage or two single-stage reflectrons (23,24, Figure 7a). The accelerating voltage was 5 kV and the total length only 80 cm. While the tandem instrument provides better mass selection capability than the post-source decay method on a single time-of-flight analyzer, the second mass analyzer still follows a linear law for product ions [Equation 8]. Unless there are other solutions, this will require stepping the reflectron voltage to focus the mass range. This is again reminiscent of four sector mass spectrometers in which the second two sectors were scanned as a linear B/E scan. As an alternative, we initially employed a technique, also used in four sector instruments, in which the precursor ions are decelerated prior to collision and the product ions reaccelerated after the collision. This approach is used in some form in current commercial tandem time-of-flight instruments specifically to avoid the need for scanning the reflectron voltage, and was accomplished in our first tandem by designing the instrument such that the two mass analyzers (including both their drift and reflecting regions) were independently, electrically floatable from each other, the ion source and the collision region (25).
Figure 7.
Schematic diagrams of the Z-geometry tandem time-of-flight mass spectrometers developed in our laboratory. (a) tandem with two single stage reflectrons. (b) tandem with a single stage reflectron in MS1 and a curved-field reflectron in MS2, illustrating the shortened exit drift region.
The curved-field reflectron
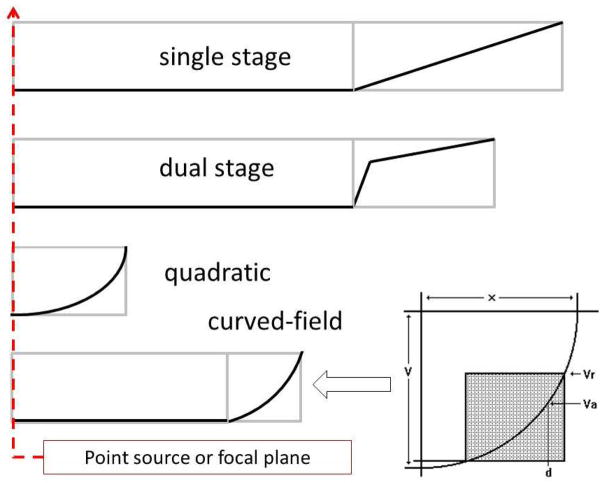
Reducing the ion kinetic energy, and thereby the collision energy, was not particularly attractive for a single, high energy collision instrument, so we considered the use of a quadratic reflectron as the second mass analyzer. Originally described by Mamyrin (3), the quadratic reflectron focuses ions independent of the ion kinetic energy, but the severe quadratic voltage profile along its center axis is accompanied by a radial field that deflects off-axis ions and severely reduces ion transmission. Quadratic reflectrons also do not include the linear drift regions L1 and L2. If the quadratic reflectron was coupled directly to the exit of the collision region and fragmentation induced in the collision cell was less than prompt, then fragmentation would occur within the quadratic field and not be time focused. Thus, we developed the so-called curved-field reflectron (26,27), a reflectron with a more moderate non-linear axial field that would focus ions over a broad kinetic energy range, accommodate a somewhat shorter drift region as part of the mass analyzer, and have high ion transmission. In the single-stage reflectron the voltage V is linear with reflectron depth d, i.e. V = ad, in the quadratic reflectron V = ad2, and in the curved-field reflectron it follows the arc of a circle. Figure 8 compares these voltage profiles, and as shown in Figure 7b, the drift length L2 is considerably shorter while the region L1 provides opportunities for sustained fragmentation.
Figure 8.
Voltage profiles along the center axis for a single-stage, dual stage, quadratic and curved-field reflectron.
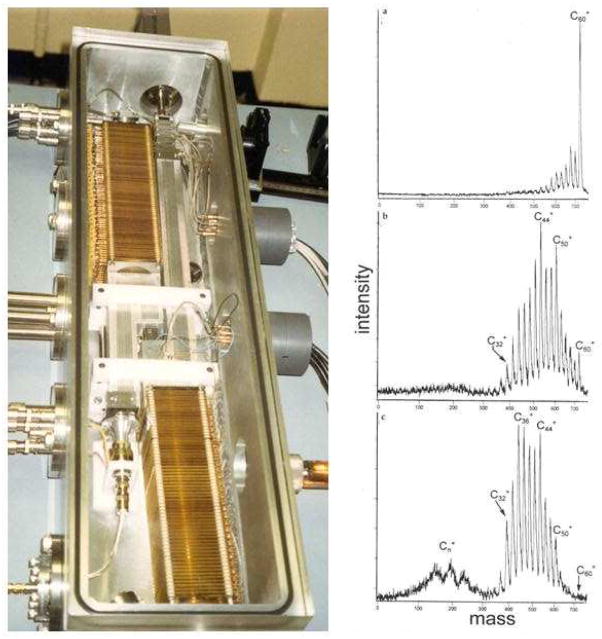
Figure 9a shows the final assembled tandem time-of-flight instrument. It used a pulsed gas valve that introduced helium (or heavier gases) into an “open” collision area for a few milliseconds during each measurement cycle. As the laser repetition rate in this case was 1 Hz, this enabled the instrument to maintain high 10−6 torr vacuum without differential pumping. At the same time, as shown for the MS/MS spectra of C60 in Figure 9b, the instantaneous collision gas pressure in the collision area was sufficient to attain nearly 100% attenuation of the primary ion beam (28).
Figure 9.
The tandem time-of-flight mass spectrometer with a single-stage reflectron (MS1) and a curved-field reflectron (MS2). MS/MS spectrum of C60 (fullerene) at 10%, 80% and 98% attenuation of the molecular ion. Reprinted with permission from Reference 28.
The TOF/RTOF configuration
There are a number of reasons that a dual reflectron tandem, or RTOF/RTOF, configuration is not ideal. The correction of the initial kinetic energy spread by lengthening the trajectories in the reflecting field also increases the exiting beam diameter (see Figure 1). While inconsequential for detecting ions on a multi-chanelplate array surface, the broader profile does not provide a suitable input to a second reflectron, and in particular to a second reflectron in which a non-linear field requires ions to enter tightly about the center axis. Focusing with electrostatic lenses is possible, but in general the introduction of fields in the vicinity of the fragmentation region may alter the clean partitioning into product ion kinetic energy [Equation 6] that results from a single high energy collision and is critical to calibrating the product ion masses.
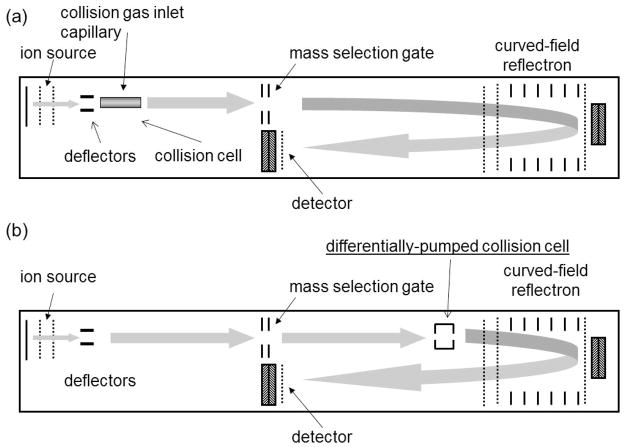
A design that would effectively address the objective of single high energy collisions was one in which the focusing of the precursor ion beam is unaltered by any fields after the ions leave the source area (Figure 10a) and a collision region that is located within a field-free region encompassed by the drift region D of a linear TOF mass analyzer and the first field-free region L1 of the second reflectron mass analyzer. This TOF/RTOF configuration is also a feature of the commercial tandem TOF mass spectrometers by Applied BioSystems and Bruker Daltonics that were being introduced at this time (29,30). However, the ABI instruments incorporated precursor ion deceleration, and pulsed (second source) ion reacceleration to enable focusing of the product ions by the reflectron (31); and the Bruker instrument incorporated a so-called lift cell (30) to increase the product ion kinetic energies. In those instruments, the final collision energies in the laboratory frame were 1–2keV and 8 keV, respectively, and both schemes were intended in some way to address the limited energy bandwidths of single- and dual-stage reflectrons. In the TOF/RTOF developed in our laboratory, ions initially accelerated to 20 keV pass through the collision cell with that energy, and both precursor and product ion velocities remain unchanged as they enter the reflectron. The resultant very wide range of product ion kinetic energies – anywhere from a few eV to 20 keV – could then be focused by the curved field reflectron and without resorting to any additional ion deceleration, acceleration (lifting) or pulsing. Our initial TOF/RTOF instrument is shown in Figure 10a and was constructed as a modification of a commercial Kratos (Manchester, UK) AXIMA CFR+ mass spectrometer equipped with a curved-field reflectron (32). Used in an MS/MS mode the mass selection gate is located at the focal point for MS1 determined by the delayed extraction voltage and timing, a point that is also the origin point for the curved-field reflectron analyzer. Interestingly, in a design in which there are no post source electrostatic fields to alter the ion velocity prior to entering the reflecting field, the collision chamber can in principle be located anywhere between the source exit and the reflectron entrance, and before or after the mass selection gate. Thus, a relatively simple modification to the commercial instrument was possible by mounting the collision chamber on top of the ion source and focusing stack (32).
Figure 10.
(a) initial configuration of the tandem TOF/RTOF instrument as described in Reference 32. (b) configuration of the Shimadzu AXIMA TOF2 mass spectrometer.
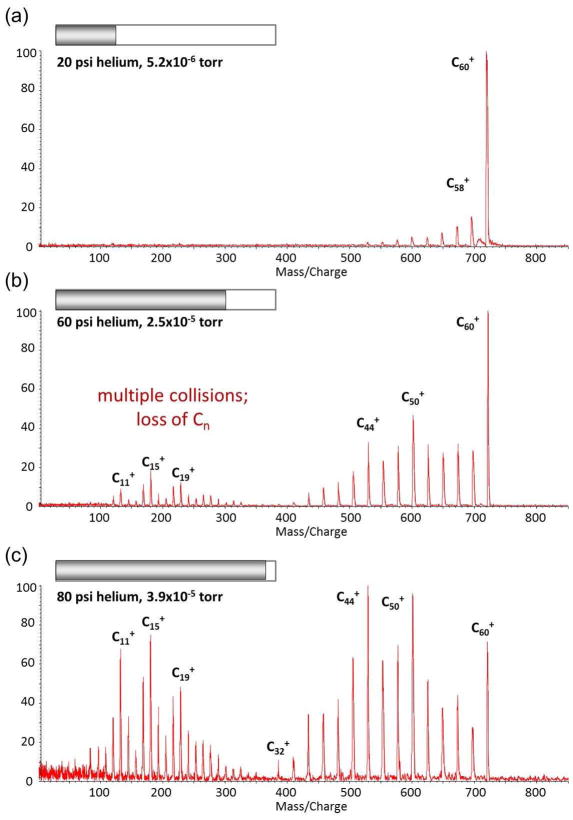
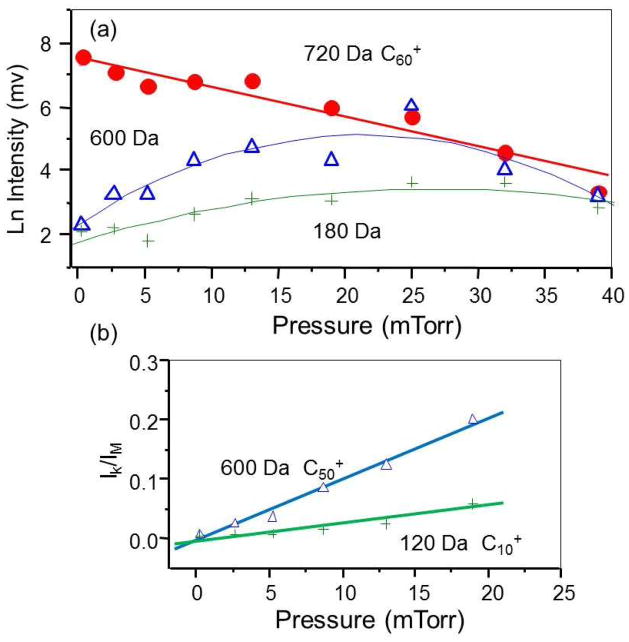
Figure 11 shows the MS/MS spectra of fullerene (C60) at different helium collision gas pressures. At the lowest pressure, the fragment ion series observed are losses of two carbon units (C2) characteristic of a single high energy collision (33–35), in this case a single 20keV collision. At higher helium collision gas pressures, multiple collisions lead to catastrophic breakup of the C60 structure and lower mass fragments differing by a single carbon (32–35). Figure 12 plots the relative intensities of the molecular ion C60+ at m/z 720, the high mass fragment ion C50+ at m/z 600 and the low mass fragment C10+ at m/z 120 as a function of the collision gas pressure. The log plot of the attenuation of the molecular ion intensity (I) is linear:
| [11] |
from which one can determine the collision cross section:
| [12] |
Figure 11.
MS/MS spectra of C60 at three different collision gas pressures, obtained on the tandem TOF/RTOF instrument.
Figure 12.
(a) attenuation of the molecular ion of C60 at m/z 720 and increase in the formation of fragment ions at m/z 600 and 180 as a function of target gas pressure. (b) ratio of intensities of m/z 600 and 120 over total ion intensity in the lower pressure region.
Similarly, using the slopes for the formation of the C50+ and C10+ ions:
| [13] |
| [14] |
one can calculate their fragmentation cross sections as well:
| [15] |
| [16] |
Collision energetics
The relative position of the collision cell along the field-free region encompassed by the drift regions D and L1 (Figure 10a) does have a small effect on the observed flight times of the product ions. An ion formed as a result of a collision will in fact have a final velocity (and kinetic energy) that is slightly lower than that of the same ion formed by unimolecular decomposition, though this effect is intentionally minimized in tandem instruments by utilizing a light target, i.e. helium. When the collision chamber is located close to the source region this small difference in velocity, occurring over a long drift region, results in a measurable time difference in the detection of these two types of ions. The magnitude of this time difference will of course depend upon the details of the collision, i.e. whether it is elastic or partially inelastic, whether the collision kinetic energy is converted to internal energy of the ion projectile or target gas, whether it is a head-on or glancing collision, etc. Thus, in a far more complete treatment than we can provide here, we reported the use of this instrument configuration to test the energetics for collisions between C60+ and both helium and neon (36), and in particular to test these results against the impulse collision theory (ICT) described by Derrick and others (37) for high energy collisions on sector mass spectrometers.
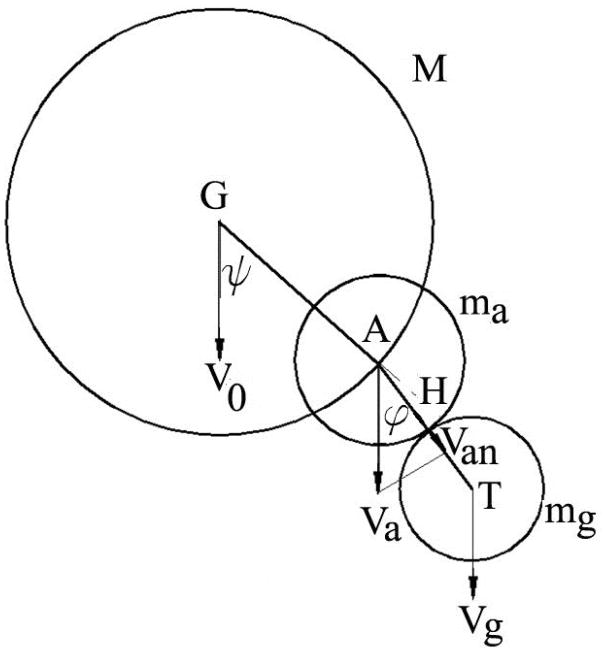
In a simple elastic collision the impact between the intact ion projectile (in this case C60+) and the target gas (He or Ne) partitions the kinetic energy between the two collision partners without imparting internal energy to either. The velocity of the C60+ ion in the laboratory (instrument) frame is reduced, while the target atom, initially at rest, is increase in a manner in which there is both conservation of kinetic energy and momentum. In impulse collision theory, the initial interaction is assumed to be between a single atom (or other portion) of the molecular ion and the target. If that initial reaction is elastic, then the velocity VICT of the ion after the collision is:
| [17] |
where V0 is the initial velocity, M is the mass of the C60+ molecular ion, mg is the mass of He or Ne, ma is the mass of a carbon atom, and ϕ is the collision angle as shown in Figure 13. The difference in the ICT and initial velocities results in different flight times that are recorded as apparent mass shifts. Then, knowing the effective distance traveled after the collision and the time differences, it is possible to calculate the changes in velocity resulting from the collision.
Figure 13.
Schematic of the interaction between a molecular ion M and target gas T according to impulse collision theory. The initial interaction is between a portion of the projectile molecule having a mass of ma and the target of mass mg.
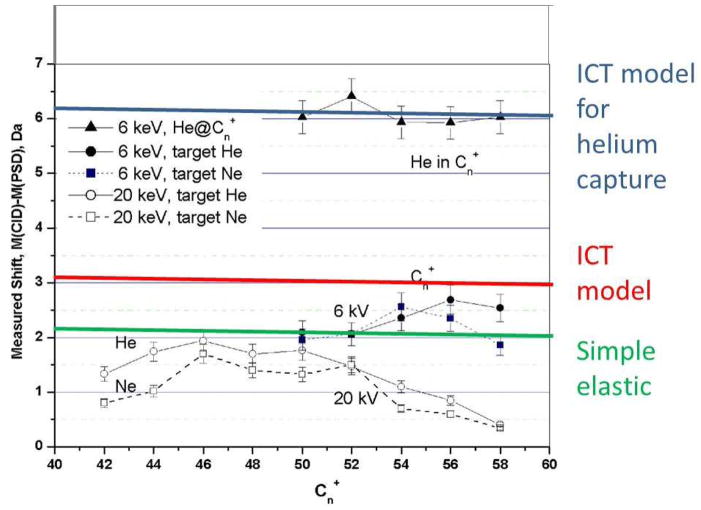
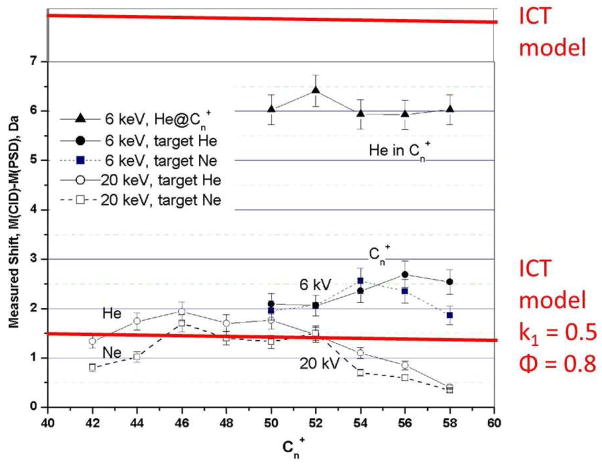
Collisions were carried out between C60+ and both helium and neon, and with collision energies (in the laboratory frame) of 6 keV and 20 keV. Since the ions are not decelerated, these collision energies were determined by setting the initial accelerating voltage at the source. Figure 14 shows the apparent mass shifts (relative to the calibrated fragment masses from metastable decomposition) for the higher mass fragments observed under single collision conditions: C50+ to C58+ for collision energies of 6 keV, and C42+ to C58+ for collision energies of 20 keV. Interestingly, at the lower collision energies capture of a helium atom is observed as (C50 + He)+ to (C58 + He)+ ions (38–45). Consistent with ICT theory, the apparent mass shift is about 6 Da, corresponding to the increase in actual mass of 4 Da and the slowing of the complex as it picks up the extra mass. Figure 14 also shows the predicted mass shifts for the formation of fragments, assuming a simple elastic collision model and an elastic ICT model. For the larger fragments C50+ to C58+ the results are generally consistent with a mix of these two models, perhaps involving an initial interaction with more than a single carbon atom.
Figure 14.
Comparison of the measured mass shifts for fullerene collision products and those predicted for collisions with helium gas using simple elastic and ICT models.
Figure 15 shows that an elastic ICT model predicts a much larger mass shift for collisions with the heavier gas neon than is actually observed. Thus, a more general treatment considers that the initial interaction as partially inelastic:
| [17] |
where k is the restitution coefficient. Using a value of k = 0.5 and ϕ = 0.8, for example, the observed mass shift is consistent with an inelastic ICT model. One possible explanation for this inelasticity is that the collision results in electronic excitation of the neon atom. This is not unreasonable; the ionization potential for neon (16.6 ev) is lower than that of helium (19.8 ev) as are its low lying electronic energy levels. The values of k = 0.5 and ϕ = 0.8 are of course only typical, as a wide range of values are possible. In that respect it should be noted that fragment ion peaks, from which the mass shifts are estimated, are broad and noisy - consistent with a range of k and ϕ values and the lower energy levels of neon.
Figure 15.
Comparison of the measured mass shifts for fullerene collision products and those predicted for collisions with helium gas using ICT models..
Applications of high energy collisions
In our laboratory instrument the long path length between the collision chamber and the reflectron provided the observable differences between the flight times of metastable and collision induced fragments that enabled this study of collision energetics. But, for a structural, analytical instrument a spread in arrival times will adversely affect mass resolution and calibration accuracy. Both the Bruker and ABI instruments provide a means for eliminating the products of metastable fragmentation, thus insuring well-resolved and calibrated CID peaks (29,30). Shimadzu Corporation developed the AXIMA TOF2 and AXIMA Performance tandem instruments with a curved-field reflectron design, and minimized this flight time spread by locating the collision cell close to the entrance to the reflecting field (Figure 10b). This has another beneficial effect. In our laboratory instrument the major ions losses arose from low angle scattering from the collision and the fact that this occurred very far ahead of the reflecting field. Such losses are minimized in this new configuration.
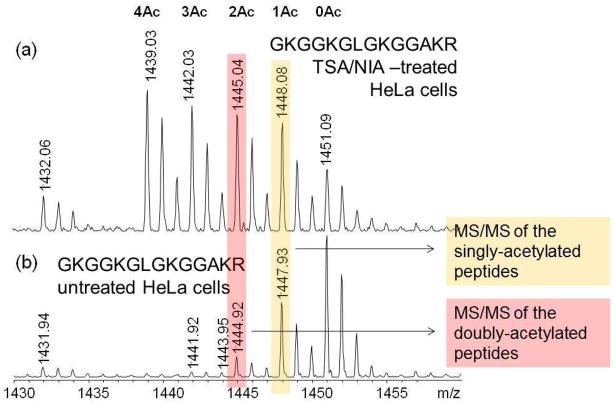
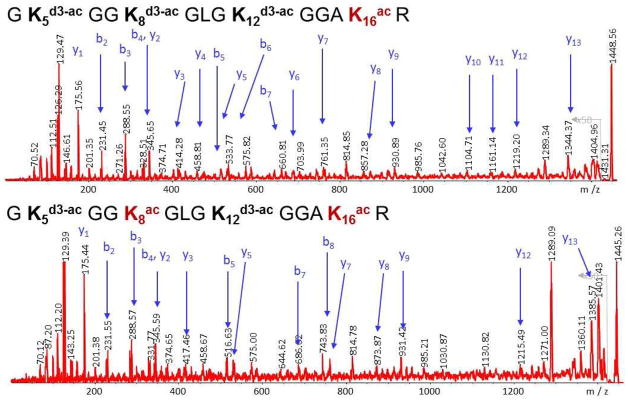
A major interest in our laboratory has been the structure of histones, specifically the identification and location of post-translational modifications (known as marks) and their quantitation. Two copies of the major core histone proteins, H2A, H2B, H3 and H4, make up the structure of chromatin that serves as the scaffold for double-stranded DNA. Alterations in histone marks affect DNA expression, replication or silencing, and/or help recruit or otherwise communicate with other DNA-binding proteins. The major histone modification is acetylation at lysine residues, which are particularly plentiful in histones. Thus, we have adopted a method suggested originally by Smith et al. (46) that involves deuteroacetylation of all unmodified lysines, followed by tryptic digestion (at arginine residues only) and mass spectral analysis and quantitative comparison of the resultant fully acetylated and/or deuteroacetylated tryptic fragments differing by 3 mass units (47). Figure 16 shows the MS spectra of the histone H4 tail peptide GKGGKGLGKGGAKR that includes four lysine residues, which can be unmodified or mono- to tetra-acetylated, a total of 16 isomeric forms. The histone H4 tail peptide obtained from HeLa cells treated with the histone deacetylase (HDAC) inhibitors TSA and NIA populate all16 isomeric forms. Note that in the mass spectrum in Figure 16a the highest molecular mass is the unmodified peptide with four deutroacetylated lysines, while the fully acetylated species has the lowest molecular mass. In untreated HeLa cells (Figure 16b), only monoacetylated and diacetylated species are observed. Figure 17 shows the high energy CID MS/MS spectra of the monoacetylated and diacetylated species obtained on a Shimadzu AXIMA TOF2 mass spectrometer. The observed b-series and y-series ions are consistent with the major isoforms being monoacetylation at K16 and diacetylation at K8 and K16 (48).
Figure 16.
Mass spectra of the molecular ion region of deuteroacetylated histone H4 tail peptide illustrating the molecular forms arising from 0 to 4 acetylations. Reprinted with permission from Reference 48.
Figure 17.
MS/MS spectra of the singly and doubly acetylated molecular ions shown in Figure 16. Reprinted with permission from reference 48.
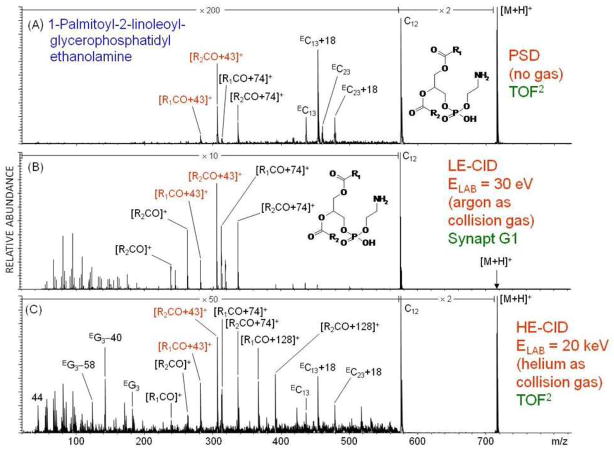
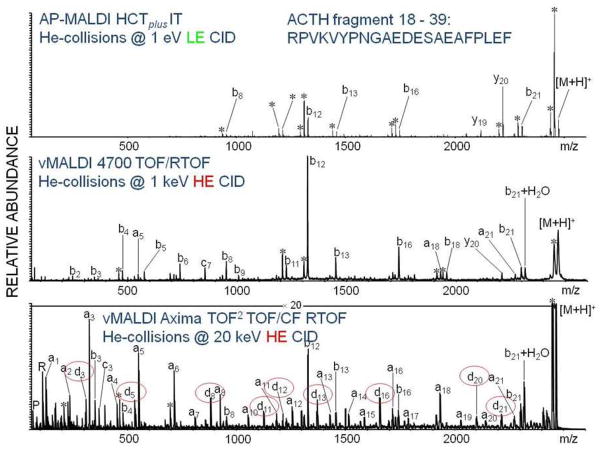
Allmaier et al. (49,50) have carried out a number of direct comparisons of MS/MS spectra obtained by post-source decay, low energy collisions and high energy collisions. Figure 18 compares MS/MS spectra for the phosphoethanolamine (PE): 1-palmitoyl-2-linoleoyl-glycerophosphatidylethanolamine. In this case, both the PSD and high energy helium CID were carried out on the Shimadzu TOF2, while the low energy CID was obtained from a Waters (Milford MA) Synapt G1. Interestingly, while the PSD provides several high mass fragments not observed in the low energy CID mass spectrum, the high energy CID shows substantial fragmentation across the entire mass range. Figure 19 compares a low energy CID mass spectrum of the ACTH fragment RPVKVYPNGAEDESAEAFPLEAF obtained on a Bruker Daltonics (Billerica, MA) AP-MALDI HCTplus ion trap mass spectrometer with high energy CID obtained on an ABI 4700 and Shimadzu TOF2. Comparison of the spectra resulting from 1 keV and 20 keV collisions shows additional d-series in the latter, as higher energy CID increases the amount of side-chain fragmentation.
Figure 18.
Comparison of PSD, low energy CID and high energy CID for a phosphatidylethanolamine (PE). Reprinted with permission from Reference 50.
Figure 19.
Comparison of low and high energy CID mass spectra of ACTH fragment. Reprinted with permission from Reference 49.
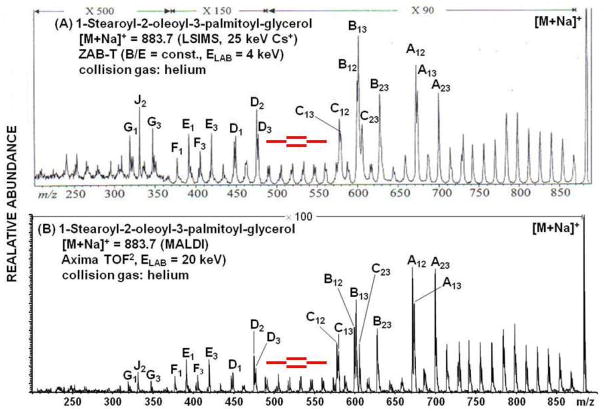
Lastly, we reproduce from Allmaier et al (50) an example of charge remote fragmentation that underscores the similarities between high energy CID on time-of-flight and sector instruments. As described by Gross et al. (51) fragmentation of a long chain fatty acid will occur at all bonds along the chain, remote from the charge center at the carboxylate group; and that is useful specifically for the location of double bonds on the fatty acid. In this example, MS/M spectra of the M+Na+ ion of the triglyceride 1-stearoyl-2-oleoyl-3-palmitoyl-glycerol show fragment ions across the entire structure, revealing the double bond in the oleic acid moiety CH3(CH2)7CH=CH(CH2)7COOH. The top spectrum was obtained as a constant B/E linked scan on a VG (Manchester, UK) ZAB-T triple sector using a 25 keV Cs+ liquid secondary ion mass spectrometry (LSIMS) source and 4 keV collisions (50). The bottom spectrum was obtained on a Shimadzu TOF2 at 20 keV collision energy.
Summary and prospective
This is an exciting period for mass spectroscopists who, among other things, enjoy access to a very wide array of truly high performance instruments. Much of the development of instrumentation, and the concomitant software, databases and other tools, has been driven as we have noted by proteomics. In this field, LCMS instruments with multiplex advantage (qTOFs, Orbitraps and FTMS) enjoy a significant and effective role in high performance global and discovery analyses. At the same time, triple quadrupoles and hybrids that include ion traps are emerging as the best approaches for targeted and quantitative proteomics using selected reaction monitoring. Within this picture, MALDI instruments have a unique position when solid samples or surfaces are involved. These include primarily tissue imaging (52,53) and the coupling of protein (and other) microarrays with mass spectrometry (54).
Figure 21 shows mass spectra of the peptides captured on four 200 μm spots on a protein microarray containing (A) anti-HA, (B) anti-cmyc, (C) anti-V5 and (D) no antibody, respectively. Each of the three spots with antibody (QED, San Diego) show capture of a single peptide species from bovine plasma doped with all three peptides. The MS/MS spectra (E–G), obtained on a TOF2 mass spectrometer provide sufficient fragmentation to verify their identities. In this example it is important to note that the small sample size limits the number of productive laser shots possible and the intensity of the mass spectra. A unique feature of the design of this high energy CID instrument is that metastable fragment ions are not suppressed from the mass spectra, but reinforce the ion signal. This is possible because there is no deceleration, reacceleration or repulsing of the ions before or after collision and the curved-field reflectron focuses all fragment ions in the same manner. All ions are collected, using a design that is far simpler than that found in other commercial instruments. As proteomics moves from discovery, validation and on to the clinic, this will be important for the design of multiplexed diagnostic tests utilizing solid phase, antibody and other capture arrays coupled with mass spectrometry, and obviating the need for time-consuming chromatography. While antibody tests alone are being used increasingly for diagnostics, specificity is highly variable and the MS and MS/MS provide definitive verification of the target as well as variants, post-translational modifications and other structural changes that may themselves be diagnostic.
Figure 21.
MS (A–D) and MS/MS (EG) spectra obtained on a protein microarray with immobilized antibodies. Reprinted with permission from Reference 54.
In the research arena, high energy collisions complement the low energy collisions used on ion trapping instruments. For peptides with labile post-translational modifications, high energy collisions will often yield more complete amino acid sequence fragmentation. An increase in side chain fragmentation using high energy collisions can be used to distinguish leucine/isoleucine of glutamine/lysine, while an increase in internal and low mass immonium ions can provide amino acid compositions that resolve sequence ambiguities.
Figure 20.
Comparison of high energy CID spectra of a triglyceride obtained on a sector (A) and a tandem time-of-flight (B) mass spectrometer. Reprinted with permission from Reference 49.
Acknowledgments
More than 80 graduate, undergraduate and summer students, postdoctoral fellows and research associates have trained in my laboratory. I acknowledge all of their contributions to the success of our various academic and research ventures and activities. Of special mention for their contributions to this topic I included Richard Van Breemen, Jean-Claude Tabet, Jeff Honovich, Ihor Lys, William Martin and Bernhard Spengler, all of whom work on our IR laser time-of-flight mass spectrometer. Timothy Cornish was of course responsible for the development of the curved-field reflectron, and constructed our first Z-tandem that was used by Marcela Cordero for the analysis of fullerenes. Sergei Ilchenko developed the TOF/RTOF that was precursor to the current commercial TOF2.
I acknowledge as well the contributions from Kratos Analytical in providing a CFR instrument from which we constructed the TOF/RTOF as well as technical support from Andy Bowdler; and Gunter Allmaier has managed to exploit far better than us the benefits of high energy collisions.
Our laboratory has over the years been supported by grants and contracts from the National Science Foundation (NSF), the National Institutes of Health (NIH), the Defense Advanced Research Projects Agency (DARPA), the Defense Threat Reduction Agency (DTRA) and the National Aeronautics and Space Administration (NASA). Of special relevance to this subject we acknowledge NSF 8016440, NIH R01GM64402 and NIH contract (VanEyk, PI) HHSN268201000032C.
Footnotes
A retrospective based upon the author’s ASMS Distinguished Contribution Award address at the 59th Annual Meeting on Mass Spectrometry and Allied Topics, May 2011..
References
- 1.Karas M, Hillenkamp F. Laser desorption ionization of proteins with molecular masses exceeding 10,000 daltons. Anal Chem. 1988;60:2299–2301. doi: 10.1021/ac00171a028. [DOI] [PubMed] [Google Scholar]
- 2.Tanaka K, Waki H, Ido Y, Akita S, Yoshida Y, Yoshida T. Protein and polymer analyses up to m/z 100,000 by laser ionization time-of-flight mass spectrometry, Rapid Commun. Mass Spectrom. 1988;2:151–153. [Google Scholar]
- 3.Mamyrin BA, Karataev VI, Shmikk DV, Zagulin VA. The mass-reflectron, a new nonmagnetic time-of-flight mass spectrometer with high resolution. Soviet Physics JETP. 1973;37:45. [Google Scholar]
- 4.Whittal RM, Li L. High-Resolution Matrix-Assisted Laser Desorption/Ionization in a Linear Time-of-Flight Mass Spectrometer. Anal Chem. 1995;67:1950–1954. doi: 10.1021/ac00109a007. [DOI] [PubMed] [Google Scholar]
- 5.Brown RS, Lennon JJ. Mass Resolution Improvement by Incorporation of Pulsed Ion Extraction in a Matrix-Assisted Laser Desorption/Ionization Linear Time-of-Flight Mass Spectrometer. Anal Chem. 1995;67:1998–2003. doi: 10.1021/ac00109a015. [DOI] [PubMed] [Google Scholar]
- 6.Vestal ML, Juhasz P, Martin SA. Delayed extraction matrix-assisted laser desorption time-of-flight mass spectrometry. Rapid Commun Mass Spectrom. 1995;9:1044–1050. [Google Scholar]
- 7.Dawson JHJ, Guilhaus M. Orthogonal-acceleration time-of-flight mass spectrometer. Rapid Commun Mass Spectrom. 1989;3:155–159. [Google Scholar]
- 8.Laiko VV, Dodenov AF. Resolution and spectral-line shapes in the reflecting time-of-flight mass spectrometer with orthogonally injected ions. Rapid Commun Mass Spectrom. 1994;8:720–726. [Google Scholar]
- 9.Stephens WE. A pulsed mass spectrometer with time dispersion. Phys Rev. 1946;69:691. [Google Scholar]
- 10.Cameron AE, Eggers DF. An Ion Velocitron. Rev Sci Instrumen. 1948;19:605. [Google Scholar]
- 11.Wiley WC, McLaren IH. Time-of-flight mass spectrometer with improved resolution. Rev Sci Instrumen. 1955;26:115–1157. [Google Scholar]
- 12.Colby SM, Reilly JP. Space-Velocity Correlation Focusing. Anal Chem. 1996;68:1419–1428. [Google Scholar]
- 13.Barber M, Bordoli RS, Sedgwick RD, Tyler AN. Fast atom bombardment of solids (FAB): a new ion source for mass spectrometry. J Chem Soc, Chem Commun. 1981:325–327. [Google Scholar]
- 14.Surman DJ, Vickerman JC. Fast atom bombardment quadrupole mass spectrometry. J Chem Soc, Chem Commun. 1981:324–325. [Google Scholar]
- 15.Wolff MM, Stephens WE. A pulsed mass spectrometer with time dispersion. Rev Sci Instrumen. 1953;24:616. [Google Scholar]
- 16.Van Breemen RB, Snow M, Cotter RJ. Time Resolved Laser Desorption Mass Spectrometry: I. The Desorption of Preformed Ions. Int J Mass Spectrom Ion Phys. 1983;49:35. [Google Scholar]
- 17.Cotter RJ, Honovich J, Qureshi N, Takayama K. Structural Determination of Lipid A from Gram Negative Bacteria Using Laser Desorption Mass Spectrometry. Biomed Environ Mass Spectrom. 1987;14:591–598. doi: 10.1002/bms.1200141103. [DOI] [PubMed] [Google Scholar]
- 18.Domon B, Costello CE. A systematic nomenclature for carbohydrate fragmentations in FAB-MS/MS spectra of glycoconjugates. Glycoconjugate J. 1988;5:397–409. [Google Scholar]
- 19.Brown RS, Lennon JJ. Sequence-Specific Fragmentation of Matrix-Assisted Laser-Desorbed Protein/Peptide Ions. Anal Chem. 1995;67:3990–3999. doi: 10.1021/ac00117a027. [DOI] [PubMed] [Google Scholar]
- 20.Tabet JC, Cotter RJ. Laser Desorption Time-of-Flight Mass Spectrometry of High Mass Molecules. Anal Chem. 1984;56:1662. [Google Scholar]
- 21.Spengler B. Post-source decay analysis in matrix-assisted laser desorption/ionization mass spectrometry of biomolecules. J Mass Spectrom. 1997;32:1019–1036. [Google Scholar]
- 22.Gross ML. Charge-remote fragmentations: method, mechanism and applications. Int J Mass Spectrom Ion Phys. 1992;118–119:137–165. [Google Scholar]
- 23.Cotter RJ, Cornish TJ. A Tandem Time-of-Flight (TOF/TOF) Mass Spectrometer. Anal Chem. 1993;65:1043–1047. doi: 10.1021/ac00056a017. [DOI] [PubMed] [Google Scholar]
- 24.Cornish TJ, Cotter RJ. Collision-induced Dissociation in a Tandem Time-of-flight Mass Spectrometer with Two Single-stage Reflectrons. Org Mass Spectrom. 1993;28:1129–1134. [Google Scholar]
- 25.Cotter RJ, Cornish TJ. US5,202,563. Tandem time-of-flight mass spectrometer. 1993 Apr 13; doi: 10.1021/ac00056a017. [DOI] [PubMed]
- 26.Cornish TJ, Cotter RJ. A Curved Field Reflectron for Improved Energy Focusing of Product Ions in Time-of-Flight Mass Spectrometry. Rapid Commun Mass Spectrom. 1993;7:1037–1040. doi: 10.1002/rcm.1290071114. [DOI] [PubMed] [Google Scholar]
- 27.Cornish T, Cotter RJ. A Dual-Reflectron Tandem Time-of-Flight Mass Spectrometer. In: Cotter RJ, editor. Time-of-Flight Mass Spectrometry. ACS Symposium Series; Washington DC: 1994. pp. 95–107. [Google Scholar]
- 28.Cordero MM, Cornish TJ, Cotter RJ. Matrix-assisted Laser Desorption/Ionization (MALDI) Tandem Reflectron (RTOF/RTOF) Time-of-Flight Mass Spectrometry of Fullerenes. J Am Soc Mass Spectrom. 1996;7:590–597. doi: 10.1016/1044-0305(96)00058-X. [DOI] [PubMed] [Google Scholar]
- 29.Medzihradszky KF, Campbell JM, Baldwin MA, Falick AM, Juhasz P, Vestal ML, Burlingame AL. The Characteristics of Peptide Collision-Induced Dissociation Using a High-Performance MALDI-TOF/TOF Tandem Mass Spectrometer. Anal Chem. 2000;72:552–558. doi: 10.1021/ac990809y. [DOI] [PubMed] [Google Scholar]
- 30.Suckau D, Resemann A, Schuerenberg M, Hufnagel P, Franzen J, Holle A. A novel MALDI LIFT-TOF/TOF mass spectrometer for proteomics. Anal Bioanal Chem. 2003;376:952–965. doi: 10.1007/s00216-003-2057-0. [DOI] [PubMed] [Google Scholar]
- 31.Vestal M, Campbell JM. Tandem Time-of-Flight Mass Spectrometry. Methods in Enzymology. 2005;402:79–108. doi: 10.1016/S0076-6879(05)02003-3. [DOI] [PubMed] [Google Scholar]
- 32.Cotter RJ, Gardner B, Iltchenko S, English RD. Tandem Time-of-Flight Mass Spectrometry with a Curved Field Reflectron. Anal Chem. 2004;76:1976–1981. doi: 10.1021/ac0349431. [DOI] [PubMed] [Google Scholar]
- 33.Doyle RJ, Jr, Ross MM. Dissociations of singly and multiply charged fullerene ions. J Phys Chem. 1999;95:4954–4956. [Google Scholar]
- 34.Caldwell KA, Giblin D, Gross ML. High-energy collisions of fullerene radical cations with target gases: capture of the target gas and charge stripping of C60.bul.+, C70.bul.+, and C84.bul.+ J Am Chem Soc. 1992;114:3743–3756. [Google Scholar]
- 35.McHale KJ, Polce MJ, Wesdemiotes C. Identification of the neutral products from the unimolecular dissociation of singly and multiply charged C60 fullerene ions. J Mass Spectrom. 1995;30:33–38. [Google Scholar]
- 36.Ilchenko S, Cotter RJ. Collision energetics in a tandem time-of-flight (TOF/TOF) mass spectrometer with a curved-field reflectron. Int J Mass Spectrom. 2007;265:372–381. doi: 10.1016/j.ijms.2007.06.006. [DOI] [PMC free article] [PubMed] [Google Scholar]
- 37.Uggerud E, Derrick PJ. Theory of Collisional Activation of Macromolecules: Impulsive Collisions of Organic Ions. J Phys Chem. 1991;95:1430–1436. [Google Scholar]
- 38.Caldwell KA, Giblin DE, Gross ML. High-energy collisions of fullerene radical cations with target gases: capture of the target gas and charge stripping of C60+, C70+, and C84+ J Am Chem Soc. 1992;114:3743–3756. [Google Scholar]
- 39.Weiske T, Böhme DK, Hrušák J, Krätschmer W, Schwarz H. Endohedral Cluster Compounds: Inclusion of Helium within C60+ and C70+ through Collision Experiments. Angewandte Chemie (International Edition in English) 1991;30:884–886. [Google Scholar]
- 40.Ross MM, Callahan JH. Formation and characterization of C60He+ J Phys Chem. 1991;95:5720–5723. [Google Scholar]
- 41.Mowrey RC, Ross MM, Callahan JH. Molecular dynamics simulations and Experimental studies of the Formation of C60He+ J Phys Chem. 1992;96:4755–4761. [Google Scholar]
- 42.Sprang H, Mahlkow A, Campbell EEB. Collisional energy dependence of He capture by internally excited C60 anions. Chem Phys Lett. 1994;227:91–97. [Google Scholar]
- 43.Basir Y, Anderson SL. Collisions of rare gas ions with C60: Endohedral formation, energy transfer and scattering dynamics. J Chem Phys. 1997;107:8370–8379. [Google Scholar]
- 44.Giblin DE, Gross ML, Saunders M. Incorporation of Helium into Endohedral Complexes of C60 and C70 Containing Noble-Gas Atoms. J Am Chem Soc. 1997;119:9883–9880. [Google Scholar]
- 45.Campbell EEB, Ehlich R, Heusler G, Knospe O, Sprang H. Capture dynamics in collisions between fullerene ions and rare gas atoms. Chem Phys. 1998;239:299–308. [Google Scholar]
- 46.Smith CM, Gafken PR, Zhang Z, Gottschling DE, Smith JB, Smith DL. Mass spectrometric quantification of acetylation at specific lysines within the amino-terminal tail of histone H4. Anal Biochem. 2003;316:23–33. doi: 10.1016/s0003-2697(03)00032-0. [DOI] [PubMed] [Google Scholar]
- 47.Celic I, Masumoto H, Griffith WP, Meluh P, Cotter RJ, Boeke JD, Verreault A. The sirtuins Hst3 and Hst4 preserve genome integrity by controlling histone H3 lysine 56 deacetylation. Current Biology. 2006;16:1280–1289. doi: 10.1016/j.cub.2006.06.023. [DOI] [PubMed] [Google Scholar]
- 48.Hersman E, Nelson DM, Griffith WP, Jelinek CA, Cotter RJ. Analysis of histone modifications from tryptic peptides of deuteroacetylated isoforms, Int. J Mass Spectrom. 2012;312:5–16. doi: 10.1016/j.ijms.2011.04.006. [DOI] [PMC free article] [PubMed] [Google Scholar]
- 49.Pittenauer E, Allmaier G. The Renaissance of High-Energy CID for Structural Elucidation of Complex Lipids: MALDI-TOF/RTOF-MS of Alkali Cationized Triacylglycerols. J Am Soc Mass Spectrom. 2009;20:1037–1047. doi: 10.1016/j.jasms.2009.01.009. [DOI] [PubMed] [Google Scholar]
- 50.Pittenauer E, Allmaier G. High-Energy Collision Induced Dissociation of Biomolecules: MALDITOF/RTOF Mass Spectrometry in Comparison to Tandem Sector Mass Spectrometry. Combinatorial Chemistry & High Throughput Screening. 2009;12:137–155. doi: 10.2174/138620709787315436. [DOI] [PubMed] [Google Scholar]
- 51.Cheng C, Gross ML, Pittenauer E. Complete structural elucidation of triacylglycerols by tandem sector mass spectrometry. Anal Chem. 1998;70:4417. doi: 10.1021/ac9805192. [DOI] [PubMed] [Google Scholar]
- 52.Woods AS, Jackson SN. Brain Tissue Lipidomics: Direct Probing Using Matrix-assisted Laser Desorption/Ionization Mass Spectrometry. AAPS Journal. 2006;8:E391–E395. doi: 10.1007/BF02854910. [DOI] [PMC free article] [PubMed] [Google Scholar]
- 53.Chughtai K, Jiang L, Greenwood TR, Klinkert I, Amstalden van Hove ER, Heeren RM, Glunde K. Fiducial markers for combined 3-dimensional mass spectrometric and optical tissue imaging. Anal Chem. 2012;84:1817–23. doi: 10.1021/ac203373h. [DOI] [PMC free article] [PubMed] [Google Scholar]
- 54.Evans-Nguyen KM, Tao SC, Zhu H, Cotter RJ. Protein arrays on patterned porous gold substrates interrogated with mass spectrometry: detection of peptides in plasma. Anal Chem. 2008;80:1448–58. doi: 10.1021/ac701800h. [DOI] [PubMed] [Google Scholar]


