

Abstract
Polio eradication is on the cusp of success, with only a few regions still maintaining transmission. Improving our understanding of why some regions have been successful and others have not will help with both global eradication of polio and development of more effective vaccination strategies for other pathogens. To examine the past 25 years of eradication efforts, we constructed a transmission model for wild poliovirus that incorporates waning immunity (which affects both infection risk and transmissibility of any resulting infection), age-mediated vaccination rates, and transmission of oral polio vaccine. The model produces results consistent with the 4 country categories defined by the Global Polio Eradication Program: elimination with no subsequent outbreaks; elimination with subsequent transient outbreaks; elimination with subsequent outbreaks and transmission detected for more than 12 months; and endemic polio transmission. Analysis of waning immunity rates and oral polio vaccine transmissibility reveals that higher waning immunity rates make eradication more difficult because of increasing numbers of infectious adults, and that higher oral polio vaccine transmission rates make eradication easier as adults become reimmunized. Given these dynamic properties, attention should be given to intervention strategies that complement childhood vaccination. For example, improvement in sanitation can reduce the reproduction number in problematic regions, and adult vaccination can lower adult transmission.
Keywords: immunity, immunization programs, infectious disease transmission, mathematical model, poliomyelitis, poliovirus, poliovirus vaccines, vaccination
The use of vaccines is a major success story in the field of public health. With the world on the verge of global eradication of polio, eliminating polio from the remaining few countries has proved difficult. Local elimination efforts have focused on both fine-tuning vaccine design and developing strategies to attain intensive vaccination coverage of children. Here we review the history of polio eradication through the lens of transmission system theory.
The Global Polio Eradication Initiative has classified countries into 4 categories on the basis of their elimination success (1). Countries in Category A have had successful elimination with no subsequent outbreaks. This is the largest group and includes, by continent, the Americas, Australia, Western Europe, and large portions of both Africa and Asia. India, after continual eradication difficulty, recently has been classified into Category A. Countries classified as Category B have documented successful elimination but have had subsequent transient outbreaks. These countries are African countries near Nigeria and Euro-Asian nations near India, Pakistan, and Afghanistan. Countries classified as Category C, including Angola, Chad, Democratic Republic of the Congo, and Sudan, have documented successful elimination followed by subsequent outbreaks with transmission detected for more than 12 months after the first subsequent outbreak (1). The last group of countries, comprising Category D, has endemic polio transmission. These countries are Afghanistan, Nigeria, and Pakistan. We undertake here a dynamic systems analysis that helps explain how countries got into these different categories and what determines how they move among categories.
Poliomyelitis is a disease caused by the poliovirus that is characterized by acute flaccid paralysis. Poliovirus is transmitted fecal-orally and causes primarily gastrointestinal infection with minor or no symptoms. Infected persons excrete virus into the environment, where poor sanitation and high population density allows the virus to persist and transmit.
Although polio immunity against paralysis does not wane substantially, immunity affecting susceptibility to infection and contagiousness does. Evidence of increasing susceptibility with waning immunity comes from antibody patterns (2–16) and the relationships between antibody levels and protection against infection (17, 18). Evidence of increasing contagiousness with waning immunity comes from the following: 1) an oral polio vaccine (OPV) challenge study demonstrating that persons with prior wild poliovirus (WPV) infection 40–50 years earlier excrete as much virus as completely susceptible persons (2); 2) an OPV challenge study in elderly populations demonstrating the association of excretion among previously vaccinated adults with antibody levels (19); and 3) recently immunized children who excreted significant quantities of WPV (20, 21).
The 2 types of vaccines in use are the live virus OPV and the inactivated polio vaccine. Both vaccine types provide immunity to paralysis (22), but OPV provides higher protection against infection and greater reductions in excretion during infection (23–25). As a live virus, OPV is transmissible through the same routes as WPV and thus has added effects of reaching unvaccinated populations and boosting immunity in those previously infected or vaccinated. Unfortunately, mutated derivatives of circulating OPV can also cause paralytic disease (26). Consequently, cessation of OPV is an important final step in eradication.
Although elimination in some countries with good sanitation has been achieved through the use of an early childhood routine vaccination schedule, the national-level elimination programs in other countries involve supplementary immunization activities (SIAs) reaching all children 5 years of age and under on national immunization days.
The regions in which polio elimination has been most difficult are heterogeneous in terms of population size, density, sanitation, and vaccination coverage. For example, in northern India, which has very dense and extensive populations with poor sanitation, successful elimination required more than 15 SIAs per year in some areas. In contrast, a 2010 outbreak in the Congo occurred under conditions of low population density and low exposure to poor sanitation but low vaccination coverage in a subset of the population (1).
To better understand what determines success or failure under these diverse conditions, we examined a dynamic model across a diversity of transmission conditions, vaccination levels, vaccine effects, and vaccine transmissibility. We did not aim to capture any specific country scenario with our model but rather to describe the general phenomena of polio elimination.
MATERIALS AND METHODS
The structure for our transmission model is shown in Figure 1. Web Appendix 1, available at http://aje.oxfordjournals.org/, contains an overview of the detailed background of the development and structure of our model. We constructed a deterministic, compartmental model that included different levels of immune status between the recovered state and the fully susceptible state (model equations 1–6 in Web Appendix 2). We included separate infection compartments for WPV and OPV, assuming no concurrent infection (equation 7 in Web Appendix 2). OPV transmission was modeled relative to WPV transmission with the use of parameters that reduced contagiousness and duration of infection while maintaining the same susceptibility as WPV (equations 1 and 7 in Web Appendix 2). Model parameters are described in Table 1 (and in more detail in Web Table 1). Age compartments allowed for age-specific vital dynamics and vaccination programs that target children. Aging was modeled as a pure delay process, consistent with past aging models in pertussis and measles (27, 28); for additional detail see Web Appendix 3.
Figure 1.

Graphical depiction of the transmission model without aging or vital dynamics. The model equations with vital dynamics are presented in Web Appendix 2, and aging is presented in Web Appendix 3. The I compartments correspond to the wild poliovirus (WPV)-infected population, and the V compartments correspond to the oral polio vaccine (OPV)-infected population. Each set of S, I, and V compartments is further broken down by immunity stage, i, with n total immune stages. Persons enter the population at rate b and have no immunity. The Sn−1 state corresponds to full immunity and is achieved after infection caused by either OPV or WPV. Waning of immunity occurs as the population transitions between Si compartments, at rate ωi, moving from higher immunity to lower immunity. We assume that complete loss of immunity is not possible. Levels of immunity are determined by immune stage, i, and affect susceptibility, βi; contagiousness, θi; and recovery rate, γi. Force of infection is the product of the effective contact rate (a fully infectious contact given no immunity), c, and the linear combination of the relative contagiousness, θi, of each infected subpopulation times its density. Transmission of OPV is reduced relative to WPV by decreasing the contagiousness by factor ɛ and increasing the recovery rate from infection by factor κ. Infection due to OPV can also occur because of effective vaccination rate, φ. The parameters are also explained in Table 1 and in greater detail in Web Appendix 2.
Table 1.
Polio Transmission Model Parameters
| Model Parameters | Descriptions | Values |
|---|---|---|
| i | Waning stage | 1 … n |
| j | Age group | 1 … m |
| n | Total immune stages | 10 |
| m | Total age groups | 34 |
| b | Birth rate into population | 0.025a |
| c | Effective contact rate | 40–200/yearb |
| βi | Relative susceptibility for immune stage, i | 0–1c,d |
| θi | Relative contagiousness for immune stage, i | 0–1c,e |
| γi | Recovery rate for immune stage, i | 10–40/yearc,f |
| ωi | Rate of immune state change | 0, 0.2, or 2/yearg |
| φj | Effective vaccination rate | 0–3/year |
| ε | Relative contagiousness OPV:WPV | 0.15–0.45h |
| κ | Relative recovery rate OPV:WPV | 2.25–6.25h |
| μj | Age-dependent death rates | −i |
Abbreviations: OPV, oral polio vaccine; WPV, wild poliovirus.
a The birth rate, b, was set in relation to the death rate, μj, so that the population size is constant.
b The effective contact rate, c, was assigned by using previously established R0 values (26), along with our derived transmission model calculation of R0 (Table 2).
c Immunity responses to susceptibility, contagiousness, and duration of contagiousness were assigned across their ranges of values by using an exponential function (see Web Appendix 4.1 for more details).
d The immunity parameter for susceptibility, βi, attenuates the infectivity of an effective contact on the susceptible population, where 1 defines no reduction (no immunity) and 0 defines no susceptibility (full immunity).
e The measure of contagiousness, θi, attenuates the force of infection due to the infected population, where 1 defines full contagiousness (no immunity) and 0 defines no contagiousness (full immunity).
g See Web Appendix 4.2 and Web Table 1.
h We attenuate the effect of OPV transmission by reducing contagiousness and duration of illness by using parameters ɛ and κ, respectively. The κ value was set relatively to ɛ, and values were determined by using sensitivity analysis and known relative transmissibility of OPV (26).
i −, refer to Web Appendix 3.
Immunity reduces susceptibility to infection and also reduces contagiousness and duration of infection if reinfection occurs. As immunity wanes (modeled as an underlying exponential process), susceptibility, contagiousness, and duration of infection increase. As depicted by the S0 compartment in Figure 1, we assumed that persons never fully lose immunity; that is, only new members of the population, introduced at a fixed birth rate, were completely susceptible (equations 2 and 3 in Web Appendix 2). Infection with WPV or OPV through either vaccination or OPV transmission resolves into full immunity, a short-lived period during which there is no susceptibility to reinfection, shown in Figure 1 by flows from the infected populations (compartments I and V) into the susceptible compartment with highest immunity, Sn−1. As time since recovery increases (population flows across the S compartments in Figure 1), susceptibility to reinfection increases, and subsequent reinfection has increasing contagiousness and duration. After a reinfection, full immunity is regained. For more detail on the modeling of waning immunity, see Web Appendix 4.
Unless otherwise stated, we assumed that susceptibility increases through waning to 50%, compared with no immunity, after 10 years. The rate at which contagiousness and duration increase is set to be one fourth the rate at which susceptibility increases. An exploration of waning settings is shown in Web Appendix 5.1. Initially, we fixed OPV transmissibility to 5% of WPV transmissibility. This value for OPV relative transmission was selected by using criteria from Fine and Carneiro (26), such that circulating OPV, specifically for serotypes 1 and 3, would not sustain transmission. We then investigated a broader range of OPV transmission, including higher transmissibility consistent with serotype 2. Furthermore, we investigated the effect of waning immunity by choosing values to examine the impact of waning on the dynamics for wide-ranging outcomes. The model parameters we varied for our analysis are shown in Table 2.
Table 2.
Factors That Are Varied in the Analysis
| Analysis Variables | Description | Calculation | Rangea |
|---|---|---|---|
| Maximum R0 | Reproduction number in immunologically naive population | c/γ0 | 4–20 (26) |
| OPV transmissibility | Transmissibility relative to WPV (%) | ɛ/κ | 0%–20% (26) |
| Susceptibility waning rate | Exponential waningb | 0.04, 0.07, and 0.1/yearc,d | |
| φj | Effective vaccination rates in children (0–5 years of age) | 0–3/year (1, 23) |
Abbreviations: OPV, oral polio vaccine; WPV, wild poliovirus.
a Upper and lower bounds were selected as biologically plausible limits.
b See Web Appendix 4.
c Waning rate values are not well defined and were, therefore, chosen to examine the impact of waning on the dynamics for wide-ranging outcomes. Additional values are explored in Web Appendices 5.1 and 5.3.
d The susceptibility waning rates, 0.04, 0.07, and 0.1 per year, correspond to reaching 50% susceptibility after 17, 10, and 7 years, respectively.
To model vaccination, we considered effective vaccination rates in contrast to actual vaccination rates. An effective vaccination rate corresponds to vaccination resulting in complete immunity. In reality, a dose of OPV might not induce an immune response, and multiple OPV vaccinations are required to achieve full immunity (23). The effective vaccination rate is thus less than the actual vaccination rate. Our major inferences did not change when we changed the model such that vaccines result in partial but increasing immunity from each vaccination. The pertinent analysis is presented in Web Appendix 5.2.
We simulated polio transmission initially without vaccination until the model reached steady-state dynamics. After achieving steady state, we introduced vaccination into the population. The target effective vaccination rate was achieved over an implementation time period during which vaccine rates increased linearly from zero to the target level. The main analysis used a 2-year implementation time. Results for 10-year implementation are presented in Web Appendix 5.3.
We numerically solved differential equations across a range of waning rates, relative OPV transmissibility levels, effective vaccine rates, and the reproduction number, as shown in Table 2. The reproduction number was calculated for a fully susceptible population with no vaccination and is approximately equivalent to the effective contact rate multiplied by the duration of infection. By monitoring prevalence levels over the course of a vaccination program, we identified parameter ranges that correspond to difficulties in eradication across the countries described in Table 3.
Table 3.
Classification of Countries in Context of Polio Eradication Initiative in 2012
| Country Typea | Hygiene Statusa | Examples | Eradication Categoryb | R0 Rangesa |
|---|---|---|---|---|
| Industrialized country | Good | United States, Western Europe, Australia, etc. | A | 4 |
| Industrialized country | Poor | South America, Russia | A | 10 |
| Developing country | Poor | Egypt, Eastern Europe, Northern Africa, Middle East, etc. | A | 12 |
| Developing country | Dense and poor | India | A | 14–18 |
| Developing country | Poor | Horn of Africa (e.g., Congo, Uganda) | B | 8–12 |
| Developing country | Poor | Central Asia (e.g., Tajikistan, Turkmenistan) | B | 10–14 |
| Developing country | Poor | Angola, Chad, Democratic Republic of the Congo, and Sudan | C | 8–12 |
| Developing country | Poor | Afghanistan, Nigeria, and Pakistan | D | 14–17 |
a Country type, hygiene status, and R0 values were chosen from Fine and Carneiro's polio transmission review (26).
b Country classification is based on the Global Polio Eradication Initiative (1). Category A corresponds to countries that have achieved eradication; Category B describes countries that have achieved eradication but have transient epidemics; Category C describes countries that have achieved eradication but have reestablished transmission; and Category D describes countries that have not achieved elimination.
Modeling was conducted in Python with the open-source SciPy module (http://www.scipy.org). Figures were made in R (R Foundation for Statistical Computing, Vienna, Austria) with the lattice add-on package.
RESULTS
Explaining success in polio eradication efforts across country classifications
Figure 2 displays both short-term (Figure 2A) and long-term (Figure 2B) vaccination success across differing levels of R0 and effective vaccination rates. We measured short-term success as the minimum prevalence in the first 50 years, such that the lower this minimum prevalence, the greater the short-term success. The ability to achieve low prevalence at any given time does not imply long-term success. We therefore measured long-term success as the final equilibrium prevalence. A low long-term prevalence is an indicator of stable elimination. Countries classified as Category A by the Global Polio Eradication Program (1) generally have both short- and long-term success. Countries classified as Category B and C are those with fragile short-term success; that is, they achieved short-term success but have conditions for non-zero final prevalence. Category D countries have not achieved success in the short or long term.
Figure 2.
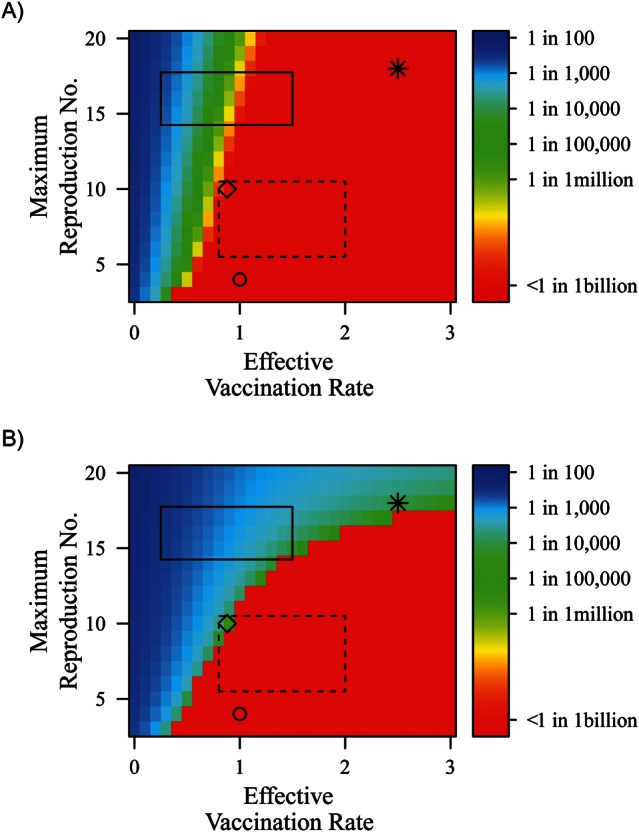
A) The minimum prevalence reached in the first 50 years because of the initial vaccine implementation (a measure of short-term success), and B) the final prevalence resulting from the vaccination program (a measure of long-term success), across R0 and effective vaccination rates per year for all children under 5 years of age. Oral polio vaccine transmissibility is set to 5% of wild poliovirus transmissibility. Waning rates are set such that it takes 10 years to increase susceptibility by 50%, contagiousness of any resulting infection by 16%, and duration of any resulting infection by 16%. The circle represents the United States, the asterisk represents regions of India (Uttar Pradesh and Bihar), and the diamond represents Xinjiang, China. To illustrate broad ranges of transmission conditions and vaccination rates, the dashed rectangular box represents China, and the solid rectangular box represents the endemic countries: Afghanistan, Pakistan, and Nigeria. Values for R0 and effective vaccination rates were selected qualitatively and are discussed in the Results. Divergence in prevalence levels between A and B does not necessarily predict future outbreaks or endemicity but rather highlights that short-term eliminations might rely on stochastic processes and thus can be fragile in the long-term.
The placement of countries onto Figure 2 was based on country-specific estimates for R0 and vaccination rates. R0 values were selected by using data from Fine and Carneiro (26). We crudely selected effective vaccination rates for categories and countries using the Global Polio Eradication Initiative criteria (1) by considering enhancing factors such as SIA deployment and mitigating factors such as poor coverage or take rates. Category A countries feature diverse conditions but generally have lower transmission conditions with adequate vaccination coverage. The United States is shown in Figure 2 with a small, stable R0 because of its low transmission conditions and a 100% vaccination rate, illustrating a consistent, effective vaccination program. In contrast, Bihar and Uttar Pradesh of India are presented in Figure 2 as having very high transmission conditions and very high vaccination levels. The yearly vaccination rate of 2.5 was selected to represent full coverage plus at least 1 fully effective booster.
The recent outbreak in Xinjiang, China, is an example of how Category B and C conditions can emerge from Category A countries. China is a large nation with varying transmission conditions, so we selected a range of R0 values for Figure 2, consistent with those presented for both types of industrialized nations in Table 3. The outbreak in Xinjiang has been attributed to importation and falling vaccination rates (29), so we illustrate potential effective vaccination rates ranging from enhanced (greater than 1) to reduced (less than 1). Although the 2011 outbreak was an isolated incident in China, its placement in Figure 2 demonstrates that other Category A nations with a higher R0 or lower vaccination coverage could be at increased risk of emerging as Category B or C countries because of importation.
The Category D countries (Afghanistan, Nigeria, and Pakistan) are depicted with moderate transmission levels but poor coverage, consistent with the difficulty programs have had in adequately vaccinating their remaining endemic regions. Afghanistan and Pakistan are grouped together because of their linked transmission conditions through importation (1).
In Figure 2A, the short-term success of the vaccination program shows decreasing prevalence as vaccination increases for a given R0. For low values of R0, low minimum prevalence levels (Figure 2A) correspond to low final prevalence levels (Figure 2B), which suggests stable elimination under these conditions. However, at higher levels of R0, where we still see low minimum prevalence levels, we no longer see low long-term prevalence, which suggests that the initial drop in prevalence due to vaccination is not maintained and the probability of resurgence is increased. A further exploration of model dynamics associated with the rebound epidemics is presented in Web Appendix 5.4.
To better understand what causes the increasing divergence between Figure 2A and Figure 2B at increasing levels of R0, we need to consider waning immunity and reinfection dynamics, where reinfection is defined as WPV infection that occurs after a first infection caused by WPV transmission, OPV transmission, or OPV vaccination (30). At high R0, when vaccination is implemented, the combination of vaccine effectiveness and immunity-boosting through reinfection causes an immediate sharp decrease in prevalence. However, if the vaccine levels are not high enough to push prevalence to zero, the waning of immunity eventually increases the number of susceptible persons, providing a means for virus circulation through reinfection epidemics. On the other hand, when R0 is low, the prevalence reduction after vaccination implementation is not highly dependent on immunity-boosting through reinfection. Therefore, for low levels of R0, vaccination levels of children do not have to reach very high levels to get below the population threshold for transmission illustrated in Figure 2B.
Role of OPV transmission
Increasing OPV transmission from 2.5% to 20% of WPV results in a large reduction in the vaccination rates required to reach low or zero prevalence at equilibrium (Figure 3). The reduction in required vaccination levels is particularly evident for high R0 levels. These increased levels of OPV transmission correspond to serotype 2 vaccination, which is known to be much more transmissible than serotypes 1 and 3 (26). At high levels of vaccine transmission, immunity is boosted in those previously infected, thereby reducing the overall transmission potential. Results for reducing relative OPV transmission to 0% are shown in Web Appendix 5.5.
Figure 3.
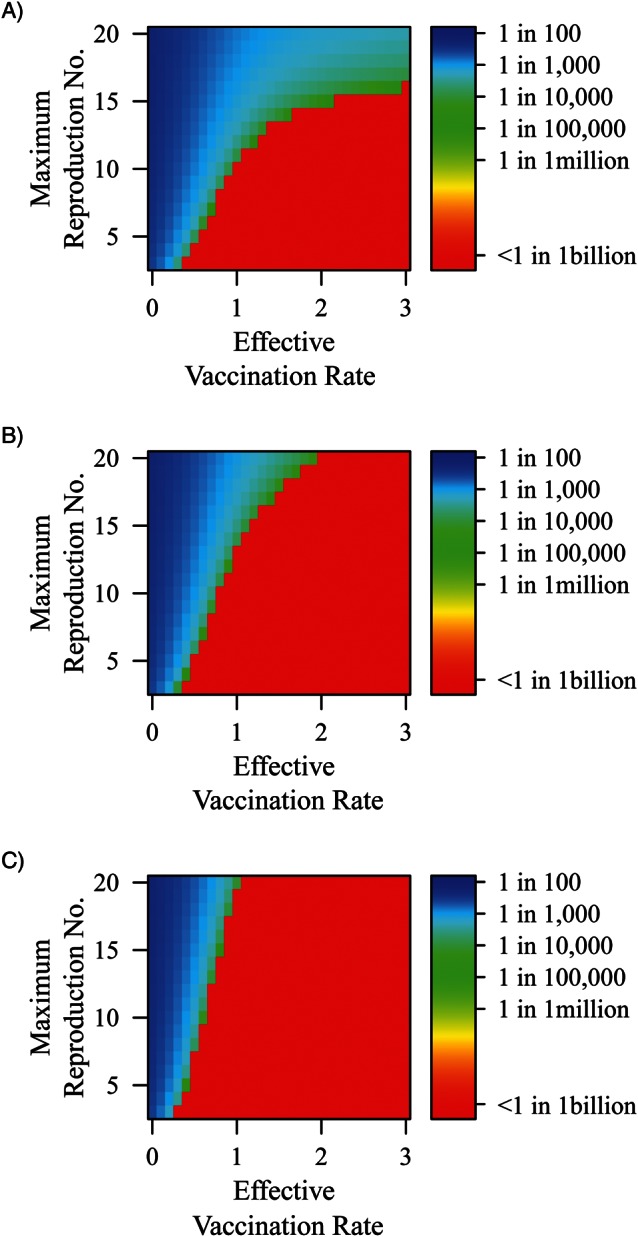
Final prevalence across vaccination rate and R0, where oral polio vaccine transmissibility relative to wild poliovirus transmissibility is set to A) 2.5%, B) 10%, and C) 20% of oral polio vaccine transmissibility. Waning rates are set such that it takes 10 years to increase susceptibility by 50%, contagiousness of any resulting infection by 16%, and duration of any resulting infection by 16%.
Role of waning immunity
Figure 4 illustrates final prevalence for faster and slower waning immunity rates. Under given levels of R0, if immunity waning is slow (left half of Figure 4), then attainment of elimination prevalence levels requires much less vaccination coverage than if waning were faster (Figure 3 and right half of Figure 4). Furthermore, by exploring across OPV transmissibility levels for each of these waning levels, we observe the importance of the boosting that occurs from OPV transmission. Even when immunity waning is fast, if relative OPV transmission is 20% that of WPV transmission, eradication is still achievable at an R0 of 20, for effective vaccination rates of around 3 per year or higher. Because waning immunity can significantly reduce the long-term efficacy of vaccination, this analysis highlights a range in which it is important to understand these underlying dynamics.
Figure 4.

Final prevalence across vaccination and R0, where by column, waning rates increase from slow (A–C: 17 years to reach 50% susceptibility) to fast (D–F: 7 years to reach 50% susceptibility), and by row, oral polio vaccine transmissibility relative to wild poliovirus transmissibility increases from 2.5% (A and D) to 10% (B and E) to 20% (C and F).
Reinfection contributions to transmission at endemic equilibrium
Figure 5 illustrates the proportion of the force of infection attributable to reinfection across varying levels of reproduction numbers and vaccination rates. Reinfections are infections of WPV that occur after previous infection due to an earlier WPV infection, OPV infection, or vaccination. For lower levels of OPV transmissibility when vaccination levels are greater than 1 per year and elimination is not reached, the proportion of the force of infection that is due to reinfection rises above 50%. When relative OPV transmissibility reaches 20%, elimination occurs under conditions in which, at lower OPV transmissibility levels, transmission was dominated by reinfection. OPV transmission prevents immunity from waning to the level at which reinfection transmission is important. Specifically, in conjunction with Figures 2 and 3, we can conclude that the final prevalence under high transmission conditions and high vaccination rates was maintained by reinfection transmission from aging populations experiencing waning immunity. This illustrates the importance of boosting immunity in populations with waned immunity.
Figure 5.

Depiction of the proportion of the force of infection that is due to reinfections across vaccination rate and R0, where oral polio vaccine (OPV) transmissibility relative to wild poliovirus (WPV) transmissibility is set to A) 2.5%, B) 5%, C) 10%, and D) 20%. Reinfection is defined as WPV infection that occurs after an initial infection caused by an earlier WPV infection, vaccination, or infection due to OPV transmission. Waning rates are set such that it takes 10 years to increase susceptibility by 50%, contagiousness of any resulting infection by 16%, and duration of any resulting infection by 16%. In the white areas of the graph, there is not sustained transmission to calculate the force of infection (i.e., prevalence equals zero).
DISCUSSION
Global polio eradication is in its final stages. To ensure success, intensive efforts are needed in the few remaining countries. The analyses we have presented help demonstrate how reproduction numbers, transmissibility of OPV, waning immunity rates, and vaccination rates contribute to successes and failures. Although our analytical approach cannot describe or predict the specific course of any nation's elimination effort, it does help to illustrate dynamics that should affect control decisions. Most important, it reveals the fragility of elimination in high-R0 areas, how reinfection contributes to that fragility, and how high levels of OPV transmission counteract the fragility related to reinfection potential.
Worldwide eradication success has been achieved by targeting children. In countries with high levels of sanitation, the success was swift. In nations with poor sanitation, such as Egypt, India, and Bangladesh, success has been less swift but has been possible. SIAs on national immunization days have been important for success under these more difficult conditions. SIAs revaccinate children many more times than routine immunization would. Because revaccinated children can excrete vaccine poliovirus (20), the resulting OPV transmission boosts immunity in unvaccinated children and in persons whose waning immunity might otherwise bring them to a state in which they could be infected by and transmit WPV.
When OPV is highly transmissible, low levels of prevalence can be achieved in high transmission conditions with less than extreme vaccination coverage; this is true even for faster-waning immunity and higher R0. At high transmission (R0) levels in Figure 2B, the low levels of prevalence induced by the initial vaccine implementation have rebounded into considerably higher endemic equilibrium levels that are not observed when OPV transmissibility is high (Figure 3C). When OPV transmissibility is low, under endemic conditions of high vaccination and high transmission, the force of infection is largely attributable to reinfection (Figure 5). By increasing the transmissibility of the OPV strain, we eliminate transmission attributable to reinfection by effectively boosting populations with waned immunity. That is, asymptomatic adult populations with waned immunity could be important factors in transmission, and their impact can be reduced by recontracting vaccine strain poliovirus.
The final stages of eradication for WPV serotypes 1 and 3 can be characterized by difficulties that did not affect the eradication of serotype 2. The increased efficacy of trivalent OPV for WPV serotype 2 is clearly one important factor (1) accounting for the success in type 2 eradication, but our analysis illustrates that lower levels of vaccine strain transmission contribute to the difficulties in achieving eradication. When transmissibility of the vaccine strain is lower, as it is in poliovirus serotypes 1 and 3 (26), vaccination strategies affecting the potential for reinfections to transmit should be considered. Besides focused SIAs, another strategy might be to add a single booster for adults in high transmission regions. Such a campaign would be costly and potentially difficult to implement but could contribute to success in regions where elimination remains in a fragile state. Furthermore, the importance of OPV transmission highlights the care that must be taken when ceasing OPV vaccination, such as maintenance of high-quality surveillance. The potential for circulating vaccine-derived polioviruses needs to be minimized in the final stages of eradication. Because inactivated polio vaccine has been shown to induce mucosal immunity through boosting in previously OPV-immunized populations (31), inactivated polio vaccine might be a candidate vaccine for boosters in older populations that could reduce risks of circulating vaccine-derived poliovirus.
Our model of waning immunity uses a simple exponential process in which OPV or WPV vaccination always results in complete immunity. It is possible that altering this assumption could affect our inferences about what is leading to success or failure in eradication efforts. If immunization can result in incomplete immunity, then SIA success could occur because of ensuring comprehensive coverage of underimmunized children. Furthermore, the evidence of waning of immunity through decrease in antibody levels, particularly in high transmission regions, could stem from nuances not addressed in our analysis. These include factors known to affect polio immunization such as malnutrition, concurrent enteric infections, and vaccine tolerance (32). The extent to which these factors play a role deserves to be analyzed in future dynamic transmission system frameworks.
Because our model used a continuous, deterministic framework, the continuous population assumption allows our transmission system to reach trivially low prevalence levels temporarily. In reality, when prevalence reaches very low levels, demographic stochasticity would lead to transmission cessation. Additionally, the deterministic nature of our model prevents us from modeling outbreaks due to sporadic importation in regions where polio was eliminated, a topic that was analyzed previously (33). Nonetheless, our deterministic analysis shows how Category A countries with high transmission conditions are still at risk for epidemics due to reintroduction of virus; that is, we can discern problematic parameter regions that achieve very low prevalence levels because of initial vaccine implementation but maintain long-term prevalence (Figure 2).
The polio vaccine has been a public health triumph since its first implementation more than 50 years ago. With the public health community hoping to follow the success of the smallpox eradication program, the polio eradication program has eliminated polio in most of the world, removing a terrible and debilitating disease from the memories of most living populations. With a handful of remaining endemic countries on the cusp of eradication, we are on the verge of a major public health victory. Our model highlights some of the potential challenges that have prevented success in the final phase of polio elimination. We hope that by better understanding the dynamics driving transmission, we can improve the design of future public health initiatives to eradicate infectious diseases.
Supplementary Material
ACKNOWLEDGMENTS
Author affiliations: Department of Epidemiology, School of Public Health, University of Michigan, Ann Arbor, Michigan (Bryan T. Mayer, Joseph N. S. Eisenberg, Christopher J. Henry, James S. Koopman); Instituto Gulbenkian de Ciência, Oeiras, Portugal (M. Gabriela M. Gomes); and Department of Statistics, College of Literature, Science & Arts, University of Michigan, Ann Arbor, Michigan (Edward L. Ionides).
This research was supported by the US Environmental Protection Agency Science to Achieve Results (STAR) Program and by the US Department of Homeland Security University Programs (grant R83236201). M. Gabriela M. Gomes was supported by the Portuguese Foundation for Science and Technology (FCT) and by the European Commission (EC-ICT-231807). Edward L. Ionides was supported by the Research and Policy for Infectious Disease Dynamics (RAPIDD) program of the Science and Technology Directorate, Department of Homeland Security, and the Fogarty International Center, National Institutes of Health.
The authors thank Dr. Rick Riolo and the Center for the Study of Complex Systems at the University of Michigan, Ann Arbor, Michigan, for allowing us to use their computing resource. The authors also thank Dr. Ethan Romero-Severson for his contributions to editing.
Conflict of interest: none declared.
REFERENCES
- 1.Polio Global Eradication Initiative. Infected Countries. Geneva, Switzerland: World Health Organization; 2010. http://www.polioeradication.org/Infectedcountries.aspx. (Accessed May 1, 2012) [Google Scholar]
- 2.Abbink F, Buisman AM, Doornbos G, et al. Poliovirus-specific memory immunity in seronegative elderly people does not protect against virus excretion. J Infect Dis. 2005;191(6):990–999. doi: 10.1086/427810. [DOI] [PubMed] [Google Scholar]
- 3.Bass JW, Halstead SB, Fischer GW, et al. Oral polio vaccine. Effect of booster vaccination one to 14 years after primary series. JAMA. 1978;239(21):2252–2255. doi: 10.1001/jama.239.21.2252. [DOI] [PubMed] [Google Scholar]
- 4.Conyn-Van Spaendonck MA, de Melker HE, Abbink F, et al. Immunity to poliomyelitis in the Netherlands. Am J Epidemiol. 2001;153(3):207–214. doi: 10.1093/aje/153.3.207. [DOI] [PubMed] [Google Scholar]
- 5.Green MS, Handsher R, Cohen D, et al. Age differences in immunity against wild and vaccine strains of poliovirus prior to the 1988 outbreak in Israel and response to booster immunization. Vaccine. 1993;11(1):75–81. doi: 10.1016/0264-410x(93)90342-u. [DOI] [PubMed] [Google Scholar]
- 6.Grotto I, Handsher R, Gdalevich M, et al. Decline in immunity to polio among young adults. Vaccine. 2001;19(30):4162–4166. doi: 10.1016/s0264-410x(01)00165-7. [DOI] [PubMed] [Google Scholar]
- 7.Lapinleimu K, Stenvik M. Experiences with polio vaccination and herd immunity in Finland. Dev Biol Stand. 1981;47:241–246. [PubMed] [Google Scholar]
- 8.Majori S, Baldo V, Poli A, et al. Immunity to poliovirus among children and the elderly in north-east Italy. J Prev Med Hyg. 2006;47(1):12–15. [PubMed] [Google Scholar]
- 9.Murph JR, Grose C, McAndrew P, et al. Sabin inactivated trivalent poliovirus vaccine: first clinical trial and seroimmunity survey. Pediatr Infect Dis J. 1988;7(11):760–765. doi: 10.1097/00006454-198811000-00003. [DOI] [PubMed] [Google Scholar]
- 10.Nishio O, Ishihara Y, Sakae K, et al. The trend of acquired immunity with live poliovirus vaccine and the effect of revaccination: follow-up of vaccinees for ten years. J Biol Stand. 1984;12(1):1–10. doi: 10.1016/s0092-1157(84)80015-3. [DOI] [PubMed] [Google Scholar]
- 11.Schoub BD, Blackburn NK, McAnerney JM. Seroprevalence to polio in personnel at a virology institute. J Infect. 2001;43(2):128–131. doi: 10.1053/jinf.2001.0867. [DOI] [PubMed] [Google Scholar]
- 12.Nates SV, Martinez LC, Barril PA, et al. Long-lasting poliovirus-neutralizing antibodies among Argentinean population immunized with four or five oral polio vaccine doses 1 month to 19 years previously. Viral Immunol. 2007;20(1):3–10. doi: 10.1089/vim.2006.0071. [DOI] [PubMed] [Google Scholar]
- 13.Rousseau WE, Noble GR, Tegtmeier GE, et al. Persistence of poliovirus neutralizing antibodies eight years after immunization with live, attenuated-virus vaccine. N Engl J Med. 1973;289(25):1357–1359. doi: 10.1056/NEJM197312202892507. [DOI] [PubMed] [Google Scholar]
- 14.Trivello R, Farisano G, Bonello C, et al. Immunity status to poliovirus in Veneto region (north-east Italy). A seroepidemiological survey. Ann Clin Lab Sci. 1994;24(6):542–547. [PubMed] [Google Scholar]
- 15.Triassi M, Ribera G, Barruffo L, et al. Persistence of immunity to poliomyelitis among a southern population that received four doses of OPV 5 to over 15 years before. Eur J Epidemiol. 1996;12(1):5–8. doi: 10.1007/BF00144420. [DOI] [PubMed] [Google Scholar]
- 16.Sutter RW, Suleiman AJM, Malankar P, et al. Trial of a supplemental dose of four poliovirus vaccines. N Engl J Med. 2000;343(11):767–773. doi: 10.1056/NEJM200009143431103. [DOI] [PubMed] [Google Scholar]
- 17.Alexander JP, Jr, Gary HE, Jr, Pallansch MA. Duration of poliovirus excretion and its implications for acute flaccid paralysis surveillance: a review of the literature. J Infect Dis. 1997;175(suppl 1):S176–S182. doi: 10.1093/infdis/175.supplement_1.s176. [DOI] [PubMed] [Google Scholar]
- 18.Swartz TA, Green MS, Handscher R, et al. Intestinal immunity following a combined enhanced inactivated polio vaccine/oral polio vaccine programme in Israel. Vaccine. 2008;26(8):1083–1090. doi: 10.1016/j.vaccine.2007.12.021. [DOI] [PubMed] [Google Scholar]
- 19.Buisman AM, Abbink F, Schepp RM, et al. Preexisting poliovirus-specific IgA in the circulation correlates with protection against virus excretion in the elderly. J Infect Dis. 2008;197(5):698–706. doi: 10.1086/527487. [DOI] [PubMed] [Google Scholar]
- 20.Grassly NC, Jafari H, Bahl S, et al. Asymptomatic wild-type poliovirus infection in India among children with previous oral poliovirus vaccination. J Infect Dis. 2010;201(10):1535–1543. doi: 10.1086/651952. [DOI] [PubMed] [Google Scholar]
- 21.Sutter RW, Patriarca PA, Brogan S, et al. Outbreak of paralytic poliomyelitis in Oman: evidence for widespread transmission among fully vaccinated children. Lancet. 1991;338(8769):715–720. doi: 10.1016/0140-6736(91)91442-w. [DOI] [PubMed] [Google Scholar]
- 22.Fine PE. Polio: measuring the protection that matters most. J Infect Dis. 2009;200(5):673–675. doi: 10.1086/605331. [DOI] [PubMed] [Google Scholar]
- 23.Grassly NC, Jafari H, Bahl S, et al. Mucosal immunity after vaccination with monovalent and trivalent oral poliovirus vaccine in India. J Infect Dis. 2009;200(5):794–801. doi: 10.1086/605330. [DOI] [PubMed] [Google Scholar]
- 24.Henry JL, Jaikaran ES, Davies JR, et al. A study of poliovaccination in infancy: excretion following challenge with live virus by children given killed or living poliovaccine. J Hyg (Lond) 1966;64(1):105–120. doi: 10.1017/s0022172400040389. [DOI] [PMC free article] [PubMed] [Google Scholar]
- 25.Grassly NC, Jafari H, Bahl S, et al. Waning intestinal immunity after vaccination with oral poliovirus vaccines in India. J Infect Dis. 2012;205(10):1554–1561. doi: 10.1093/infdis/jis241. [DOI] [PubMed] [Google Scholar]
- 26.Fine PE, Carneiro IA. Transmissibility and persistence of oral polio vaccine viruses: implications for the global poliomyelitis eradication initiative. Am J Epidemiol. 1999;150(10):1001–1021. doi: 10.1093/oxfordjournals.aje.a009924. [DOI] [PubMed] [Google Scholar]
- 27.Schenzle D. An age-structured model of pre- and post-vaccination measles transmission. IMA J Math Appl Med Biol. 1984;1(2):169–191. doi: 10.1093/imammb/1.2.169. [DOI] [PubMed] [Google Scholar]
- 28.Rohani P, Zhong X, King AA. Contact network structure explains the changing epidemiology of pertussis. Science. 2010;330(6006):982–985. doi: 10.1126/science.1194134. [DOI] [PubMed] [Google Scholar]
- 29.Kew O. Reaching the last one per cent: progress and challenges in global polio eradication. Curr Opin Virol. 2012;2(2):188–198. doi: 10.1016/j.coviro.2012.02.006. [DOI] [PubMed] [Google Scholar]
- 30.Gomes MG, White LJ, Medley GF. Infection, reinfection, and vaccination under suboptimal immune protection: epidemiological perspectives. J Theor Biol. 2004;228(4):539–549. doi: 10.1016/j.jtbi.2004.02.015. [DOI] [PubMed] [Google Scholar]
- 31.Herremans TMPT, Reimerink JHJ, Buisman AM, et al. Induction of mucosal immunity by inactivated poliovirus vaccine is dependent on previous mucosal contact with live virus. J Immunol. 1999;162(8):5011–5018. [PubMed] [Google Scholar]
- 32.Okayasu H, Sutter RW, Czerkinsky C, et al. Mucosal immunity and poliovirus vaccines: impact on wild poliovirus infection and transmission. Vaccine. 2011;29(46):8205–8214. doi: 10.1016/j.vaccine.2011.08.059. [DOI] [PubMed] [Google Scholar]
- 33.Duintjer Tebbens RJ, Pallansch MA, Kew OM, et al. A dynamic model of poliomyelitis outbreaks: learning from the past to help inform the future. Am J Epidemiol. 2005;162(4):358–372. doi: 10.1093/aje/kwi206. [DOI] [PubMed] [Google Scholar]
Associated Data
This section collects any data citations, data availability statements, or supplementary materials included in this article.