

Abstract
Objective
To map the 12-item Multiple Sclerosis Walking Scale (MSWS-12) onto the EuroQol 5-dimension (EQ-5D) health-utility index in multiple sclerosis (MS) patients participating in the North American Research Committee on Multiple Sclerosis (NARCOMS) registry.
Design
Cross-sectional MSWS-12 to EQ-5D cross-walking analysis.
Setting
NARCOMS registry spring 2010 biannual update and supplemental survey.
Participants
North American patients completing both the MSWS-12 and the EQ-5D randomly split into derivation and validation cohorts.
Outcome measures
Ordinary least squares regression was performed within the derivation cohort, with participants’ EQ-5D as the dependent variable. Results of the MSWS-12 were input as independent variable(s) into six regression models. Model goodness-of-fit was subsequently assessed in the validation cohort using the mean absolute error (MAE), root mean square error (RMSE) and the adjusted R2. The best performing model was refined in the entire cohort and utilised for additional analyses.
Results
A total of 3505 NARCOMS participants were included. Their mean±SD EQ-5D and MSWS-12 scores were 0.74±0.18 and 50.8±33.5, respectively, and these assessments were found to be moderately correlated (r=–0.553, p<0.001). The model using all individual MSWS-12 item scores as independent variables was found to have the best fit (MAE=0.109±0.096, RMSE=0.145, adjusted R2=0.329). The percentage of EQ-5D estimates within 0.05 and 0.10 of the actual value were 30% and 61%, respectively. This mapping equation was more precise in patients with moderate mobility impairment (MAE=0.087±0.061 at patient-determined disease step (PDDS) of 3–6) and less precise in patients with no (MAE=0.141±0.128 at PDDS of 0–2) or severe mobility impairment (MAE=0.121±0.049 at PDDS ≥7).
Conclusions
The EQ-5D scores can be predicted using the MSWS-12 item scores with reasonable precision in North American patients with MS. Prediction estimates were more precise in patients with moderate mobility impairment.
Keywords: Health Economics, Neurology, Statistics & Research methods
Article summary.
Article focus
The 12-item Multiple Sclerosis Walking Scale (MSWS-12) is a patient-reported outcome measure that assesses patients’ perception of the impact of multiple sclerosis (MS) on walking ability, but cannot be used in cost-effectiveness or cost-utility analyses which require a health-utility score to calculate quality-adjusted life-years.
A potential solution to this problem is to map the MSWS-12 onto a health-utility measure (eg, EuroQol 5-dimension (EQ-5D)) so that needed utility values can be estimated from MS patients’ MSWS-12 responses.
Key messages
A previous group mapped the MSWS-12 to the EQ-5D; however, this was conducted on a small sample of patients with MS derived from a cohort in the UK.
This analysis sought to map the MSWS-12 onto the EQ-5D in a North American population with MS, using data from the North American Research Committee on Multiple Sclerosis (NARCOMS) registry.
Strengths and limitations of this study
With a mean absolute error of 0.109±0.096, this mapping study suggests that MSWS-12 item scores can be used to predict EQ-5D scores with reasonable precision in the North American MS patients.
The best-fit equation performed optimally in participants with moderate mobility impairment and less accurately in patients with no or severe mobility impairment.
Introduction
Multiple sclerosis (MS) is a chronic and progressive neurological disease affecting approximately 400 000 Americans; it is primarily diagnosed between the ages of 18 and 45 years.1 Mobility impairment is one of the top reported concerns of patients with MS,2 and data suggest that even mild mobility loss associated with MS may adversely affect health-related quality of life (HRQoL).3
The 12-item Multiple Sclerosis Walking Scale (MSWS-12) is a patient-reported outcome measure that assesses patients’ perception of the impact of MS on walking ability.4 The MSWS-12 is a validated tool and has been used as a patient-reported outcome to validate objective measures of lower extremity function in two phase 3, randomised, controlled trials in patients with MS.5 6 However, MSWS-12 results are not compatible for use in cost-effectiveness or cost-utility analyses, which require health-utility scores to be multiplied by the number of years of life to calculate quality-adjusted life-years (QALYs).7 Consequently, the impact on QALYs remains and the cost-effectiveness of MS interventions cannot be thoroughly assessed when this important walking-specific outcome measure is used, unless an additional health-utility measure such as the prominently used EuroQol 5-dimension (EQ-5D) was administered.8
A potential solution to this problem is to map the MSWS-12 onto a health-utility measure so that the utility values needed can be estimated from MS patients’ MSWS-12 responses, subsequently enabling important health economic evaluations to be performed.9 Hawton et al10 conducted such an analysis, mapping the MSWS-12 onto the generic, preference-based EQ-5D health-utility measure.9 However, their analysis was conducted on a small sample of patients (n=560) with MS from a prospective, longitudinal, cohort study in the UK. Since patients different geographical regions of the world may perceive the impact of walking impairment on HRQoL differently, and Hawton et al10 utilised EQ-5D preference weights derived in a general UK and not a North American population, the external validity of their results to an MS population in North America is unknown.
In this analysis, we sought to map the MSWS-12 onto the EQ-5D in a North American population with MS, using data from the North American Research Committee on Multiple Sclerosis (NARCOMS) Registry.11
Methods
The NARCOMS registry was used to conduct this mapping study.11 NARCOMS, a global registry predominantly comprised of North American (USA and Canada) participants with MS, is the largest of its kind in the world and provides a database of self-reported patient data elicited through an extensive, semiannual health survey of participants. Starting in 2009, NARCOMS, along with Acorda Therapeutics, Inc, began sending a supplemental, semi-annual questionnaire about 1 month after the regular update survey to a subset of registry participants who previously reported a patient-determined disease step (PDDS) score of ≤7 (use of a wheelchair or scooter). This supplemental survey intended to gather additional data regarding their HRQoL and mobility impairment; it included both the EQ-5D8 and the MSWS-12.4
The collection and research use of NARCOMS data are approved by the Institutional Review Board (IRB) at the University of Alabama at Birmingham. A separate approval was obtained from the same IRB for the acquisition of the additional data via the supplemental semi-annual questionnaire. The secondary analyses reported here were reviewed and approved by the IRB at Hartford Hospital and conducted with de-identified datasets.
The EQ-5D is a validated, generic, preference-based, health-status measure consisting of five descriptive questions concerning five domains of HRQoL (mobility, self-care, usual activities, pain/discomfort and anxiety/depression).8 Each question is answered with one of the three potential responses as follows: (1) ‘no problems’, (2) ‘moderate problems’ and (3) ‘severe problems.’ Each of the 243 potential patterns of response can be used to classify a participant into a distinct health state associated with a specific index score. For the general North American population, the possible EQ-5D index scores range from −0.11 (33333) to 1.0 (11111) on a scale where 1.0=perfect health, 0.0=death and negative values represent health states perceived by the population to be less desirable than death.
The MSWS-12 is a validated, patient-reported outcome measure assessing the extent to which an individual's MS impacts walking ability.4 The MSWS-12 includes 12 questions that are rated on a scale ranging between 1 (‘not at all’) and 5 (‘extremely’). Each of the 12 questions concerns a different aspect of walking function and quality, such as ability to walk, walking speed, ability to run, ability to climb and descend stairs, ability to stand, balance, endurance, smoothness of gait, need for support (indoors and out), effort and concentration required. Total calculated scores range from 12 to 60 and are transformed into scores ranging from 0 to 100. Higher scores reflect a greater walking disability.
In order to be included in this mapping study, participants had to have completed both the regular NARCOMS update and supplemental survey administered in the spring of 2010. Mapping of the MSWS-12 onto the EQ-5D was performed using ordinary least squares (OLS) regression with participants’ EQ-5D as the dependent variable. Results of the MSWS-12 were input into the regression model as independent variable(s) as follows: (1) the total score; (2) the total score plus the total score squared; (3) all individual item scores recategorised to a simple, dichotomous response scale, with categorical data as 0 (‘not at all’) and 1 (‘a little’/‘moderately’/‘quite a bit’/‘extremely’); (4) all individual item scores; (5) only the individual item scores with statistically significant β coefficients (most parsimonious model) and (6) only individual item scores with negative β coefficients (most intuitive model). Participant demographics were not included in any of the candidate models. Multicollinearity of the MSWS-12 items was said to be problematic when tolerance was <0.10 or the variance inflation factor was >10. The items demonstrating multicollinearity were excluded from candidate models.
Candidate models were fit in a derivation cohort that consisted of a random sample of approximately one-half of the eligible study population. The validation cohort, consisting of the remainder of participants, was subsequently used to assess the goodness-of-fit of each of the candidate models. The best-fit model was determined to be the model with the lowest mean absolute error (MAE). The MAE is the average of the absolute difference between the observed and the predicted EQ-5D values. The root mean square error (RMSE; the positive square root of the average squared prediction error, which attaches greater weight to larger errors) and adjusted R2 were also reported.
Once the best-fit model was selected, its β coefficients were determined for the whole study sample. The MAE, RMSE and adjusted R2 values were recalculated, and this final model was used for subsequent analyses. Such analyses included the determination of the percentage of EQ-5D estimates within various absolute errors of the actual value and an assessment of the goodness-of-fit statistics when the sample was stratified by the extent of mobility impairment or EQ-5D health-state severity. For the latter analyses, participants’ mobility impairment was categorised using the PDDS12 with scores of ≤2, 3 to 6, and ≥7 representing ‘no’, ‘moderate’ and ‘severe/total’ mobility impairment, respectively; the NARCOMS mobility performance scale13 (rated on a scale ranging between 0, ‘normal’ and 6 ‘total disability’); and the EQ-5D (<0.50, 0.50 to <0.75 and ≥0.75).10
Descriptive statistics are reported as percentages for categorical data and mean (SD) for continuous data. A p value of <0.05 was considered statistically significant in all situations. All data analysis was performed using SPSS V.17.0 (SPSS Inc, Chicago, Illinois, USA). All analysis and reporting are consistent with the National Institute for Health and Clinical Excellence Decision Support Unit's technical support document for using mapping methods to estimate health-state utility values.14
Results
A total of 9899 patients completed the regular NARCOMS update in the spring of 2010 (mean (SD) age was 55.4 (10.5) years, duration of disease 16.7 (9.6) years and 77.6% female). Of these, 3505 had a PDDS score ≤7 and also completed the supplemental survey. Owing to the random splitting of the full cohort, no significant differences in characteristics were observed between patients in the derivation and validation cohorts. The characteristics of the 3505 included participants in the total cohort, as well as the derivation and validation cohorts separately are depicted in table 1. The mean (SD) EQ-5D score was 0.74 (0.18, range −0.04 to 1.0; 11.9% had a score of 1.0) and the mean (SD) MSWS-12 score was 50.8 (33.5) for the entire population. Sixty per cent of the patients were receiving a disease-modifying drug. EQ-5D and MSWS-12 were shown to be statistically and moderately correlated with a Pearson's r of −0.553 (p<0.001).
Table 1.
Characteristics of the NARCOMS derivation, validation and full cohorts
| Characteristic | Derivation cohort (n=1752) | Validation cohort (n=1753) | Full cohort (N=3505) |
|---|---|---|---|
| Age, mean (SD) | 57.0 (9.9) | 57.1 (10.2) | 56.7 (10.0) |
| Duration of disease, mean (SD) | 18.1 (9.4) | 18.1 (8.9) | 18.1 (9.1) |
| Female gender (%) | 79.7 | 80.5 | 80.7 |
| MSWS-12 total score, mean (SD) | 50.7 (33.6) | 51.0 (33.4) | 50.8 (33.5) |
| Item 1 | 2.65 (1.39) | 2.68 (1.38) | 2.67 (1.39) |
| Item 2 | 3.84 (1.57) | 3.88 (1.56) | 3.86 (1.57) |
| Item 3 | 2.89 (1.44) | 2.93 (1.44) | 2.91 (1.44) |
| Item 4 | 2.68 (1.38) | 2.69 (1.38) | 2.68 (1.38) |
| Item 5 | 2.86 (1.36) | 2.86 (1.34) | 2.86 (1.35) |
| Item 6 | 3.22 (1.50) | 3.24 (1.48) | 3.23 (1.49) |
| Item 7 | 3.03 (1.47) | 3.05 (1.44) | 3.04 (1.46) |
| Item 8 | 2.64 (1.61) | 2.62 (1.61) | 2.63 (1.61) |
| Item 9 | 2.80 (1.73) | 2.82 (1.72) | 2.81 (1.72) |
| Item 10 | 3.22 (1.50) | 3.24 (1.50) | 3.23 (1.50) |
| Item 11 | 3.26 (1.49) | 3.25 (1.48) | 3.26 (1.49) |
| Item 12 | 3.30 (1.49) | 3.28 (1.50) | 3.29 (1.49) |
| EQ-5D, mean (SD) | 0.74 (0.18) | 0.73 (0.19) | 0.74 (0.18) |
The 12-items of the MSWS-12 are as follows (in the past 2 weeks, how much has your MS…):
1. Limited your ability to walk?
2. Limited your ability to run?
3. Limited your ability to climb up and down stairs?
4. Made standing when doing things more difficult?
5. Limited your balance when standing or walking?
6. Limited how far you are able to walk?
7. Increased the effort needed for you to walk?
8. Made it necessary for you to use support when walking indoors (eg, holding on to furniture, using a stick, etc)?
9. Made it necessary for you to use support when walking outdoors (eg, using a stick, a frame, etc)?
10. Slowed down your walking?
11. Affected how smoothly you walk?
12. Made you concentrate on your walking?
EQ-5D, EuroQol 5-dimension; MS, multiple sclerosis; MSWS-12, 12-item Multiple Sclerosis Walking Scale; NARCOMS, North American Research Committee on Multiple Sclerosis.
Table 2 reports the goodness-of-fit statistics for each of the candidate regression models in the validation cohort with different representations of the MSWS-12. The model using all individual MSWS-12 item scores as independent variables was found to have the best fit (MAE=0.111, RMSE=0.150 and adjusted R2=0.324) and was chosen for future analysis.
Table 2.
Predictive performance of candidate OLS-mapping models in the validation cohort (n=1753)
| Model | MAE | RMSE | Adjusted R2 |
|---|---|---|---|
| Total score‡ | 0.115 | 0.151 | 0.298 |
| Total score+total score2 | 0.119 | 0.152 | 0.306 |
| Dichotomised, all individual item scores | 0.117 | 0.155 | 0.285 |
| All individual item scores§ | 0.111 | 0.150 | 0.324 |
| Most parsimonious model based on individual item scores | 0.112 | 0.150 | 0.323 |
| Most intuitive model based on individual item scores | 0.112 | 0.150 | 0.319 |
‡In acknowledgement that not all who wish to use a mapping algorithm will have access to individual item score data, the total score algorithm which did not perform as well as the preferred individual MSWS-12 item-score equation is provided here (EQ-5D=−0.003*† (transformed MSWS-12 total score)+0.894 (constant)); note that an asterisk (*) indicates the item was multiplied by/multiplication operator and a dagger (†) denotes a p value <0.05.
§Preferred model.
MAE, MSWS-12, 12-item Multiple Sclerosis Walking Scale; mean absolute error; OLS, ordinary least squares; RMSE, root mean square error.
The final individual MSWS-12 item-score model was EQ-5D=+0.002* (item 1), −0.009*† (item 2), −0.01*† (item 3), −0.029*† (item 4), −0.019*† (item 5), −0.0000881* (item 6), −0.008* (item 7), −0.002* (item 8), +0.013*† (item 9), −0.011*† (item 10), +0.001* (item 11) and −0.008*† (item 12) and +0.983 (constant); note that an asterisk (*) indicates that the item was multiplied and a dagger (†) denotes p<0.05. The MAE, RMSE and adjusted R2 of the final individual MSWS-12 item-score model run in the total population were 0.109 (0.096), 0.145 and 0.329, respectively. The mean (SD) predicted EQ-5D score by the regression model was 0.741 (0.102, range 0.52–0.91). A plot of the observed and predicted EQ-5D values is provided in figure 1. The percentage of EQ-5D estimates within defined absolute errors from the actual value is provided in table 3.
Figure 1.
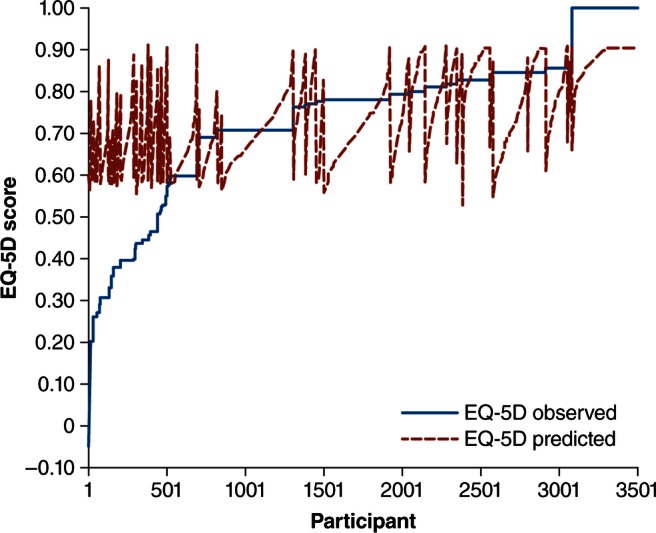
A plot of observed and predicted EQ-5D scores. EQ-5D, EuroQol 5-dimension.
Table 3.
Precision of the best-fit model in the full cohort (N=3505)
| Absolute error | Percentage of EQ-5D estimates |
|---|---|
| ≤0.01 | 6.5 |
| 0.01 <error ≤0.03 | 12.5 |
| 0.03 <error ≤0.05 | 11 |
| 0.05 <error ≤0.07 | 11.5 |
| 0.07 <error ≤0.10 | 19.4 |
| 0.10 <error ≤0.12 | 7.4 |
| >0.12 | 31.8 |
EQ-5D, EuroQol 5-dimension.
Table 4 depicts the goodness-of-fit statistics in subsets of the population stratified by mobility impairment. The final individual MSWS-12 item-score mapping equation was more precise in patients with moderate mobility impairment (MAE=0.087 at PDDS of 3–6) and less precise in patients with no (MAE=0.141 at PDDS of 0–2) or severe mobility impairment (MAE=0.121 at PDDS ≥7). Similar trends were seen when participants were stratified by the NARCOMS mobility performance scale. When stratified by EQ-5D health-state severity, the equation performed less accurately in patients with EQ-5D values <0.50.
Table 4.
MAE and RMSE stratified by mobility impairment and health-utility severity.
| Mobility impairment | MAE (SD) | RMSE |
|---|---|---|
| PDDS* | ||
| No mobility impairment (n=1299, 40.4%) | 0.141 (0.128) | 0.190 |
| Moderate mobility impairment (n=1835, 57.1%) | 0.087 (0.061) | 0.107 |
| Severe mobility impairment (n=80, 2.5%) | 0.121 (0.049) | 0.130 |
| NARCOMS mobility performance scale*† | ||
| Normal (n=613, 18.9%) | 0.212 (0.138) | 0.252 |
| Minimal gait disability (n=549, 17%) | 0.077 (0.077) | 0.109 |
| Mild gait disability (n=509, 15.7%) | 0.071 (0.056) | 0.089 |
| Occasional use of cane (n=570, 17.6%) | 0.077 (0.056) | 0.095 |
| Frequent use of cane (n=493, 15.2%) | 0.094 (0.065) | 0.114 |
| Severe gait disability (n=454, 14%) | 0.109 (0.064) | 0.127 |
| Total gait disability (n=47, 1.5%) | 0.131 (0.053) | 0.142 |
| EQ-5D health state | ||
| <0.50 (n=438, 12.5%) | 0.297 (0.094) | 0.312 |
| 0.50 to <0.75 (n=867, 24.7%) | 0.063 (0.054) | 0.083 |
| ≥0.75 (n=2200, 62.8%) | 0.089 (0.060) | 0.107 |
*Sample does not add up to 3505 due to missing disease-severity data.
†Responses are to the item, ‘In the past 4 weeks, compare your current condition with your mobility before you developed MS.’
EQ-5D, EuroQol 5-dimension; MAE, mean absolute error; NARCOMS, North American Research Committee on Multiple Sclerosis; PDDSs, patient-determined disease steps; RMSE, root mean square error.
Discussion
This study found the model using all individual MSWS-12 item scores as independent variables to have the best fit for predicting EQ-5D. Although there are currently no guidelines as to what constitutes an acceptable goodness-of-fit for a mapping study, a recent systematic review of published mapping studies for various disease states by Brazier et al9 found MAEs ranging between 0.0011 and 0.19, representing a percentage error of up to 15 of the overall scale range of the dependent variable. The MAE observed for our best-fit MSWS-12 mapping equation represented a percentage error of about 10 on the EQ-5D (MAE of 0.109 and an overall scale range of 1.11 for the North American patients scoring of the EQ-5D). Thus, this mapping study suggests that EQ-5D scores can be predicted using all the MSWS-12 item scores with reasonable precision in North American patients with MS (see online supplementary appendix 1 for a scoring example). The ability to obtain EQ-5D scores in such a fashion may enable cost-utility analyses to be conducted on MS interventions that did not utilise a health-utility measure, but did use the MSWS-12.
As was stated previously, the best-fit equation performed optimally in participants with moderate mobility impairment and less accurately in patients with no or severe mobility impairment. Interestingly, previous mapping studies have also observed that EQ-5D models tended to over predict the values at the lower end (worse health) and under predict at the upper end (better health) of the EQ-5D.15 16 Therefore, it should be noted that generalising our model to severe MS patients (PDDS ≥7 and NARCOMS mobility scale score ≥6) may be questionable.
To date, only one previously published study has attempted to map the MSWS-12 onto a preference-based HRQoL instrument.10 Hawton et al10 used data from people with MS in the South West of England project. Similar to our analysis, they used OLS regression modelling, using all individual MSWS-12 item scores (except for item 11, which was removed due to collinearity) to provide the best performing equation (MAE=0.148, RMSE=0.198 and adjusted R2=0.361). Additionally, their equation performed less accurately in patients with poorer health. However, there are important differences between our mapping study and Hawton's analysis; Hawton's analysis was based on a small sample size (n=560) of a non-North American MS population, utilised the UK scoring algorithm for the EQ-5D and resulted in higher MAEs than our own.
Limitations
This analysis has some limitations that should be noted. First, we opted to only use OLS regression models to map the MSWS-12 onto the EQ-5D, despite the fact that some researchers have suggested using a censored least absolute deviation, or Tobit approach, because they account for potential ceiling effects (a large percentage of participants with a perfect EQ-5D score of 1.0).9 14 However, we feel that our OLS-only approach was justified based on the low percentage of participants in our population with an EQ-5D score of 1.0, because the OLS approach is the one most commonly used in similar mapping studies and previous analyses using these more complex models have reportedly provided little benefit in most cases.9 14
A second potential limitation of this analysis was the exclusion of demographics in our regression models. While including such additional data could result in a more predictive model, it is possible that many researchers wishing to use a mapping equation may not have access to some or all of the potential demographic criteria needed. This would limit the ability for researchers to use our mapping equation. Also of note, Brazier et al9 found that only 34 of 119 (28.6%) published models included participant demographics such as age, gender, race and income. Next, we used data from respondents to the NARCOMS registry which may not be representative of all patients in North America with MS. Finally, although it would be optimal to validate our mapping equation in an independent dataset, we are unaware of another North American or US data repository for MS patients that contains both the MSWS-12 and the EQ-5D.
Given the above limitations, it should be noted that the use of mapping functions is inferior to using a preference-based measure in the first place. Mapping can only model and capture the overlap between two measures, in this case, the MSWS-12 and the EQ-5D and important details will certainly be lost in the process.9 This being said, the mapping equation reported here may be useful when a health-index value is needed but not available.
Conclusions
The EQ-5D scores can be predicted using all MSWS-12 item scores with reasonable precision in North American patients with MS. Prediction estimates are most precise in patients with moderate mobility impairment.
Supplementary Material
Acknowledgments
Editorial assistance was provided by The Curry Rockefeller Group, LLC.
Footnotes
Contributors: CIC, BLL, SL and MFS had full access to all the data in the study and took responsibility for the integrity of the data and accuracy of the data analysis, and were involved in analysis and interpretation of data, critical revision of the manuscript for important intellectual content and administrative, technical or material support. MFS, BLL and CIC contributed to study the concept and design, acquisition of data, drafting of the manuscript and study supervision. All authors have read and approved the final version of the manuscript.
Funding: This work was supported by Acorda Therapeutics, Inc, Ardsley, New York, USA.
Competing interests: MFS is a paid employee and stockholder of Acorda Therapeutics, Inc. CIC had received research funding from the Agency for Healthcare Research and Quality (AHRQ) and Acorda Therapeutics, Inc.
Provenance and peer review: Not commissioned; externally peer reviewed.
Data sharing statement: No additional data are available.
References
- 1.Frohman EM. Multiple sclerosis. Med Clin North Am 2003;87:867–97 [DOI] [PubMed] [Google Scholar]
- 2.Larocca NG. Impact of walking impairment in multiple sclerosis: perspectives of patients and care partners. Patient 2011;4:189–201 [DOI] [PubMed] [Google Scholar]
- 3.Kobelt G, Berg J, Atherly D, et al. Costs and quality of life in multiple sclerosis: a cross-sectional study in the United States. Neurology 2006;66:1696–702 [DOI] [PubMed] [Google Scholar]
- 4.Hobart JC, Riazi A, Lamping DL, et al. Measuring the impact of MS on walking ability: the 12-item MS Walking Scale (MSWS-12). Neurology 2003;60:31–6 [DOI] [PubMed] [Google Scholar]
- 5.Goodman AD, Brown TR, Krupp LB, et al. Fampridine MS-F203 Investigators Sustained-release oral fampridine in multiple sclerosis: a randomised, double-blind, controlled trial. Lancet 2009;373:732–8 [DOI] [PubMed] [Google Scholar]
- 6.Goodman AD, Brown TR, Edwards KR, et al. MSF204 Investigators A phase 3 trial of extended release oral dalfampridine in multiple sclerosis. Ann Neurol 2010;68:494–502 [DOI] [PubMed] [Google Scholar]
- 7.Gold MR, Siegel JE, Russell LB, et al. eds. Cost-effectiveness in health and medicine. New York: Oxford University Press, 1996 [Google Scholar]
- 8.Shaw JW, Johnson JA, Coons SJ. US valuation of the EQ-5D health states: development and testing of the D1 valuation model. Med Care 2005;43:203–20 [DOI] [PubMed] [Google Scholar]
- 9.Brazier JE, Yang Y, Tsuchiya A, et al. A review of studies mapping (or cross walking) non-preference based measures of health to generic preference-based measures. Eur J Health Econ 2010;11:215–25 [DOI] [PubMed] [Google Scholar]
- 10.Hawton A, Green C, Telford C, et al. The use of multiple sclerosis condition-specific measures to inform health policy decision-making: mapping from the MSWS-12 to the EQ-5D. Mult Scler 2012;18:853–61 [DOI] [PubMed] [Google Scholar]
- 11.Consortium of Multiple Sclerosis Centers CMSC-NARCOMS: information. http://narcoms.org/ (accessed 29 Aug 2012).
- 12.Hohol MJ, Orav EJ, Weiner HL. Disease steps in multiple sclerosis: a longitudinal study comparing disease steps and EDSS to evaluate disease progression. Mult Scler 1999;5:349–54 [DOI] [PubMed] [Google Scholar]
- 13.Marrie RA, Goldman M. Validity of performance scales for disability assessment in multiple sclerosis. Mult Scler 2007;13:1176–82 [DOI] [PubMed] [Google Scholar]
- 14.Longworth L, Rowen D. NICE DSU technical support document 10: the use of mapping methods to estimate health state utility values. www.nicedsu.org.uk/TSD%2010%20mapping%20FINAL.pdf (accessed 10 Oct 2012). [PubMed]
- 15.Gray A, Rivero-Arias O, Clarke PM. Estimating the association between SF-12 responses and EQ-5D utility values by response mapping. Med Decis Making 2006;26:18–29 [DOI] [PubMed] [Google Scholar]
- 16.Tsuchiya A, Brazier J, McColl E, et al. Deriving preference-based single indices from non-preference based condition specific instruments: converting AQLQ into EQ-5D indices. White Rose Research Online. http://eprints.whiterose.ac.uk/10952/ (accessed 5 Nov 2012).
Associated Data
This section collects any data citations, data availability statements, or supplementary materials included in this article.