

Abstract
The development of topographic maps in the primary visual system is thought to rely on a combination of EphA/ephrin-A interactions and patterned neural activity. Here, we characterize the retinogeniculate and retinocollicular maps of mice mutant for ephrins-A2, -A3, and -A5 (the three ephrin-As expressed in the mouse visual system), mice mutant for the β2 subunit of the nicotinic acetylcholine receptor (that lack early patterned retinal activity), and mice mutant for both ephrin-As and β2. We also provide the first comprehensive anatomical description of the topographic connections between the retina and the dorsal lateral geniculate nucleus. We find that, although ephrin-A2/A3/A5 triple knock-out mice have severe mapping defects in both projections, they do not completely lack topography. Mice lacking β2-dependent retinal activity have nearly normal topography but fail to refine axonal arbors. Mice mutant for both ephrin-As and β2 have synergistic mapping defects that result in a near absence of map in the retinocollicular projection; however, the retinogeniculate projection is not as severely disrupted as the retinocollicular projection is in these mutants. These results show that ephrin-As and patterned retinal activity act together to establish topographic maps, and demonstrate that midbrain and forebrain connections have a differential requirement for ephrin-As and patterned retinal activity in topographic map development.
Keywords: ephrin, dorsal lateral geniculate nucleus, superior colliculus, anterograde labeling, axon guidance, development, retina, retinogeniculate, retinotectal
Introduction
Most axonal connections in the CNS are mapped topographically, whereby nearest neighbor relationships of projecting neurons are maintained in their connections within target areas. In this manner, spatial information of inputs is preserved as it is transferred from one area of the nervous system to another. A long-standing model used to study how topographic maps develop is the primary visual system, in particular the retinal projections to the superior colliculus (SC), a two-dimensional (2-D) structure in the midbrain, and the dorsal lateral geniculate nucleus (dLGN), a three-dimensional (3-D) structure in the dorsal thalamus. Topographic mapping along the nasal–temporal (N–T) axis of the visual field onto each of its targets has been postulated to require both EphA/ephrin-A signaling and correlated neural activity (Lemke and Reber, 2005; McLaughlin and O'Leary, 2005). EphA receptor tyrosine kinases and their membrane-bound binding partners, ephrin-As, are axon guidance molecules that are expressed in gradients along the N–T mapping axis throughout the mouse visual system (Flanagan, 2006) (supplemental Fig. 1, available at www.jneurosci.org as supplemental material). Mice mutant for ephrins-A2 and -A5 (Frisén et al., 1998; Feldheim et al., 2000), EphA5 (Feldheim et al., 2004), and EphA7 (Rashid et al., 2005) all have topographic mapping defects along the anterior–posterior (A–P) axis of the SC; however, in none of these mutants is topography completely abolished.
Correlated neural activity is thought to act by Hebbian mechanisms, in which neurons with similar activity patterns are likely to synapse together (Torborg and Feller, 2005). During the first postnatal week in mice, correlations in retinal ganglion cell (RGC) firing arise from nicotinic acetylcholine receptor (nAChR)-dependent retinal waves; in the absence of the β2 subunit of this receptor, waves are disrupted, resulting in minor N–T topographic mapping errors in both the retinocollicular and retinogeniculate projections (Rossi et al., 2001; Grubb et al., 2003; McLaughlin et al., 2003; Cang et al., 2005b; Chandrasekaran et al., 2005). These mapping errors raise the possibility that the remaining topography observed in ephrin-A2/A5 double knock-outs (dkos) could be partly attributable to the presence of patterned retinal activity.
Previously, we have shown that ephrin-As and neural activity have separable activities with respect to the formation of the stereotypical pattern of eye-specific layers in the dLGN (Pfeiffenberger et al., 2005). Early in development, the projection of each eye overlaps in the dLGN, but then segregates, creating eye-specific layers. Inhibition of all activity or removal of β2-dependent patterned retinal activity prevents the segregation of RGC axons into layers (Shatz and Stryker, 1988; Penn et al., 1998; Huberman et al., 2002; Muir-Robinson et al., 2002), whereas loss or gain of EphA/ephrin-A function leads to defects in layer placement within the dLGN, but eye-specific segregation still occurs (Huberman et al., 2005; Pfeiffenberger et al., 2005). Inhibition of retinal waves in ephrin-A2/A3/A5 triple knock-outs (tkos) results in a dLGN in which both layer placement and eye segregation are disrupted (Pfeiffenberger et al., 2005).
Here, we compare the retinocollicular and retinogeniculate topographic maps of adult wild-type mice, mice missing ephrin-As, β2, or a combination of ephrin-As and β2. We find that ephrin-A2/A3/A5 tko mice have more severe mapping defects than ephrin-A2/A5-dko-β2+/− mice, demonstrating a role for ephrin-A3 in topographic mapping. We also find that the ephrin-A2/A3/A5 tko mapping defects are more severe in the SC than in the dLGN, suggesting a differential requirement for ephrin-As in these two areas. Finally, we observe that, whereas β2 mutant mice have more diffuse terminations in the dLGN and SC than wild-type mice, mice missing both ephrins-A2/A5 and β2 have a near absence of map in the SC. These results show that ephrin-As and patterned retinal activity act together to establish topographic maps in the visual system, and that in the absence of these developmental cues, mistakes in mapping persist into adulthood. They also suggest a differential requirement for ephrin-As and patterned retinal activity between midbrain and forebrain visual map development.
Materials and Methods
Animal care and genotyping.
Mice were maintained in the animal facility at the University of California at Santa Cruz (UCSC) and used in accordance with protocols approved by the UCSC Institutional Animal Care and Use Committee. Wild-type mice were from the C57BL/6 strain. Ephrin-A2, -A3, -A5, and β2 mutations were genotyped as previously described (Frisén et al., 1998; Xu et al., 1999; Feldheim et al., 2000; Cutforth et al., 2003).
Axon tracing.
Adult mice [postnatal day 33 (P33) or older] were anesthetized and injected in one eye with 0.1–1 μl of 10% 1,1′-dioctadecyl-3,3,3′,3′-tetramethylindocarbocyanine perchlorate (DiI) (Invitrogen, Eugene, OR) in N,N-dimethyl formamide, and in the other eye with 2–3 μl of a 2 mg/ml solution of cholera toxin B–Alexa Fluor 488 (Invitrogen) in PBS using a pulled micropipette with a Picospritzer III pressure injection system (Parker Hannifin Corporation, Cleveland, OH). On average, DiI injections labeled 1.75 ± 0.81% (n = 37 mice) of the total retinal area, corresponding to an area encompassing ∼1000 RGCs as judged by the fact that we see 19 Pax6-positive cells per 2500 μm2 in the RGC layer of the retina (C. Pfeiffenberger, unpublished observations). However, it is estimated that only ∼40% of RGC axons become labeled after DiI injection, so we estimate that we label ∼400 RGCs per injection (Simon and O'Leary, 1992). DiI injections were positioned in the retina based on the landmarks of the head and were confirmed by the location of SC termination zones (TZs) in wild type. Mice were killed 1 week later (older than P40) and intercardially perfused with 4% paraformaldehyde in PBS. Brains were dissected out, and the cortex covering the SC was removed. Images of whole-mount SCs were captured with an AxioCam Hrm digital camera through a 2.5× objective on an Axioskop 2 Plus microscope (Zeiss, Oberkochen, Germany), blind to genotype. Brains were then embedded in 2–3% agarose (Sigma, St. Louis, MO) in PBS and 200 μm coronal or 100 μm horizontal sections were cut using a vibratome (World Precision Instruments, Sarasota, FL). Brain sections were imaged similarly to whole-mount SCs, but through a 10× objective.
Retinas.
Injected retinas were dissected and flat mounted on glass slides with Fluoromount-G (Southern Biotechnology, Birmingham, AL). Images were captured as above with a 2.5× objective. Retinal tracings were performed using inkscape (www.inkscape.org).
Quantification and representation of data.
Images of whole-mount SC were opened in ImageJ and background was reduced with a 100-pixel rolling ball filter. The SC contralateral to the DiI injection was isolated, and an intensity plot was taken of a rectangular region of one-third of the lateral–medial (L–M) width of the SC and a length equal to the longest A–P dimension. All intensity plots were normalized to an A–P length of 349 pixels, and the intensities were normalized such that all peak intensities of each genotype equal the mean peak intensity value of that group. For numerical comparisons, the distance from the anterior edge of the SC to the center of each TZ was divided by the longest A–P dimension of the SC, and multiplied by 100. The dimensions of the long and short axes of dLGN coronal sections were altered in ImageJ to match the section-specific templates (see Fig. 2C). TZ positions were defined by a coordinate system using the long and short dLGN axes of a coronal section, in which the distances from the most dorsal–medial (DM) and dorsal–lateral (DL) points of the dLGN to the center of the TZ were divided by the length of the long and short axes of the dLGN, respectively. TZ positions were represented on diagrams either by a dot representing the TZ center (see Figs. 2, 4), or by color-coded TZ outlines (see Figs. 6, 7). To determine temporal–ventral (TV) ipsilateral TZ length, the section with the longest TZ was chosen and the DM–ventral-lateral (VL) or A–P length was measured and divided by the total coronal DM–VL length or horizontal A–P length.
Figure 2.
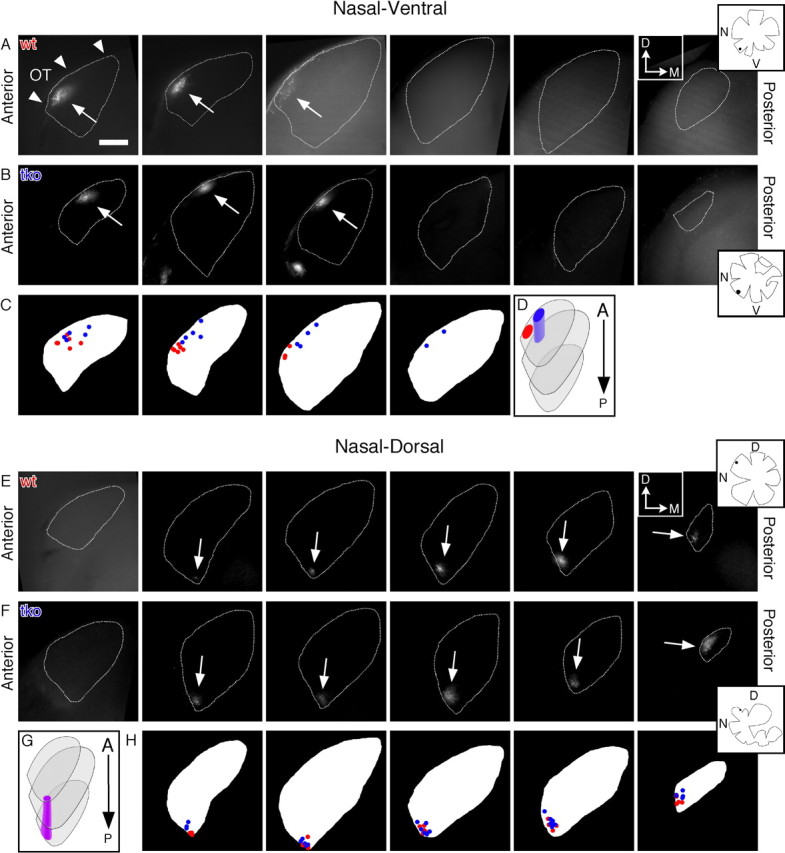
Ephrin-As are required for topographic mapping of nasal retinogeniculate projections. A, B, E, F, Nasal–ventral, but not nasal–dorsal projections are shifted in ephrin-A2/A3/A5 tkos. Fluorescent micrographs are of serial 200 μm coronal dLGN sections from wild-type (wt) (A, E) and ephrin-A2/A3/A5 triple knock-out (tko) mice (B, F), showing DiI-labeled RGC TZs from nasal–ventral (A–D) and nasal–dorsal (E–H) retina in adult mice. The arrowheads in A identify the location of the optic tract (OT) for all coronal dLGN sections; the arrows identify the location of TZs. Sections are positioned anterior-to-posterior, left-to-right. The dotted line marks the boundaries of the dLGN contralateral to the injected eye. The insets are tracings of the flat-mounted retina and injection site (black dot) associated with each row of dLGN images. Scale bar, 200 μm. Diagrams (C, H) represent the TZ position within each coronal dLGN section for every mouse of each genotype and injection position analyzed. Schematics (D, G) demonstrate the TZ positions as seen in coronal sections, in a 3-D dLGN, showing a shift in ephrin-A2/A3/A5 tkos in nasal–ventral projections, but no noticeable change in nasal–dorsal projections. Wild type is red, ephrin-A2/A3/A5 tko is blue, and overlap is purple. D, Dorsal; M, medial; A, anterior; P, posterior; N, nasal; T, temporal; V, ventral. Wild type, NV, n = 6 mice; ND, n = 5. Ephrin-A2/A3/A5 tko, NV, n = 5; ND, n = 6.
Figure 4.

Temporal projections are shifted ventrally in ephrin-A2/A3/A5 tko dLGNs. Fluorescent micrographs of a series of 200 μm coronal dLGN sections from wild type (wt) (A, E) and ephrin-A2/A3/A5 triple knock-out (tko) mice (B, F), showing DiI-labeled RGC TZs from temporal–ventral (A–D) and temporal–dorsal (E–H) adult retina. The arrows identify the location of TZs. The insets are tracings of the flat-mounted retina and injection site (black dot) associated with each row of dLGN images. Sections are positioned anterior-to-posterior, left-to-right. The dotted line marks the boundaries of the dLGN contralateral to the injected eye. Scale bar, 200 μm. Diagrams (C, H) represent the TZ position within each coronal dLGN section for every mouse analyzed of each genotype and injection position. Schematics (D, G) demonstrate the TZ positions as seen in coronal sections in a 3-D dLGN, showing a ventral–lateral shift in temporal projections. Wild type is red, and ephrin-A2/A3/A5 tko is blue. D, Dorsal; M, medial; A, anterior; P, posterior; N, nasal; T, temporal; V, ventral. Wild type, TV, n = 4 mice; TD, n = 5. Ephrin-A2/A3/A5 tkos, TV, n = 4; TD, n = 7.
Figure 6.

Retinogeniculate topography is severely disrupted in ephrin-A2/A5,β2 tko adult mice. Fluorescent micrographs of a series of 200 μm coronal dLGN sections from ephrin-A2/A5,β2 tkos (A25β2) labeled with DiI in nasal–ventral (A) and temporal–ventral (C) adult retina. The arrows identify the location of TZs, and the arrowhead identifies an arborization ending in a small termination outside of the main TZ. The insets are tracings of the flat-mounted retina and injection site (black dot) associated with each row of dLGN images. Coronal sections are positioned anterior-to-posterior, left-to-right. The dotted line marks the boundaries of the dLGN contralateral to the DiI-injected eye. Scale bar, 200 μm. B, D, Summary drawings representing TZ outlines from each wild type (wt), ephrin-A2/A5-dko-β2+/− (A25β2+/−), and ephrin-A2/A5,β2 tko mouse (A25β2) analyzed for each retinal position. Each color represents one mouse in each genotype and injection position. Dorsal–medial is up, and medial–ventral is right. E, Schematic represents the ephrin-A2/A5,β2 tko TZ positions in 3-D, demonstrating that NV and TV projections shift toward one another along the optic tract, but do not reach the opposite pole. NV is red, and TV is blue. D, Dorsal; M, medial; N, nasal; T, temporal; V, ventral. Wild type, NV, n = 6 mice; TV, n = 4. Ephrin-A2/A5-dko-β2+/−, NV, n = 5; TV, n = 4. Ephrin-A2/A5,β2 tko, NV, n = 5; TV, n = 4.
Figure 7.

Retinogeniculate topography is severely disrupted in ephrin-A2/A5,β2 tko adult mice. Fluorescent micrographs are a series of 200 μm coronal dLGN sections from ephrin-A2/A5,β2 tkos (A25β2), showing DiI-labeled RGC TZs from ND (A) and TD (C) retina in adult mice. The arrows identify the location of TZs. The insets are tracings of the flat-mounted retina and injection site (black dot) associated with each row of dLGN images. Coronal sections are positioned anterior-to-posterior, left-to-right. The dotted line marks the boundaries of the dLGN contralateral to the DiI-injected eye. Scale bar, 200 μm. B, E, Summary drawings representing TZ outlines from each wild type (wt), ephrin-A2/A5-dko-β2+/− (A25β2+/−), and ephrin-A2/A5,β2 tko mouse (A25β2) analyzed for each retinal position. Each color represents one mouse in each genotype and injection position. Dorsal–medial is up, and ventral–medial is right. D, Schematic demonstrates the ephrin-A2/A5,β2 tko TZ positions as seen in coronal sections in a 3-D dLGN, demonstrating that, although TD projections spread to the ND wild-type position, ND projections do not have a noticeable change. ND is green, and TD is yellow. D, Dorsal; M, medial; N, nasal; T, temporal; V, ventral. Wild type, ND, n = 5 mice; TD, n = 5. Ephrin-A2/A5-dko-β2+/−, ND, n = 4; TD, n = 5. Ephrin-A2/A5,β2 tko, ND, n = 4; TD, n = 6.
A–P position information in the dLGN was determined by measuring the distance from the anterior edge of a horizontal dLGN section to the anterior and posterior edges of each TZ. The distances were then divided by the total A–P length of that section. For nasal–ventral (NV) injections, the section with the longest TZ along the A–P axis was chosen for analysis and graphical comparison. For nasal–dorsal (ND) injections, the two most ventral sections were treated as one section, in which the dLGN A–P length of the two sections were added together, as were the A–P lengths of the TZ in each section. In ephrin-A2/A3/A5 tkos, the lengths of only the anterior TZs in each section were added together, whereas the posterior TZ was considered alone. For TV ipsilateral projections, only the distance to the anterior edge of each TZ was used to define A–P position.
In situ RNA hybridization.
Antisense and sense digoxigenin-labeled RNA probes for ephrin-A2 (nucleotides 102–627 of the open reading frame), ephrin-A3 (nucleotides 102–682 of the open reading frame), and EphA4 (nucleotides 402–786 of the open reading frame) were used for frozen section in situ hybridization as described previously (Feldheim et al., 1998). Images of stained sections were captured with a cool-pix digital camera (Nikon, Tokyo, Japan) mounted on a dissecting microscope.
Results
Ephrin-A3 participates in retinocollicular mapping
Ephrins-A2 and -A5 are required to establish the topographic map from the N–T retinal axis to the A–P axis of the SC; however, topography is not completely abolished in ephrin-A2/A5 dkos, suggesting that additional factor(s) play a role in the mapping of this axis (Feldheim et al., 2000). Previously, we showed that ephrin-A3 is expressed in both the lateral geniculate nucleus (LGN) and VI primary visual cortex during development (Cang et al., 2005a; Pfeiffenberger et al., 2005); here, we show that ephrin-A3 is also expressed in both the retina and SC during retinocollicular map formation. Unlike ephrins-A2 and -A5, ephrin-A3 is expressed uniformly in both of these regions (supplemental Fig. 1, available at www.jneurosci.org as supplemental material).
To determine whether ephrin-A3 contributes to the establishment of retinotopy in the SC, we compared the topographic maps of adult (older than P40) wild-type, ephrin-A3−/−, ephrin-A2/A3/A5 tko, and ephrin-A2/A5-dko-β2+/− mice. We assayed map topography in adult mice to focus on mapping defects that cannot be compensated for by additional development or visual experience. We used ephrin-A2/A5-dko-β2+/− mice in this comparison, rather than ephrin-A2/A5 dkos, because these could be subsequently used in our analysis of ephrin-A2/A5,β2 tkos (see Figs. 5–7). Whereas β2 mutant mice have defects in early postnatal retinal wave formation, eye-specific segregation of inputs into the dLGN, and retinocollicular and retinogeniculate mapping, β2 heterozygous mice are indistinguishable from wild-type mice (Bansal et al., 2000).
Figure 5.

Ephrin-As and neural activity act together to establish the N–T mapping axis in the SC. Retinal axons labeled by focal DiI injection were visualized in adult mice by fluorescence microscopy of SC whole mounts. A–C, TV injections. D–F, NV injections. A, D, β2 heterozygous mice injected in the TV or NV retina have TZs that are shaped and positioned similar to wild type and give rise to a single TZ located at the extreme anterior–medial and posterior–medial SC, respectively. B, E, Similar injections in β2 mutant mice give rise to diffuse TZs that are in the topographically correct location. C, F, TV and NV injections in ephrin-A2/A5,β2 tkos give rise to TZs that spread diffusely along the A–P axis of the SC. The insets are tracings of the flat-mounted retinas and injection sites (black dot) associated with each SC image. The dotted line represents the boundary of the SC contralateral to the DiI-injected eye. Anterior is at the top, and medial is to the right. Scale bar, 600 μm. Graphs adjacent to each image are intensity plot profiles of the SCs from every mouse analyzed for each injection position and genotype, demonstrating the faint and diffuse nature of the ephrin-A2/A5-dko-β2+/− (A25β2) TZ, with a peak of intensity at the wild-type position. G, DiI injection size did not differ between wild-type and β2−/− mice. The graph compares DiI injection size in the retinas of wild-type (n = 16) and β2−/− (n = 21) mice. L, Lateral; M, medial; A, anterior; P, posterior; N, nasal; T, temporal; V, ventral. β2+/−, NV, n = 3 mice; TV, n = 4; β2−/−, NV, n = 3; TV, n = 4. Ephrin-A2/A5,β2 tkos, NV, n = 6, TV, n = 4.
To characterize retinotopy, we anterograde labeled discrete subsets of RGCs from four retinal locations [NV, ND, TV, and temporal–dorsal (TD)] with the lipophilic fluorescent tracer DiI and examined the termination patterns of RGCs in both the SC and dLGN. In wild-type and ephrin-A3−/− mice, each retinal injection resulted in a single TZ that moved around the periphery of the SC in correlation with the injection site (Fig. 1A,D,G,J; supplemental Fig. 2, available at www.jneurosci.org as supplemental material).
Figure 1.

There are severe defects in retinocollicular topography in ephrin-A2/A3/A5 tkos. Retinocollicular topography was compared among wild type (A, D, G, J), ephrin-A2/A5-dko-β2+/− (B, E, H, K), and ephrin-A2/A3/A5 tkos (C, F, I, L). A–L, Retinal axons from temporal–dorsal injections (A–C), nasal–dorsal injections (D–F), temporal–ventral injections (G–I), and nasal-ventral injections (J–L) labeled by focal DiI injection were visualized in adult mice by fluorescence microscopy of SC whole mounts. The dotted line marks the boundary of the SC contralateral to the injected retina. Scale bar, 600 μm. The insets are tracings of the flat-mounted retina and injection site (black dot) associated with each SC image. To the right of each image are intensity plot profiles of the SCs from every mouse analyzed for each genotype and injection position. Spikes in intensity are associated with TZs, with an arbitrary scale of pixel intensity ranging from 0 to 100 from gridline to gridline. A, Anterior; P, posterior; L, lateral; M, medial; D, dorsal; V, ventral; N, nasal; T, temporal; wt, wild type; dko, ephrin-A2/A5 double knock-out β2+/−; tko, ephrin-A2/A3/A5 triple knock-out. Wild type, TD, n = 9 mice; ND, n = 8; TV, n = 10; NV, n = 7. Ephrin-A2/A5-dko-β2+/− mice, TD, n = 5; ND, n = 5; TV, n = 5; NV, n = 9. Ephrin-A2/A3/A5 tko, TD, n = 10; ND, n = 10; TV, n = 9; NV, n = 9.
In contrast to what was seen in wild type and ephrin-A3−/−, DiI labeling of RGCs from both ephrin-A2/A5-dko-β2+/− mice and ephrin-A2/A3/A5 tkos resulted in multiple TZs that were in topographically incorrect locations. Quantification of the number and location of TZs shows that ephrin-A3 has a statistically significant effect on map formation in this sensitized genetic background. For example, all injections in ephrin-A2/A3/A5 tkos gave rise to multiple TZs regardless of the retinal location (17 of 17 nasal; 17 of 17 temporal), whereas multiple TZs did not result from the majority of temporal axon tracings in ephrin-A2/A5-dko-β2+/− mice (9 of 9 nasal; 4 of 10 temporal) (Fig. 1B,C;E,F;H,I;K,L; supplemental Fig. 3, available at www.jneurosci.org as supplemental material). Furthermore, in the four ephrin-A2/A5-dko-β2+/− temporal tracings with two TZs, the erroneously positioned TZs were small and only visible after sectioning (supplemental Fig. 3, available at www.jneurosci.org as supplemental material).
NV and ND retinal injections, which normally project to the posterior–medial and posterior–lateral SC, respectively, produce multiple TZs that spread out along the A–P axis of the SC in both ephrin-A2/A5-dko-β2+/− mice and ephrin-A2/A3/A5 tkos (Fig. 1D–F,J–L). However, projections in ephrin-A2/A3/A5 tkos resulted in TZs significantly farther anterior than in the ephrin-A2/A5-dko-β2+/− mice, with the position of the most anterior TZ offering the clearest distinction [average percentage A–P location (A = 0, P = 100): ephrin-A2/A5-dko-β2+/−, ND = 47 ± 9, NV = 40 ± 12; ephrin-A2/A3/A5 tko, ND = 30 ± 8, NV = 5 ± 2; p < 0.002, Student's t test] (Fig. 1D–F,J–L).
TV and TD RGCs, which project to the anterior–medial and anterior–lateral SC, respectively, in wild-type mice, project in a mostly normal manner in ephrin-A2/A5-dko-β2+/− mice (Fig. 1A–C,G–I; supplemental Fig. 3, available at www.jneurosci.org as supplemental material). Similar injections in ephrin-A2/A3/A5 tkos resulted in multiple TZs that could be found anywhere along the A–P axis. TD projections resulted in 2–4 TZs (mean, 3.3 ± 0.9 TZs; n = 9 mice), the positioning of which varied between mice. TV projections tended to produce 3 TZs (mean = 2.7 ± 0.5 TZs; n = 10 mice) that remained restricted to the anterior one-half of the SC in all but one mouse (Fig. 1A–C,G–I).
Together, these results demonstrate that ephrin-A3 participates with ephrins-A2 and -A5 in the formation of retinocollicular topography along the N–T mapping axis, and that mice without ephrins-A2, -A3, and -A5 have severely disrupted topography along this axis.
Retinogeniculate mapping defects in ephrin-A2/A3/A5 tkos
The retina also projects topographically to the dLGN, a 3-D bean-shaped nucleus in the dorsal thalamus. Ephrins-A2, -A3, and -A5 are the three ephrin-As expressed in the dLGN; ephrins-A2 and -A5 are expressed in an AVL (anterior–ventral–lateral) (high)-to-PDM (posterior–dorsal–medial) (low) gradient, whereas ephrin-A3 is expressed at a low uniform level (Feldheim et al., 1998; Pfeiffenberger et al., 2005) (supplemental Fig. 1, available at www.jneurosci.org as supplemental material).
To determine the requirement for ephrin-As in the establishment of retinogeniculate topography, we sectioned brains from the same DiI-injected mice (those used above for studying the SC maps) to reveal TZs in the dLGN. We then quantified both the number of TZs and their location along the A–P and DM–VL axes of the dLGN.
In wild-type mice, there is clear retinotopy in the retinogeniculate projection, with each retinal injection resulting in a single TZ in the dLGN (Figs. 2–4). Consistent with what has been reported by others, we find that the N–T retinal axis maps onto the ventral-lateral–dorsal-medial axis of the dLGN, and the dorsal–ventral (D–V) retinal axis maps along the ventral-medial–dorsal-lateral axis (Figs. 2–4) (Montero et al., 1967; Lund et al., 1974; Feldheim et al., 1998; Grubb et al., 2003).
Figure 3.

Ephrin-A2/A3/A5 tko nasal retinogeniculate projections have anterior–posterior mapping defects. Whereas projections in wild type lead to a single termination, a single nasal injection in ephrin-A2/A3/A5 tkos can lead to two terminations, along with a posterior shift. A–C, E–G, Fluorescent micrographs of horizontal dLGN sections of nasal–ventral- (A–C) and nasal–dorsal-injected (E–G) RGCs from wild type (wt) (A, E) and two ephrin-A2/A3/A5 triple knock-out mice (tko1 and tko2; B, C, F, G). Adjacent 100 μm sections are shown for nasal–dorsal injections, with the more dorsal section to the left. DiI (red) was injected into nasal–dorsal retina of the left eye, and cholera toxin B–Alexa 488 (green) was injected into the right eye to label the ipsilateral projection. The ipsilateral layer may limit the positioning options of the nasal–dorsal projection, leading to a more narrow termination and a posterior shift of a portion of the TZ. The arrowheads (F, G) show regions in which the ipsilateral layer is adjacent to TZ. The arrows (F, G) point to nasal–dorsal TZs present in the most posterior–ventral–lateral dLGN. The dotted lines mark the boundary of the dLGN contralateral to the DiI-injected eye. The green regions outside the dLGN in E–G are ventral lateral geniculate nucleus. The insets are tracings of the flat-mounted retina and injection site (black dot) associated with each dLGN image(s). Scale bar, 200 μm. D, H, Diagrams representing the A–P spread and positioning of every mouse analyzed. Each line or pair of lines along the vertical axis represents the TZ(s) of a single mouse. The vertical length of the box represents the A–P length of the dLGN in the region of the TZ (see Materials and Methods). Red is wild type, and blue is ephrin-A2/A3/A5 tko. D, Dorsal; M, medial; A, anterior; P, posterior; N, nasal; T, temporal; V, ventral. Wild type, NV, n = 5 mice; ND, n = 6. Ephrin-A2/A3/A5 tko, NV, n = 6; ND, n = 4.
TZ morphologies in the dLGN are columnar rather than spherical, with the length of columns varying with retinal position (Figs. 2–4; supplemental Fig. 1G, available at www.jneurosci.org as supplemental material). TZs from nasal RGCs extend farther anterior along the dLGN than those from temporal retina, whereas dorsal RGC TZs extend farther posterior than those from ventral retina. Columnar TZs are reminiscent of the functional lines of projection that cross eye-specific layers of the dLGN in binocular species, as determined by visually evoked physiological recordings (Bishop et al., 1962; Montero et al., 1967). These columns could indicate the existence of equivalence zones of mapping information in the dLGN, allowing for functional subtypes of RGCs responsible for monitoring the same area of the visual field to segregate, yet still map together in a 3-D structure.
Ephrin-A2/A3/A5 tkos have severe topographic mapping errors in the retinogeniculate projection. In wild-type mice, NV axons (which terminate in the posterior–medial SC) terminate in the most anterior two to three of six 200 μm coronal dLGN sections. Within these sections, the TZ is located very near the optic tract and roughly two-thirds down the long axis of the dLGN from the most dorsal point (Fig. 2A;C,D). In ephrin-A2/A3/A5 tkos, there is a small but significant dorsal–medial shift of the NV projection TZ along the optic tract (p < 0.001, Student's t test), as well as a notable posterior spread, with the TZ present throughout the three to four most anterior coronal sections (Fig. 2B–D). This A–P positioning defect can also be seen in horizontal dLGN sections, which reveal both a significant posterior spread (position of most posterior edge of the TZ as a percentage of the A–P length of the longest dLGN section (see Materials and Methods): wild type, 24.0 ± 5.0%; ephrin-A2/A3/A5 tko, 60.0 ± 7.6%; p ≪ 0.0001, Student's t test) and two TZs along the A–P axis (Fig. 3A–D).
ND DiI injections (which terminate in posterior–lateral SC) trace axons that project to the most posterior four to five coronal sections of the dLGN in wild-type mice (Figs. 2E;G,H; 3E). Within these sections, the TZ is positioned near the most ventral dLGN (Fig. 2E;G,H). ND projections in ephrin-A2/A3/A5 tkos result in two TZs that align along the A–P axis (Figs. 2E–H, 3E–H).
In ephrin-A2/A3/A5 tkos, the ipsilateral layer extends significantly farther ventral–laterally in the dLGN than in wild-type mice (Pfeiffenberger et al., 2005). This erroneously positioned ipsilateral layer may limit the positioning options of the ND projection; in every case, we found the anterior-most ND TZ located between the ipsilateral patch and the lateral edge of the dLGN (four of four mice horizontally sectioned) (Fig. 3F,G, arrowheads).
The TV retina (which terminates in anterior–medial SC) contains both contralaterally and ipsilaterally projecting RGCs. In wild-type mice, TV contralateral projections terminate in a single section in the middle of the dLGN along the A–P axis. Within this section, the TZ is positioned at the most dorsal–medial point of the dLGN near the optic tract (Fig. 4A;C,D). The ipsilateral projections also terminate within a single coronal section positioned in the anterior one-half of the dLGN (supplemental Fig. 4, available at www.jneurosci.org as supplemental material).
In ephrin-A2/A3/A5 tkos, contralateral TV TZs are present in one or two sections in the middle of the dLGN along the A–P axis, with no significant A–P shift apparent in either coronal (Fig. 4A–D) or horizontal sections (data not shown). The TZs remain adjacent to the optic tract, but shift ventral–laterally to nearly halfway down the long axis of the dLGN (Fig. 4A–D) (p < 0.002, Student's t test). Unlike NV and ND projections, TV projections resulted in a single TZ in all but one case (n = 9 mice). Interestingly, in this exception, the pair of TZs mimicked a doublet seen in the ipsilateral projection (supplemental Fig. 5A, available at www.jneurosci.org as supplemental material). This could indicate an attempt by the two dLGNs to match their visual maps.
TD projections (which terminate in anterior–lateral SC) were found in the most posterior one-half of the dLGN, positioned along the ventral–lateral edge of the ipsilateral layer (Fig. 4E;G,H). In coronal sections, a ventral–lateral shift is apparent in ephrin-A2/A3/A5 tkos, with the position of some TZs resembling wild-type ND injections (compare Figs. 4E–H, 2E;G,H). A branching TZ was apparent in a small number of cases (2 of 12 mice). In both of these cases, one arm of the TZ was present near the medial edge of the dLGN, whereas the other was shifted laterally toward the optic tract (supplemental Fig. 5B, available at www.jneurosci.org as supplemental material). There was considerable variability of TZ location along the A–P axis of the dLGN, ranging from TZs present in only one section near the posterior dLGN to extending throughout all but the most anterior section.
In summary, RGC TZs in the contralateral dLGN are topographic in nature and columnar in shape. As in the retinocollicular projection, adult mice mutant for ephrins-A2, -A3, and -A5 have defects in topography along the N–T mapping axis. There are two intriguing differences between the ephrin-A2/A3/A5 tko mapping phenotypes observed in the retinal projections to the 2-D SC and 3-D dLGN: (1) ephrin-A2/A3/A5 tko topographic mapping defects were less severe in the retinogeniculate projection than the retinocollicular projection, and (2) there were more TZs per injection in the SC than in the dLGN (as many as 6 TZs; mean, 2.9 TZs/injection; 24 of 24 mice with multiple TZs in the SC) (but never >2 TZs; mean, 1.4 TZs/injection; 9 of 22 mice with multiple TZs in the dLGN). For these reasons, it appears that the dependency on EphA/ephrin-A mapping mechanisms is unequal between these two direct retinal targets.
The mapping effects of ephrin-As and patterned retinal activity are additive
To determine the role that β2-dependent patterned retinal activity plays in topographic map formation in the SC and dLGN, as well as the consequences of removing both ephrin-As and β2, we analyzed the topographic maps of β2 mutants and ephrin-A2/A5,β2 tkos. Because ephrin-A3 and β2 are genetically linked on chromosome 3, we were unable to create an ephrin-A2/A3/A5,β2 quadruple knock-out. As shown previously at P14 and P21, we found that DiI-labeled subsets of RGCs in adult β2 mutants result in TZs that are positioned in the topographically correct locations of the SC and dLGN, but are larger and more diffuse. Although larger, the overall shape of the TZs in β2 mutants were similar to wild type, suggesting that β2-dependent mapping mechanisms may act along both the N–T and D–V mapping axis (Grubb et al., 2003; McLaughlin et al., 2003; Chandrasekaran et al., 2005) (Fig. 5; supplemental Fig. 6, available at www.jneurosci.org as supplemental material). In the absence of β2 in combination with ephrin-A2/A5, we found that topographic order along the N–T mapping axis of the SC is nearly abolished. Both nasal and temporal ephrin-A2/A5,β2 tko retinal injections resulted in a single, large TZ that spread out along the majority of the A–P axis, albeit with some focus in the wild-type position (Fig. 5; supplemental Fig. 7, available at www.jneurosci.org as supplemental material). These TZs were very faint and diffuse, at times barely visible above background. This dimness often made determining the TZ boundaries difficult; however, in several cases (7 of 10 mice), TZs from temporal injections extended extensively posterior, in stark contrast to the nearly normal projection of temporal axons in ephrin-A2/A5-dko-β2+/− littermates (Fig. 5E,F; supplemental Fig. 7, available at www.jneurosci.org as supplemental material). Despite an almost complete abolishment of topography along the A–P axis of the SC, the TZs still maintained rough L–M topography.
RGC axons traverse the SC below the surface and then arborize in the superficial layer at the correct topographic location (Valverde, 1973; Sachs and Schneider, 1984). To verify that the faint TZs seen in ephrin-A2/A5,β2 tkos are not the result of decreased innervation of the SC or its superficial layer, we visualized DiI-labeled RGC axons in coronal SC sections to determine axonal morphology and termination sites. In ephrin-A2/A5,β2 tkos, RGC axons branched into the superficial layer of the SC (supplemental Fig. 7, available at www.jneurosci.org as supplemental material). This suggests that the lack of both ephrin-As and β2-dependent retinal activity does not affect RGC pathfinding, target recognition, or layer specificity in the SC, but profoundly affects retinocollicular topographic mapping along the N–T mapping axis.
We next analyzed the retinogeniculate projections of ephrin-A2/A5-dko-β2+/− mice and ephrin-A2/A5,β2 tkos. Ephrin-A2/A5-dko-β2+/− mice have few mapping errors regardless of retinal position, producing TZs in similar locations as seen in wild-type mice (n = 21 ephrin-A2/A5-dko-β2+/− mice) (Figs. 6, 7). Notably, projections from most retinal positions had major topographic mapping errors in ephrin-A2/A5,β2 tkos, resulting in faint and diffuse TZs, similar to that observed in the retinocollicular projection. In many cases, individual labeled-axons could be seen throughout the main TZ as well as the entire dLGN, at times ending in small terminations (Fig. 6, arrowhead). In several instances, the TZs preferentially spread out along the N–T mapping axis, shifting ventral–laterally in the case of TD and TV axons (three of six TD; four of four TV) and dorsal–medially for NV axons (three of five mice) (Figs. 6, 7C–E).
Temporal injections produced TZs that spread out along the DM-VL axis (three of six TD; four of four TV); however, TV TZs remained pressed up against the optic tract and TD TZs against the medial edge as in wild type. The most elongated regions of the temporal TZs often appeared to break up into multiple terminations (Figs. 6C,D, 7C,E) (5 of 10 mice with fragmented TZs). NV projections spread out along the optic tract, extended significantly posterior, and partially overlapped the TV TZ in multiple sections (Fig. 6).
Notably, the ephrin-A2/A5,β2 tko ND projection was not affected to nearly the same degree as the other retinal regions. Similar to ND axons in β2−/−, these TZs were diffuse, but not preferentially spread in a single direction (Fig. 7A,B;D). Overall, a loss of both ephrin-As and β2 results in a more severe retinogeniculate mapping phenotype than either alone, especially so for temporal RGCs; however, the mapping defects we find in this projection are not as strong as those of the retinocollicular projection.
Discussion
As is the case for many projections in the CNS, the projections from the retina to the SC and dLGN are arranged topographically. Mapping along the N–T axis of these connections has been proposed to use a combination of EphA/ephrin-A signaling (Feldheim et al., 1998, 2000, 2004; Frisén et al., 1998; Rashid et al., 2005), patterned retinal activity-dependent axonal refinement (Ruthazer and Cline, 2004; Torborg and Feller, 2005), and axon–axon competition to ensure innervation of the entire target (Walsh et al., 1983; Garraghty, 1995); however, the relative roles of each are not known. Here, using anterograde labeling of RGCs from four retinal poles, we provided the first thorough characterization of the topographic retinogeniculate projection in wild-type mice. We also showed that ephrin-A3 participates in mapping the N–T axis onto both the SC and dLGN. We find that mice mutant for the three ephrin-As expressed in the visual system have severe topographic mapping errors that vary in severity depending on retinal position and target nucleus. Finally, we report severely disrupted topography along the N–T axis in ephrin-A2/A5,β2 tkos, including a near absence of map in the retinocollicular projection, indicating that a combination of ephrin-As and patterned retinal activity are used to form topographic maps in the dLGN and SC (Fig. 8).
Figure 8.

A combination of ephrin-As and β2-dependent retinal activity is required to map the N–T mapping axis of the retinocollicular and retinogeniculate projections. Wild-type mice have gradients of EphA and ephrin-A expression in both the retina and its subcortical targets, the SC and dLGN, and patterned retinal activity in the form of waves. In ephrin-A2/A3/A5 tkos, retinal waves still persist, and these mice exhibit mapping defects in the SC and dLGN that are constrained to the N–T mapping axis. In ephrin-A2/A5,β2 tkos, both ephrin-As and correlated retinal activity are disrupted, leading to stronger mapping defects in both visual structures, resulting in a near absence of map in the SC. Although retinogeniculate mapping is disrupted in both ephrin-A2/A3/A5 tkos and ephrin-A2/A5,β2 tkos, topographic bias still exists in both genotypes, suggesting that other guidance mechanisms remain in this system. DiI injection positions are color coded in the retina, with the color maintained in the SC and dLGN TZs. Tracings adjacent to “cholinergic waves” represent the correlated activity of neighboring RGCs during the first postnatal week that is uncorrelated in β2 mutants. D, Dorsal; N, nasal; T, temporal; V, ventral; A, anterior; P, posterior; M, medial.
Ephrin-A3 contributes to topographic map formation
In mice mutant for ephrins-A2 and -A5, topography along the N–T mapping axis is disrupted but not completely abolished, suggesting that additional factor(s) are required to map this axis. Ephrin-A3 is expressed in the dLGN, the SC, and the RGC layer of the retina (supplemental Fig. 1, available at www.jneurosci.org as supplemental material) (Pfeiffenberger et al., 2005), and has been demonstrated to play a role, together with ephrins-A2 and -A5, in mapping several regions of the visual system (Cang et al., 2005a; Pfeiffenberger et al., 2005). Here, we compared retinotopy in ephrin-A2/A5 dkos and ephrin-A2/A3/A5 tkos, and showed that ephrin-A3 indeed enhances the ephrin-A2/A5 dko mapping phenotype.
Because ephrin-As can act as both ligands and receptors in retinal projections (Davy and Soriano, 2005), it is not known whether ephrin-A3 function in topographic mapping is attributable to its expression in the retina, its targets, or both. Furthermore, it is unclear how the uniform expression pattern of ephrin-A3 provides guidance information. One possibility is that the uniform expression of ephrin-A3 is manipulated into a functional gradient. For example, cis-interactions with graded EphA receptors could inactivate ephrin-A3 via a masking mechanism (Carvalho et al., 2006). Alternatively, if ephrin-A3 is acting as a receptor in the retina, it could be accompanied by a coreceptor expressed in a gradient. Future studies using mouse conditional knock-out technology will be needed to definitively resolve these issues.
The ephrin-A contribution to retinocollicular and retinogeniculate topographic map formation is unequal
Our anterograde analysis of retinotopy in adult mice finds that the severe mapping defects that occur in ephrin-A2/A3/A5 tkos are more prominent in the retinocollicular than the retinogeniculate projection for both TZ positioning and number. For instance, in ephrin-A2/A3/A5 tkos, most topographic errors were shifted <50% of the length of the N–T mapping axis of the dLGN, but >70% in the SC, with nasal retinocollicular projections forming TZs in both the wild-type nasal and temporal locations (Figs. 1–4). In addition, retinal axons projecting to the SC of ephrin-A2/A3/A5 tkos resulted in more TZs per injection than those targeted to the dLGN (SC mean, 2.9 term/injection, 24 of 24 mice with multiple TZs; dLGN mean, 1.4 term/injection, 12 of 22 mice with multiple TZs). These data reveal the differing influences of ephrin-A-dependent and -independent mapping mechanisms in these two primary visual areas.
Severely defective mapping of the N–T axis in the ephrin-A2/A5,β2 tko retinocollicular projection
The development of normal retinotopy has been shown to depend on a type of patterned retinal activity termed retinal waves. Much recent work has used mice mutant for the β2 subunit of the nAChR as a model to study the role of retinal waves in visual map development (Rossi et al., 2001; Muir-Robinson et al., 2002; Grubb et al., 2003; McLaughlin et al., 2003; Chandrasekaran et al., 2005). β2−/− mice have similar levels of spontaneous retinal activity as wild type; however, they do not form retinal waves during the first postnatal week. These mice also have defects in axonal refinement, which result in minor mapping errors in the retinal projections to the SC and dLGN. Previous work using physiological recordings of visual responses have shown that β2 mapping errors are more severe along the N–T axis than the D–V mapping axis (Muir-Robinson et al., 2002; Grubb et al., 2003; McLaughlin et al., 2003; Chandrasekaran et al., 2005).
To determine whether β2-dependent retinal activity is responsible for the remaining topography observed in ephrin-A2/A3/A5 tkos, we compared the topographic maps of wild-type, β2−/−, ephrin-A2/A5-dko-β2+/−, and ephrin-A2/A5,β2 tko mice. Similar to what has been seen previously with anatomical tracing at P14 and P21 (Grubb et al., 2003; Chandrasekaran et al., 2005), we see that adult mice mutant for β2 have defects in RGC termination refinement, resulting in TZs that are larger and more diffuse than wild type (Fig. 5; supplemental Fig. 6, available at www.jneurosci.org as supplemental material).
Our analysis of mice deficient for both ephrin-As and β2 identified a near absence of map along the N–T mapping axis of the SC (Fig. 5; supplemental Fig. 7, available at www.jneurosci.org as supplemental material). DiI injections in these mice led to a smear of arbors along the entire A–P axis, demonstrating that the N–T mapping information that remains in ephrin-A2/A3/A5 tkos is regulated by β2-dependent correlated retinal activity, and that these two mechanisms encode the bulk of N–T topographic mapping information. Although our studies have focused on the mapping mechanisms of the N–T axis, it is likely that β2-dependent correlated neural activity will combine with EphB/ephrin-B- and/or Wnt-signaling to map the D–V retinal axis (Hindges et al., 2002; Mann et al., 2002; Schmitt et al., 2006).
How does retinal activity provide topographic information? Activity might play a direct role, in which EphA/ephrin-A interactions control the orientation and rough topography of retinocollicular projections, whereas correlated retinal activity organizes local neighbor–neighbor relationships of RGC axons via correlated firing patterns that reward these axons that are in competition for synaptic space. Alternatively, in a mechanism similar to that proposed to explain how spontaneous spinal cord activity regulates motor neuron pathfinding decisions (Hanson and Landmesser, 2004), retinal activity may regulate the function or expression of non-ephrin-A axon guidance molecules that provide N–T mapping information. For example, if N–T topography is governed by two sets of graded repellent molecules (for instance, ephrin-As and engrailed) (Brunet et al., 2005) and the expression or the release of engrailed is regulated by neural activity, then the combined removal of ephrin-As and β2 would eliminate all mapping information.
Although our analysis of the retinogeniculate mapping defects of ephrin-A2/A5,β2 tkos showed that ephrin-As and activity both contribute to mapping, this map is not as severely disrupted as the retinocollicular projection. As was the case for ephrin-A2/A3/A5 tkos, the retinogeniculate mapping defects varied in severity based on retinal location. In many cases, projections from NV and TV retina spread toward one another in the dLGN and partially overlapped, yet never reached the opposite end of the N–T axis (three of six NV projections and four of four TV projections with partial overlap). We also found that, although TD RGC projections into the dLGN could spread out along the entire local N–T axis (three of six mice), the ND projection never spread significantly away from the topographically correct position. Therefore, the β2-dependent retinal waves alone cannot account for the remnant N–T mapping information remaining in the ephrin-A2/A3/A5 tko dLGN.
Notably, we find that in both ephrin-A2/A3/A5 tkos and ephrin-A2/A5,β2 tkos, the retinocollicular maps are more disrupted than the retinogeniculate maps. This disparity may arise from the difference in dimensionality between the dLGN (3-D) and the SC and retina (2-D). It is unclear how a 2-D area like the retina maps onto such a 3-D structure. One possibility is that the dLGN is comprised of “equivalence zones” that are innervated by all RGC subtypes responsible for monitoring a particular location of the visual field. In some species, RGC subtypes are segregated into sublaminas (Cramer and Sur, 1997), but less is known about subtype-specific mapping in mice. Interestingly, although not segregated in wild-type mice, RGC on and off cells become segregated in β2 mutant mice (Grubb et al., 2003). This suggests that β2-dependent cues prioritize topographic mapping at this point in development, such that they can override subtype clustering when it conflicts with the establishment of topography; however, there are mechanisms that act to group these cell types in the absence of β2-dependent cues. These underlying mechanisms could be responsible for the more normal maps we see in the ephrin-A2/A5,β2 tko dLGN, compared with the SC. A strong candidate that may facilitate this role is the β2-independent retinal waves that occur during the second and third postnatal weeks. Mice with defects in these ACh-independent retinal waves fail to maintain normal segregation of eye-specific layers in the dLGN (Demas et al., 2006); however, the role of these waves in topography has not been addressed. It remains possible that these waves, or perhaps visually driven activity, can provide positional information used to maintain or establish retinotopy in the dLGN.
The development of CNS connectivity uses a combination of activity-independent and -dependent mapping mechanisms. The relative contributions of each may vary between species and even between different brain areas within the same species. Here, we show that both ephrin-As and β2-dependent correlated retinal activity are important for topographic mapping of both the retinocollicular and retinogeniculate projections, although the relative importance differs between these visual areas. The mechanisms by which genetic and environmental cues act to map the mouse visual system are likely to be shared in the development of more complex brain circuitry, like that which governs human behavior. Investigation of the relative influences of ephrins and neural activity in the establishment of topographic maps in the visual system provides insight into how activity can alter circuits within genetically predisposed limits.
Footnotes
This work was supported by National Institutes of Health (NIH) Grant EY014689 (D.A.F.) and NIH Predoctoral Training Grant GM08646 (C.P.). We thank J. Cang, C. Chen, B. Stafford, M. Stryker, and H. Vaidyanathan for discussions and critical reading of this manuscript.
References
- Bansal et al., 2000.Bansal A, Singer JH, Hwang BJ, Xu W, Beaudet A, Feller MB. Mice lacking specific nicotinic acetylcholine receptor subunits exhibit dramatically altered spontaneous activity patterns and reveal a limited role for retinal waves in forming ON and OFF circuits in the inner retina. J Neurosci. 2000;20:7672–7681. doi: 10.1523/JNEUROSCI.20-20-07672.2000. [DOI] [PMC free article] [PubMed] [Google Scholar]
- Bishop et al., 1962.Bishop PO, Kozak W, Levick WR, Vakkur GJ. The determination of the projection of the visual field on to the lateral geniculate nucleus in the cat. J Physiol (Lond) 1962;163:503–539. doi: 10.1113/jphysiol.1962.sp006991. [DOI] [PMC free article] [PubMed] [Google Scholar]
- Brunet et al., 2005.Brunet I, Weinl C, Piper M, Trembleau A, Volovitch M, Harris W, Prochiantz A, Holt C. The transcription factor Engrailed-2 guides retinal axons. Nature. 2005;438:94–98. doi: 10.1038/nature04110. [DOI] [PMC free article] [PubMed] [Google Scholar]
- Cang et al., 2005a.Cang J, Kaneko M, Yamada J, Woods G, Stryker MP, Feldheim DA. Ephrin-As guide the formation of functional maps in the visual cortex. Neuron. 2005a;48:577–589. doi: 10.1016/j.neuron.2005.10.026. [DOI] [PMC free article] [PubMed] [Google Scholar]
- Cang et al., 2005b.Cang J, Renteria RC, Kaneko M, Liu X, Copenhagen DR, Stryker MP. Development of precise maps in visual cortex requires patterned spontaneous activity in the retina. Neuron. 2005b;48:797–809. doi: 10.1016/j.neuron.2005.09.015. [DOI] [PMC free article] [PubMed] [Google Scholar]
- Carvalho et al., 2006.Carvalho RF, Beutler M, Marler KJ, Knoll B, Becker-Barroso E, Heintzmann R, Ng T, Drescher U. Silencing of EphA3 through a cis interaction with ephrinA5. Nat Neurosci. 2006;9:322–330. doi: 10.1038/nn1655. [DOI] [PubMed] [Google Scholar]
- Chandrasekaran et al., 2005.Chandrasekaran AR, Plas DT, Gonzalez E, Crair MC. Evidence for an instructive role of retinal activity in retinotopic map refinement in the superior colliculus of the mouse. J Neurosci. 2005;25:6929–6938. doi: 10.1523/JNEUROSCI.1470-05.2005. [DOI] [PMC free article] [PubMed] [Google Scholar]
- Cramer and Sur, 1997.Cramer KS, Sur M. Blockade of afferent impulse activity disrupts on/off sublamination in the ferret lateral geniculate nucleus. Brain Res Dev Brain Res. 1997;98:287–290. doi: 10.1016/s0165-3806(96)00188-5. [DOI] [PubMed] [Google Scholar]
- Cutforth et al., 2003.Cutforth T, Moring L, Mendelsohn M, Nemes A, Shah NM, Kim MM, Frisen J, Axel R. Axonal ephrin-As and odorant receptors: coordinate determination of the olfactory sensory map. Cell. 2003;114:311–322. doi: 10.1016/s0092-8674(03)00568-3. [DOI] [PubMed] [Google Scholar]
- Davy and Soriano, 2005.Davy A, Soriano P. Ephrin signaling in vivo: look both ways. Dev Dyn. 2005;232:1–10. doi: 10.1002/dvdy.20200. [DOI] [PubMed] [Google Scholar]
- Demas et al., 2006.Demas J, Sagdullaev BT, Green E, Jaubert-Miazza L, McCall MA, Gregg RG, Wong RO, Guido W. Failure to maintain eye-specific segregation in nob, a mutant with abnormally patterned retinal activity. Neuron. 2006;50:247–259. doi: 10.1016/j.neuron.2006.03.033. [DOI] [PubMed] [Google Scholar]
- Feldheim et al., 1998.Feldheim DA, Vanderhaeghen P, Hansen MJ, Frisen J, Lu Q, Barbacid M, Flanagan JG. Topographic guidance labels in a sensory projection to the forebrain. Neuron. 1998;21:1303–1313. doi: 10.1016/s0896-6273(00)80650-9. [DOI] [PubMed] [Google Scholar]
- Feldheim et al., 2000.Feldheim DA, Kim YI, Bergemann AD, Frisen J, Barbacid M, Flanagan JG. Genetic analysis of ephrin-A2 and ephrin-A5 shows their requirement in multiple aspects of retinocollicular mapping. Neuron. 2000;25:563–574. doi: 10.1016/s0896-6273(00)81060-0. [DOI] [PubMed] [Google Scholar]
- Feldheim et al., 2004.Feldheim DA, Nakamoto M, Osterfield M, Gale NW, DeChiara TM, Rohatgi R, Yancopoulos GD, Flanagan JG. Loss-of-function analysis of EphA receptors in retinotectal mapping. J Neurosci. 2004;24:2542–2550. doi: 10.1523/JNEUROSCI.0239-03.2004. [DOI] [PMC free article] [PubMed] [Google Scholar]
- Flanagan, 2006.Flanagan JG. Neural map specification by gradients. Curr Opin Neurobiol. 2006;16:59–66. doi: 10.1016/j.conb.2006.01.010. [DOI] [PubMed] [Google Scholar]
- Frisén et al., 1998.Frisén J, Yates PA, McLaughlin T, Friedman GC, O'Leary DDM, Barbacid M. Ephrin-A5 (AL-1/RAGS) is essential for proper retinal axon guidance and topographic mapping in the mammalian visual system. Neuron. 1998;20:235–243. doi: 10.1016/s0896-6273(00)80452-3. [DOI] [PubMed] [Google Scholar]
- Garraghty, 1995.Garraghty PE. Connectional specificity in the cat's retinogeniculate system. Int J Neurosci. 1995;80:31–40. doi: 10.3109/00207459508986092. [DOI] [PubMed] [Google Scholar]
- Grubb et al., 2003.Grubb MS, Rossi FM, Changeux JP, Thompson ID. Abnormal functional organization in the dorsal lateral geniculate nucleus of mice lacking the beta 2 subunit of the nicotinic acetylcholine receptor. Neuron. 2003;40:1161–1172. doi: 10.1016/s0896-6273(03)00789-x. [DOI] [PubMed] [Google Scholar]
- Hanson and Landmesser, 2004.Hanson MG, Landmesser LT. Normal patterns of spontaneous activity are required for correct motor axon guidance and the expression of specific guidance molecules. Neuron. 2004;43:687–701. doi: 10.1016/j.neuron.2004.08.018. [DOI] [PubMed] [Google Scholar]
- Hindges et al., 2002.Hindges R, McLaughlin T, Genoud N, Henkemeyer M, O'Leary DD. EphB forward signaling controls directional branch extension and arborization required for dorsal-ventral retinotopic mapping. Neuron. 2002;35:475–487. doi: 10.1016/s0896-6273(02)00799-7. [DOI] [PubMed] [Google Scholar]
- Huberman et al., 2002.Huberman AD, Stellwagen D, Chapman B. Decoupling eye-specific segregation from lamination in the lateral geniculate nucleus. J Neurosci. 2002;22:9419–9429. doi: 10.1523/JNEUROSCI.22-21-09419.2002. [DOI] [PMC free article] [PubMed] [Google Scholar]
- Huberman et al., 2005.Huberman AD, Murray KD, Warland DK, Feldheim DA, Chapman B. Ephrin-As mediate targeting of eye-specific projections to the lateral geniculate nucleus. Nat Neurosci. 2005;8:1013–1021. doi: 10.1038/nn1505. [DOI] [PMC free article] [PubMed] [Google Scholar]
- Lemke and Reber, 2005.Lemke G, Reber M. Retinotectal mapping: new insights from molecular genetics. Annu Rev Cell Dev Biol. 2005;21:551–580. doi: 10.1146/annurev.cellbio.20.022403.093702. [DOI] [PubMed] [Google Scholar]
- Lund et al., 1974.Lund RD, Lund JS, Wise RP. The organization of the retinal projection to the dorsal lateral geniculate nucleus in pigmented and albino rats. J Comp Neurol. 1974;158:383–404. doi: 10.1002/cne.901580403. [DOI] [PubMed] [Google Scholar]
- Mann et al., 2002.Mann F, Ray S, Harris W, Holt C. Topographic mapping in dorsoventral axis of the Xenopus retinotectal system depends on signaling through ephrin-B ligands. Neuron. 2002;35:461–473. doi: 10.1016/s0896-6273(02)00786-9. [DOI] [PubMed] [Google Scholar]
- McLaughlin and O'Leary, 2005.McLaughlin T, O'Leary DD. Molecular gradients and development of retinotopic maps. Annu Rev Neurosci. 2005;28:327–355. doi: 10.1146/annurev.neuro.28.061604.135714. [DOI] [PubMed] [Google Scholar]
- McLaughlin et al., 2003.McLaughlin T, Torborg CL, Feller MB, O'Leary DD. Retinotopic map refinement requires spontaneous retinal waves during a brief critical period of development. Neuron. 2003;40:1147–1160. doi: 10.1016/s0896-6273(03)00790-6. [DOI] [PubMed] [Google Scholar]
- Montero et al., 1967.Montero MM, Brugge J, Beitel RE. Relation of the visual field to the lateral geniculate body of the albino rat. J Neurophysiol. 1967;31:221–236. doi: 10.1152/jn.1968.31.2.221. [DOI] [PubMed] [Google Scholar]
- Muir-Robinson et al., 2002.Muir-Robinson G, Hwang BJ, Feller MB. Retinogeniculate axons undergo eye-specific segregation in the absence of eye-specific layers. J Neurosci. 2002;22:5259–5264. doi: 10.1523/JNEUROSCI.22-13-05259.2002. [DOI] [PMC free article] [PubMed] [Google Scholar]
- Penn et al., 1998.Penn AA, Riquelme PA, Feller MB, Shatz CJ. Competition in retinogeniculate patterning driven by spontaneous activity. Science. 1998;279:2108–2112. doi: 10.1126/science.279.5359.2108. [DOI] [PubMed] [Google Scholar]
- Pfeiffenberger et al., 2005.Pfeiffenberger C, Cutforth T, Woods G, Yamada J, Renteria RC, Copenhagen DR, Flanagan JG, Feldheim DA. Ephrin-As and neural activity are required for eye-specific patterning during retinogeniculate mapping. Nat Neurosci. 2005;8:1022–1027. doi: 10.1038/nn1508. [DOI] [PMC free article] [PubMed] [Google Scholar]
- Rashid et al., 2005.Rashid T, Upton AL, Blentic A, Ciossek T, Knoll B, Thompson ID, Drescher U. Opposing gradients of Ephrin-As and EphA7 in the superior colliculus are essential for topographic mapping in the mammalian visual system. Neuron. 2005;47:57–69. doi: 10.1016/j.neuron.2005.05.030. [DOI] [PubMed] [Google Scholar]
- Rossi et al., 2001.Rossi FM, Pizzorusso T, Porciatti V, Marubio LM, Maffei L, Changeux JP. Requirement of the nicotinic acetylcholine receptor beta 2 subunit for the anatomical and functional development of the visual system. Proc Natl Acad Sci USA. 2001;98:6453–6458. doi: 10.1073/pnas.101120998. [DOI] [PMC free article] [PubMed] [Google Scholar]
- Ruthazer and Cline, 2004.Ruthazer ES, Cline HT. Insights into activity-dependent map formation from the retinotectal system: a middle-of-the-brain perspective. J Neurobiol. 2004;59:134–146. doi: 10.1002/neu.10344. [DOI] [PubMed] [Google Scholar]
- Sachs and Schneider, 1984.Sachs GM, Schneider GE. The morphology of optic tract axons arborizing in the superior colliculus of the hamster. J Comp Neurol. 1984;230:155–167. doi: 10.1002/cne.902300202. [DOI] [PubMed] [Google Scholar]
- Schmitt et al., 2006.Schmitt AM, Shi J, Wolf AM, Lu CC, King LA, Zou Y. Wnt-Ryk signalling mediates medial-lateral retinotectal topographic mapping. Nature. 2006;439:31–37. doi: 10.1038/nature04334. [DOI] [PubMed] [Google Scholar]
- Shatz and Stryker, 1988.Shatz CJ, Stryker MP. Prenatal tetrodotoxin infusion blocks segregation of retinogeniculate afferents. Science. 1988;242:87–89. doi: 10.1126/science.3175636. [DOI] [PubMed] [Google Scholar]
- Simon and O'Leary, 1992.Simon DK, O'Leary DD. Development of topographic order in the mammalian retinocollicular projection. J Neurosci. 1992;12:1212–1232. doi: 10.1523/JNEUROSCI.12-04-01212.1992. [DOI] [PMC free article] [PubMed] [Google Scholar]
- Torborg and Feller, 2005.Torborg CL, Feller MB. Spontaneous patterned retinal activity and the refinement of retinal projections. Prog Neurobiol. 2005;76:213–235. doi: 10.1016/j.pneurobio.2005.09.002. [DOI] [PubMed] [Google Scholar]
- Valverde, 1973.Valverde F. The neuropil in superficial layers of the superior colliculus of the mouse. A correlated Golgi and electron microscopic study. Z Anat Entwicklungsgesch. 1973;142:117–147. doi: 10.1007/BF00519719. [DOI] [PubMed] [Google Scholar]
- Walsh et al., 1983.Walsh C, Polley EH, Hickey TL, Guillery RW. Generation of cat retinal ganglion cells in relation to central pathways. Nature. 1983;302:611–614. doi: 10.1038/302611a0. [DOI] [PubMed] [Google Scholar]
- Xu et al., 1999.Xu W, Orr-Urtreger A, Nigro F, Gelber S, Sutcliffe CB, Armstrong D, Patrick JW, Role LW, Beaudet AL, De Biasi M. Multiorgan autonomic dysfunction in mice lacking the β2 and the β4 subunits of neuronal nicotinic acetylcholine receptors. J Neurosci. 1999;19:9298–9305. doi: 10.1523/JNEUROSCI.19-21-09298.1999. [DOI] [PMC free article] [PubMed] [Google Scholar]