

Abstract
The toxicological effects of single-walled carbon nanotubes (SWCNTs) were investigated after intratracheal instillation in male Wistar rats over a 15-day period using metabonomic analysis of 1H (nuclear magnetic resonance) NMR spectra of blood plasma and liver tissue extracts. Concurrent liver histopathology examinations and plasma clinical chemistry analyses were also performed. Significant changes were observed in clinical chemistry features, including alkaline phosphatase, total protein, and total cholesterol, and in liver pathology, suggesting that SWCNTs clearly have hepatotoxicity in the rat. 1H NMR spectra and pattern recognition analyses from nanomaterial-treated rats showed remarkable differences in the excretion of lactate, trimethylamine oxide, bilineurin, phosphocholine, amylaceum, and glycogen. Indications of amino acid metabolism impairment were supported by increased lactate concentrations and decreased alanine concentrations in plasma. The rise in plasma and liver tissue extract concentrations of choline and phosphocholine, together with decreased lipids and lipoproteins, after SWCNTs treatment indicated a disruption of membrane fluidity caused by lipid peroxidation. Energy, amino acid, and fat metabolism appeared to be affected by SWCNTs exposure. Clinical chemistry and metabonomic approaches clearly indicated liver injury, which might have been associated with an indirect mechanism involving nanomaterial-induced oxidative stress.
Keywords: Single-walled carbon nanotubes, Hepatotoxicity, Metabolomics, Nuclear magnetic resonance
Background
Carbon nanotubes are allotropes of carbon with a cylindrical nanostructure and categorized as single-walled (SWCNTs) and multi-walled nanotubes. By virtue of their unique properties, SWCNTs have been demonstrated as promising nanomaterials for a wide range of applications. In particular, increasing attention has been directed to their utilization in biomedicine, such as in biosensors, drug delivery, and biomarkers [1,2]. However, attention has also been directed toward human health effects that exposure to these materials may produce. Thus, nanotoxicology has become an important research topic in nanoscience.
In the past decade, various groups have independently reported toxicological studies on SWCNTs, both in vitro and in vivo. These results have mainly focused on pulmonary toxicity, cytotoxic effects, inflammatory response, and genotoxicity [3-9]. However, the studies on SWCNTs leading to hepatotoxicity in animals have been limited in scope [10,11], and they only assessed the effects of SWCNTs on reactive oxygen species induction and various hepatotoxicity markers (alanine aminotransferase (ALT), aspartate aminotransferase (AST), alkaline phosphatase (ALP), LPO, and liver morphology) in the mouse model.
Recent studies have shown that metabonomic methods are useful in the assessment of toxic mechanisms and prediction of toxicity [12,13]. Nuclear magnetic resonance (NMR) spectroscopy is one of the major techniques used in metabonomic studies as these spectra can contain a wealth of metabolic information. The signals from thousands of individual metabolites can be observed simultaneously and can partially overlap [14]. Processing these complex data can be simplified by multivariate statistical analysis, including data reduction and pattern recognition techniques, such as principal components analysis (PCA) and partial least squares discriminant analysis [15]. Metabolic changes induced by the administration of a xenobiotic can be visualized clearly by NMR spectroscopy and pattern recognition techniques [16,17].
Herein, the hepatotoxicity in rats exposed to SWCNTs by intratracheal instillation was explored using a 1H NMR-based metabonomic approach to examine blood plasma and liver tissue extracts obtained from rats treated with different SWCNTs concentrations. Concurrently, the toxic threshold and identification of potentially useful toxicity biomarkers of SWCNTs-induced hepatotoxicity were also studied by conventional clinical chemistry and histopathological examinations.
Methods
Single-walled carbon nanotubes and suspension preparation
Non-functionalized SWCNTs, produced by CoMoCAT® (Sigma-Aldrich, St. Louis, MO, USA) catalytic CVD process, were purchased from Sigma-Aldrich, Inc. (St. Louis, MO, USA). Their diameter of 0.8 to 1.2 nm and a length of several microns were determined by transmission electron microscopy (TEM, JEM-2010FEF, JEOL, Ltd., Tokyo, Japan) (Figure 1A). Raman spectroscopy had been used to assess purity (Raman spectrometer, RM200, Renishaw, Gloucestershire, UK) (Figure 1B). The carbon content and the proportion of carbon as SWNT were above 90% and 70%, respectively.
Figure 1.
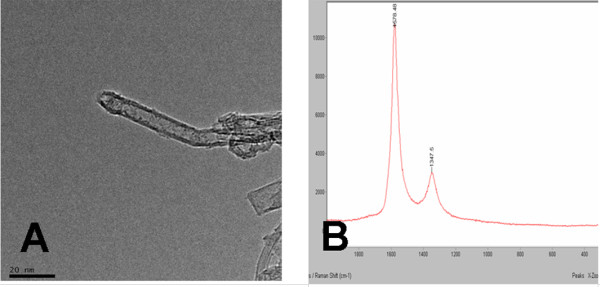
The non-functionalized SWCNTs. (A) TEM of SWCNTs. (B) Raman spectra of SWCNTs.
SWCNTs samples at 150, 300, and 450 mg were dispersed in 20-mL volumes of 0.9% sodium chloride solution, followed by ultrasonication at <50°C for 5 h. The resulting SWCNTs concentrations were 7.5, 15, and 22.5 mg/mL, respectively.
Ethics statement
All experiments involving the care and use of animals were performed in accordance with the guidelines and regulations concerning the ethics of science research in the Institute of Health and Environmental Medicine and approved by the Ethics Review Board of the Institute of Health and Environmental Medicine (approval number JKYSS-2009-018).
Animals and treatment
Thirty healthy male Wistar rats (8 weeks of age, weight 180 to 220 g) were obtained from the Academy of Military Medical Sciences (Beijing, China). All procedures concerning animal usage were reviewed and approved by the Institutional Animal Care and Use Committee of the Academia. All rats were housed individually in metabolic cages and, throughout the study period, allowed food and tap water ad libitum, with light/dark cycles altering every 12 h, environment at 18°C to 22°C, and humidity from 40% to 60%. After 1 week of acclimatization, weight-matched rats were divided randomly into four groups (n = 6 per group) comprising a sodium chloride group (control) and low-, medium-, and high-concentration groups (7.5, 15, and 22.5 mg/kg body weight and named SWCNTs-L, M, and H, respectively). The rats were exposed to SWCNTs by intratracheal instillation of the corresponding SWCNTs suspensions once a day for 15 consecutive days, with the control group treated concurrently with 0.9% sodium chloride solution.
Detection of biochemistry parameters
Blood samples were collected from the rats' eyes 24 h after the final exposure. Samples were allowed to clot at 4°C for 60 min and centrifuged at 3,500 × g at 4°C for 10 min to remove precipitates. Then, plasma biochemistry parameters, including ALT, AST, ALP, albumin (ALB), total protein (TP), and total cholesterol (TC), were analyzed using a Hitachi 7020 automatic analyzer (Hitachi, Tokyo, Japan).
Histopathological evaluation
After the rats were euthanized, the left lateral lobes of each liver were embedded in paraffin and thin sectioned coronally. The sections were then stained with hematoxylin-eosin for examination by light microscopy.
1H NMR spectroscopic measurement of blood plasma
Sample preparation and NMR analyses were conducted as previously described [18,19]. Briefly, 400 μL of plasma was mixed with 200 μL of D2O and 100 μL of a 1-mg/mL solution of trimethylsilyl propanoate in D2O and then transferred to 5-mm NMR tubes. Samples were analyzed by 1H NMR spectroscopy using a Varian INOVA-600 spectrometer (Varian Medical Systems, Inc., Palo Alto, CA, USA). Two types of 1H NMR spectra were acquired for each sample, with water-suppressed Carr-Purcell-Meiboom-Gill (CPMG) spectra acquired using a pulse sequence acting as a T2 relaxation filter to suppress signals from macromolecular motion and other molecules with constrained molecular motions. Water-suppressed diffusion-edited spectra were acquired to remove peaks from low molecular weight components using a bipolar-pair longitudinal decay current (LED) pulse sequence.
1H NMR spectroscopic measurement of aqueous soluble liver extracts and lipid-soluble liver extracts
Liver tissue extracts were prepared based on a procedure reported [20,21]. Here, 250-mg samples of frozen liver tissue were homogenized with 2 mL of 50% acetonitrile in an ice/water bath. After standing in ice for 10 min, the extraction samples were centrifuged at 5,100 rpm and 4°C for 15 min, and the aqueous layer and precipitates were recovered.
The aqueous layer was removed and lyophilized before precipitate removal by resuspension in 600 μL of sodium phosphate buffer in D2O (0.1 M, pH 7.4), containing 60 μL of 0.1% sodium TSP, and centrifugation at 14,000 rpm at 4°C for 8 min. The resulting solutions were transferred to 5-mm NMR tubes, and NMR spectrum was acquired with water signals suppressed by presaturation, as described above. Sixty-four free induction decays (FIDs) were collected into 64K data points over a spectral width of 9,000 Hz with 2-s relaxation delay and acquisition time. The FIDs were weighted using an exponential function with a 0.5-Hz line-broadening factor prior to Fourier transformation.
The precipitates were collected into polypropylene tubes containing 2-mL solution of 75% chloroform and 25% methanol. The extraction was followed by a further centrifugation (5,000 × g for 15 min). The lipophilic supernatants were removed, then dried under a stream of nitrogen. After adding 600 μL of deuterated chloroform, the samples were recentrifuged at 14,000 rpm for 8 min, then the lower phases were transferred to 5-mm NMR tubes, and NMR spectra were acquired.
Data reduction and pattern recognition analysis of 1H NMR spectra
All NMR spectra were phased and baseline corrected, and then, the data were reduced to 225 integrated regions of equal width (0.04 ppm) corresponding to the region from δ9.38 to δ0.22 using the VNMR 6.1C software package (Varian, Inc.). Each data point was normalized to the sum of its row (i.e., to the total integral for each NMR spectrum) to compensate for variations, and the values of all variable means were centered and Pareto scaled before PCA was applied using the SIMCA-P software package (v10, Umetrics AB, Umea, Sweden). Pareto scaling provided each variable a variance numerically equal to its standard deviation. Score plots of the first two principal components (PCs) were used to visualize group separations, and the PC loading values reflected the NMR spectra regions that were altered as a result of nanotube exposure [14,17].
Statistical analyses
Data were presented as mean ± standard deviations. Statistical analyses were performed using SPSS software, version 13.0 (SPSS Inc., Chicago, IL, USA). A one-way analysis of variance and Bartlett's test were calculated for each sampling value. A p value less than 0.05 was regarded as statistically significant.
Results
Effects of SWCNTs on biochemical indicators of rat liver function
After intratracheal instillation for 15 days, rat plasma AST, ALB, ALT, ALP, TP, and TC values were measured as indicators of liver function. Compared with the control group, the ALP, TP, and TC concentrations in the SWCNTs-H group decreased significantly (p < 0.05). Also, the ALB and TP concentrations in the SWCNTs-H group decreased compared with the SWCNTs-L group (p < 0.05, Table 1).
Table 1.
Effects of SWCNTs on biochemical indicators of rat liver function
| Group | AST (g/L) | ALB (g/L) | ALT (g/L) | ALP (g/L) | TP (g/L) | TC (μmol/L) |
|---|---|---|---|---|---|---|
| Control |
156.9 ± 39.0 |
49.8 ± 14.9 |
49.0 ± 9.4 |
427.2 ± 57.9 |
82.2 ± 5.4 |
1.95 ± 0.34 |
| SWCNTs-L |
125.1 ± 16.7a |
42.0 ± 1.3 |
50.8 ± 5.4 |
374.5 ± 81.5 |
78.3 ± 2.6 |
1.68 ± 0.15 |
| SWCNTs-M |
127.6 ± 12.5 |
39.9 ± 1.4 |
53.7 ± 9.1 |
345.5 ± 90.1 |
75.9 ± 1.4a |
1.83 ± 0.14 |
| SWCNTs-H | 129.9 ± 18.9 | 39.2 ± 1.5b | 51.2 ± 9.6 | 317.8 ± 41.2a | 71.8 ± 4.4a,b | 1.59 ± 0.18a |
AST, aspartate aminotransferase; ALB, albumin; ALT, alanine aminotransferase; ALP, alkaline phosphatase; TP, total protein; TC, total cholesterol. aCompared with the control group, p < 0.05. bCompared with the SWCNTs-L group, p < 0.05.
Histopathological evaluation
The histological changes of the livers in the control group after treatment revealed no observable damage (Figure 2A). In contrast, the livers of the experimental groups (Figure 2B,C,D) produced mild to moderate cellular swelling in the liver centrilobular portion, focal necrosis, and inflammatory cell infiltration, especially in the SWCNTs-M and SWCNTs-H groups (Figure 2C,D), indicating that SWCNTs caused liver damage under these conditions.
Figure 2.
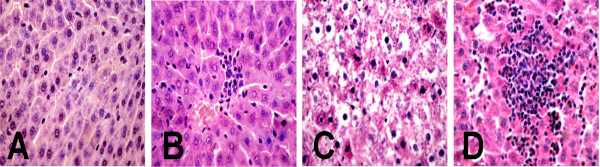
Light micrographs of liver tissue of rats exposed to SWCNTs. (A) Control group liver and (B, C, D) SWCNTs-L, SWCNTs-M, and SWCNTs-H group livers, respectively. Magnification, ×200.
1H NMR spectroscopic and pattern recognition analysis of rat plasma
1H NMR spectra of plasma included spin-echo and diffusion-edited NMR spectra, which reflected the lower molecular weight and macromolecular weight metabolites, respectively, present in the plasma. In the analysis of the 1H NMR spectra, the intensities of some endogenous metabolite signals changed as a consequence of SWCNTs administration (Figures 3 and 4). These changes were evident as relative increases in lactic acid and choline concentrations and decreases in the concentrations of alanine, blood sugar, blood fat, and low-density lipoprotein (LDL), compared to control values.
Figure 3.

1H NMR spectra of plasma samples (CPMG) after exposed to SWCNTs in rats. (A) Control group and (B, C, D) SWCNTs-L, SWCNTs-M, and SWCNTs-H groups, respectively.
Figure 4.

1H NMR spectra of plasma samples (LED) after exposed to SWCNTs in rats. (A) Control group and (B, C, D) SWCNTs-L, SWCNTs-M, and SWCNTs-H groups, respectively.
In score plot of PCA, each data point represents one rat sample, and the distance between points in the score plot is an indication of the similarity between samples. In loading plot for the corresponding score plot, each data point represents one bucket (with the chemical shift indicated explicitly). The plot identifies which spectral regions (and thus which chemical compounds) are responsible for the differences between the spectra observed in the score plot. The PCA score plot derived from the 1H NMR plasma spectra of low molecular weight metabolites showed that control and dosed groups were well separated on the plot (Figure 5A). The loading plot showed that lactate (δ1.31-1.33, 4.10-4.12), glucose (δ3.46), glutamine (δ2.42-2.44), lipoprotein (δ0.9, 1.7), alanine (δ1.48), and creatine (δ3.03) were among the components that contributed markedly to the separation of the groups (Figure 5B).
Figure 5.
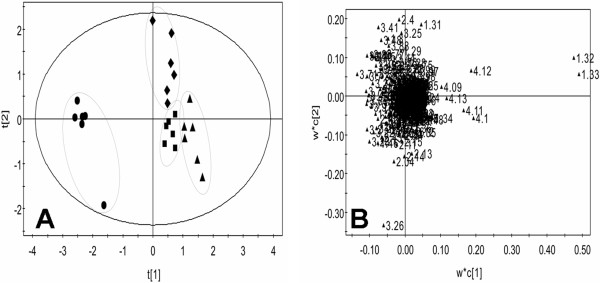
CPMG score plot (A) and loading plot (B) for the endogenous metabolite profiles in plasma samples after exposed to SWCNTs in rats. Control (diamond), SWCNTs-L (square), SWCNTs-M (triangle), and SWCNTs-H (circle) groups. In the score plot, each data point represents one rat sample, and the distance between points in the score plot is an indication of the similarity between samples. In the loading plot, each data point represents one bucket. The plot identifies which spectral regions are responsible for the differences between the spectra observed in the score plot.
The PCA score plot (Figure 6A) from the 1H NMR plasma spectra of macromolecular weight metabolites showed that the SWCNTs-L and SWCNTs-M groups were separated from the control group, but the observed overlapping in the score plot of the SWCNTs-H and control groups indicated that their differences were not obvious. As Figure 6B shows, most points were located around the origin point, and only a few points were away from the origin. The significant differences between each group were caused by the compound represented by these scattered points. Inspection of the loading SWCNTs suggested that the metabolic effects following SWCNTs treatments were characterized by significant changes in very low density lipoprotein (VLDL) and LDL, (δ0.82, δ0.86, δ1.26) and phosphatidylcholine (δ3.22) as well as several unknown materials (δ1.22, δ1.3), which require further study (Figure 6B). The SWCNTs-induced variations in plasma endogenous metabolites are summarized in Table 2.
Figure 6.
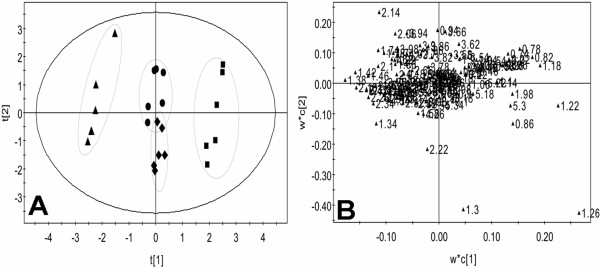
LED score plot (A) and loading plot (B) for the endogenous metabolite profiles in plasma samples after exposed to SWCNTs in rats. Control group (diamond), SWCNTs-L (square), SWCNTs-M (triangle), and SWCNTs-H (circle) groups.
Table 2.
Summary of rat plasma metabolite variations induced by SWCNTs administration
| Chemical shift (δ, ppm) | Metabolites | SWCNTs-L group | SWCNTs-M group | SWCNTs-H group |
|---|---|---|---|---|
| 0.80-0.90, 1.20-1.29 |
Lipoprotein |
↓ |
↓ |
↑ |
| 0.94 |
Ile + Leu |
↑ |
↑ |
↑ |
| 1.31-1.33, 4.10-4.12 |
Lactate |
↑ |
↑ |
↑ |
| 1.48 |
Alanine |
↓ |
↓ |
↓ |
| 1.91 |
Acetate |
↓ |
↓ |
↑ |
| 2.03-2.04 |
NAc |
↑ |
↑ |
↑ |
| 2.13-2.14 |
OAc |
↑ |
↑ |
↑ |
| 2.42-2.44 |
Gln-glutamine |
↑ |
↑ |
↑ |
| 3.03 |
Creatine |
↓ |
↓ |
↑ |
| 3.20 |
Cho |
↑ |
↑ |
↑ |
| 3.22, 3.23 |
PCho |
↑ |
↑ |
↑ |
| 3.40-4.00 |
Glucose |
↓ |
↓ |
↓ |
| 0.70 |
HDL |
↑ |
↓ |
↑ |
| 0.82, 0.86 |
VLDL/LDL |
↓ |
↓ |
↓ |
| 1.10 |
HDL |
↑ |
↓ |
↑ |
| 1.26 |
VLDL/LDL |
↓ |
↓ |
↓ |
| 1.58 |
Lipid CH2CH2CO |
↓ |
↑ |
↓ |
| 2.02 |
NAc |
↑ |
↓ |
↑ |
| 2.14 |
OAc |
↓ |
↑ |
↑ |
| 2.26 |
Lipid CH2CO |
↓ |
↑ |
↓ |
| 3.22 |
PtdCho |
↓ |
↑ |
↓ |
| 5.30 | UFA | ↑ | ↓ | ↑ |
Ile, isoleucine; Leu, leucine; NAc, n-acetylgalactosamine; OAc, O-acetyl glucoprotein; Cho, choline; PCho, phosphatidylcholine; HDL, high-density lipoprotein; VLDL, very low density lipoprotein; LDL, low-density lipoprotein; PtdCho, phosphatidylcholine; UFA, unesterified fatty acids. Down arrow indicates decrease, and up arrow indicates increase, compared to control.
1H NMR spectroscopic and pattern recognition analysis of aqueous soluble liver extract
Typical 1H NMR spectra of aqueous soluble liver extract following administration of SWCNTs are shown in Figure 7. Examination of the score plot (Figure 8A) from 1H NMR spectra of samples from the control and dosed groups indicated that the control group was separated from the three treated groups, but the three treated groups overlapped with each other. It revealed that SWCNTs could cause cell oxidative damage, but the dose-related hepatotoxicity was not obvious.
Figure 7.

1H NMR spectra of rat aqueous soluble liver tissue extracts after exposed to SWCNTs in rats. (A) Control group and (B, C, D) SWCNTs-L, SWCNTs-M, and SWCNTs-H groups, respectively.
Figure 8.
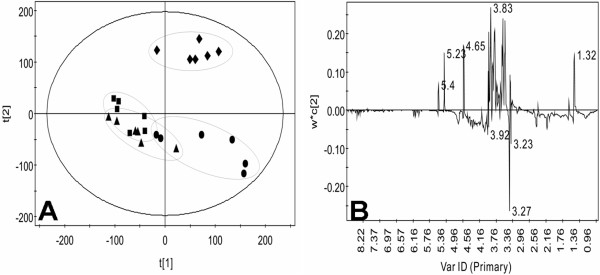
Score (A) and loading (B) plots for the endogenous metabolite profiles in aqueous soluble liver extracts after exposed to SWCNTs in rats. Control (diamond), SWCNTs-L (square), SWCNTs-M (triangle), and SWCNTs-H (circle) groups.
Examination of the PCA loading plot (Figure 8B) in combination with the subsequent inspection of the corresponding 1H NMR spectra showed that lactate (δ1.32-1.34, 4.09-4.12), alanine (δ1.47-1.49), trimethylamine oxide (δ3.27), choline, phosphocholine (3.22, 3.23), β-amylaceum (δ4.65), α-amylaceum (δ5.32), and glycogen (δ5.40, 5.41), as well as several unknown materials (δ3.83, δ3.92), which require further study, were among the components that contributed markedly to the separation of the groups. The dominant metabolites in aqueous soluble liver extracts that influenced the differentiation between the control and treatment samples are summarized in Table 3.
Table 3.
Summary of metabolite variations induced by SWCNTs in rat aqueous soluble liver tissue extract
| Chemical shift (δ, ppm) | Metabolites | SWCNTs-L group | SWCNTs-M group | SWCNTs-H group |
|---|---|---|---|---|
| 1.32-1.34, 4.09-4.12 |
Lactate |
↓ |
↓ |
↓ |
| 1.47-1.49 |
Alanine |
↓ |
↓ |
↓ |
| 2.04-2.06, 2.13, 2.14, 2.36 |
Glutamate |
↑ |
↑ |
↑ |
| 3.22, 3.23 |
Cho/PCho |
↑ |
↑ |
↑ |
| 3.27 |
TMAO |
↑ |
↑ |
↑ |
| 3-4 |
glyc- |
↓ |
↓ |
↓ |
| 4.65 |
β-glucose |
↓ |
↓ |
↓ |
| 5.23 |
α-glucose |
↓ |
↓ |
↓ |
| 5.40, 5.41 | Glycogen | ↓ | ↓ | ↓ |
Cho, choline; PCho, phosphatidylcholine; TMAO, trimethylamine oxide. Down arrow indicates decrease, and up arrow indicates increase, compared to control.
1H NMR spectroscopic and pattern recognition analysis of lipid-soluble liver extracts
Typical 1H NMR spectra of lipid-soluble liver extracts following administration of SWCNTs are shown in Figure 9. Comparison of the 1H NMR spectra of samples from the control and dosed groups indicated that the medium and high groups overlapped on the score plot (Figure 10A), but the differences between the control and low groups were obvious.
Figure 9.

1H NMR spectra of rat lipid-soluble liver extracts after exposed to SWCNTs in rats. (A) Control group and (B, C, D) SWCNTs-L, SWCNTs-M, and SWCNTs-H groups, respectively.
Figure 10.
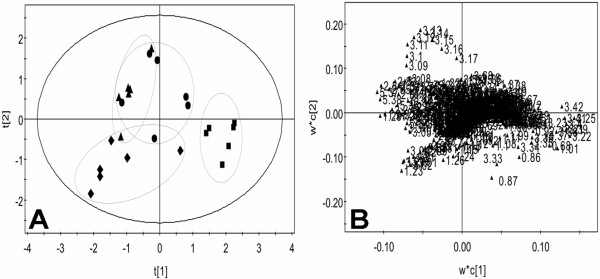
Score (A) and loading (B) plots for the endogenous metabolite profiles in lipid-soluble liver extracts after exposed to SWCNTs in rats. Control (diamond), SWCNTs-L (square), SWCNTs-M (triangle), and SWCNTs-H (circle) groups.
Examination of the PCA loading plot (Figure 10B) in combination with the subsequent inspection of the corresponding 1H NMR spectra showed that polyunsaturated fatty acid (δ0.89, 2.00, 2.76), lipids (δ1.26, 1.58), and cholesterol (δ1.05-1.18, 1.51) were among the components that contributed markedly to the separation of the groups (Figure 9). The dominant metabolites influencing the differentiation between control and treatment samples are summarized in Table 4.
Table 4.
Summary of metabolite variations induced by SWCNTs in lipid-soluble rat liver tissue extract
| Chemical shift (δ, ppm) | Metabolites | SWCNTs-L group | SWCNTs-M group | SWCNTs-H group |
|---|---|---|---|---|
| 0.66 |
Total cholesterol |
↑ |
↓ |
↓ |
| 0.89 |
Total cholesterol + PUFA (CH3) |
↓ |
↑ |
↓ |
| 1.05-1.18 |
Cholesterol |
↑ |
↓ |
↓ |
| 1.26 |
Lipids (-CH2-CH2-CH2-) |
↓ |
↓ |
↓ |
| 1.51 |
Cholesterol |
↑ |
↑ |
↑ |
| 1.58 |
Lipids (CH2CH2CO) |
↓/- |
↑/- |
↓/- |
| 1.82 |
Cholesterol |
↑ |
↑ |
↑ |
| 2.00 |
PUFA (CH=CH-CH2-CH=CH) FA (CH=CH-CH2-CH=CH) |
↓ |
↓/- |
↓ |
| 2.76 |
PUFA (=CH-CH2-CH-) |
↓ |
↑ |
↓ |
| 3.30 |
Phosphatidylcholine (Me3N+-) |
↓ |
↓ |
↑ |
| 4.27 | Glycerol in PC/PE/TG | ↑ | - | ↑ |
PUFA, polyunsaturated fatty acid; FA, fatty acid. Down arrow indicates decrease; up arrow indicates increase; and a hyphen means no change, compared to control.
Discussion
Recent studies have shown that metabonomic approach can be used as a rapid analytical tool for the study on effects of hepatotoxic compounds [22-24]. In this study, NMR-based metabonomic methods coupled with traditional clinical chemistry and histopathology methods were used to demonstrate SWCNTs exposure-induced hepatotoxicity in rats. The complex disturbances in the endogenous metabolite profiles of rat biofluids combined with remarkable histopathological evidence and the change of the plasma enzyme concentrations could be related to nanoparticle-induced hepatotoxicity.
SWCNTs were found here to show effects on the chemistry and histopathology of rat blood and liver. Obviously, changes were observed in clinical chemistry features, including ALP, TP, and TC, and in liver pathology (Table 1 and Figure 2, respectively), suggesting that SWCNTs clearly have hepatotoxic abilities in rats. The release of cellular hepatospecific enzymes, such as ALP, might have resulted from nanoparticle-induced damage of cell membrane integrity, and the observed reduced TP suggested perturbation of protein biosynthesis and catabolism. From these observations, SWCNTs appeared to produce hepatotoxicity via discrete pathophysiologic necrosis and inflammation. The obtained PCA data were in good agreement with the histopathology and clinical chemistry data, with the metabonomic analytical results being more sensitive than clinical chemistry analyses.
The PCA of 1H NMR data showed that, in rat plasma and liver tissue, SWCNTs exposure altered the concentrations of glutamate, creatine, lactate, TMAO, cho, HDL, VLDL, and glucose and that these altered metabolites might be considered possible biomarkers for such hepatotoxicity. SWCNTs exposure appeared to induce energy metabolism disturbances, with choline and phosphocholine being breakdown products of phosphatidylcholine, the major membrane constituent. After SWCNTs treatment, the observed rise in plasma choline and phosphocholine concentrations, together with a drop in plasma lipids and lipoproteins, denoted a disruption of membrane fluidity caused by lipid peroxidation [25].
The increased glutamine concentration in aqueous soluble extracts of liver tissues resulted from the cytosolic accumulation of glutamine, which was due to defective GSH transport from the cytosol into the mitochondria, as a result of decreased membrane fluidity due to the decreased content of unsaturated fatty acids in cellular membranes [14,26]. The glucose concentrations in plasma spectra and those of glucose and glycogen in aqueous soluble liver extract were decreased significantly in rats after SWCNTs treatment, which suggested that the rates of glycogenolysis and glycolysis increased because of inhibited lipid metabolism in these animals.
SWCNTs exposure appeared to induce perturbations in amino acid metabolism. Alanine and glucose concentrations are associated with the glucose-alanine cycle [14]. The change of alanine and glucose concentrations in plasma and aqueous liver tissue extracts from SWCNTs-treated rats implied nanoparticle-induced perturbations of the glucose-alanine cycle.
Conclusions
The present investigation demonstrated that exposure to SWCNTs induced significant hepatotoxicity in rats. The results suggested that SWCNTs inhibited mitochondrial function by altering energy and lipid metabolism, which resulted in free fatty acid and lactate accumulation. The NMR-based metabonomic approach applied here represents a promising and sensitive technique for examining SWCNTs toxicity in an animal model. Further studies are necessary to verify these metabolites as useful biomarkers for SWCNTs hepatotoxicity assessment.
Competing interests
The authors declare that they have no competing interests.
Authors' contributions
BCL and HSZ participated in the design of the study, carried out the experiments, and drafted the manuscript. ZQL and YJF modified the draft of the manuscript. LT, HLY, and HLL performed the statistical analysis. JY and WZ checked the manuscript grammar. ZGX designed the study and guided this work. All authors read and approved the final manuscript.
Contributor Information
Bencheng Lin, Email: linbencheng123@126.com.
Huashan Zhang, Email: Zhanghuashan123@126.com.
Zhiqing Lin, Email: wolinzq@sina.com.
Yanjun Fang, Email: Fangyanjun888@163.com.
Lei Tian, Email: tjtianlei@126.com.
Honglian Yang, Email: Yanghonglian123@126.com.
Jun Yan, Email: Yanjun62034@163.com.
Huanliang Liu, Email: Liuhuanliang123@126.com.
Wei Zhang, Email: Zhangwei62034@163.com.
Zhuge Xi, Email: zhugexi2003@sina.cn.
Acknowledgments
This work was supported by The National Natural Science Foundation of China (no. 20907075) and The National “973” plan of China (no. 2010CB933904).
References
- Muller J, Huaux F, Moreau N, Misson P, Heilier JF, Delos M, Arras M, Fonseca A, Nagy JB, Lison D. Respiratory toxicity of multi-wall carbon nanotubes. Toxicol Appl Pharmacol. 2005;8:221–231. doi: 10.1016/j.taap.2005.01.008. [DOI] [PubMed] [Google Scholar]
- Rosen Y, Elman NM. Carbon nanotubes in drug delivery: focus on infectious diseases. Expert Opin Drug Deliv. 2009;8:517–530. doi: 10.1517/17425240902865579. [DOI] [PubMed] [Google Scholar]
- Hvedova AA, Kisin ER, Porter D, Schulte P, Kagan VE, Fadeel B, Castranova V. Mechanisms of pulmonary toxicity and medical applications of carbon nanotubes: two faces of Janus? Pharmacol Ther. 2009;8:192–204. doi: 10.1016/j.pharmthera.2008.10.009. [DOI] [PubMed] [Google Scholar]
- Murray A, Kisin E, Leonard SS, Young SH, Kommineni C, Kagan VE, Castranova V, Shvedova AA. Oxidative stress and inflammatory response in dermal toxicity of single-walled carbon nanotubes. Toxicology. 2009;8:161–171. doi: 10.1016/j.tox.2008.12.023. [DOI] [PubMed] [Google Scholar]
- Yang Z, Zhang Y, Yang Y, Sun L, Han D, Li H, Wang C. Pharmacological and toxicological target organelles and safe use of single-walled carbon nanotubes as drug carriers in treating Alzheimer disease. Nanomedicine. 2010;8:427–441. doi: 10.1016/j.nano.2009.11.007. [DOI] [PubMed] [Google Scholar]
- Naya M, Kobayashi N, Mizuno K, Matsumoto K, Ema M, Nakanishi J. Evaluation of the genotoxic potential of single-wall carbon nanotubes by using a battery of in vitro and in vivo genotoxicity assays. Regul Toxicol Pharmacol. 2011;8:192–198. doi: 10.1016/j.yrtph.2011.07.008. [DOI] [PubMed] [Google Scholar]
- Gutiérrez-Praena D, Pichardo S, Sánchez E, Grilo A, Cameán AM, Jos A. Influence of carboxylic acid functionalization on the cytotoxic effects induced by single wall carbon nanotubes on human endothelial cell (HUVEC) Toxicology in Vitro. 2011;8:1883–1888. doi: 10.1016/j.tiv.2011.05.027. [DOI] [PubMed] [Google Scholar]
- Park EJ, Roh J, Kim SN, Kang MS, Lee BS, Kim Y, Choi S. Biological toxicity and inflammatory response of semi-single-walled carbon nanotubes. PLoS One. 2011;8:e25892. doi: 10.1371/journal.pone.0025892. http://dx.doi.org/10.1371/journal.pone.0025892. [DOI] [PMC free article] [PubMed] [Google Scholar]
- Ema M, Imamura T, Suzuki H, Kobayashi N, Naya M, Nakanishi J. Genotoxicity evaluation for single-walled carbon nanotubes in a battery of in vitro and in vivo assays. J Appl Toxicol. 2012. http://dx.doi.org/10.1002/jat.2772. [DOI] [PubMed]
- Patlolla A, McGinnis B, Tchounwou P. Biochemical and histopathological evaluation of functionalized single-walled carbon nanotubes in Swiss-Webster mice. J Appl Toxicol. 2011;8:75–83. doi: 10.1002/jat.1579. [DOI] [PMC free article] [PubMed] [Google Scholar]
- Lin BC, Xi ZG, Zhang YG, Zhang HS. Primary study on the hepatotoxicity and nephrotoxicity of rats induced by three kinds of nanomaterials. Wei Sheng Yan Jiu. 2008;8:651–653. [PubMed] [Google Scholar]
- Jordan KW, Cheng LL. NMR-based metabolomics approach to target biomarkers for human prostate cancer. Expert Rev Proteomics. 2007;8:389–400. doi: 10.1586/14789450.4.3.389. [DOI] [PubMed] [Google Scholar]
- Bain JR, Stevens RD, Wenner BR, Ilkayeva O, Muoio DM, Newgard CB. Metabolomics applied to diabetes research: moving from information to knowledge. Diabetes. 2009;8:2429–2443. doi: 10.2337/db09-0580. [DOI] [PMC free article] [PubMed] [Google Scholar]
- Lu CF, Wang YM, Sheng ZG, Liu G, Fu Z, Zhao J, Zhao J, Yan X, Zhu B, Peng S. NMR-based metabonomic analysis of the hepatotoxicity induced by combined exposure to PCBs and TCDD in rats. Toxicol Appl Pharmacol. 2010;8:178–184. doi: 10.1016/j.taap.2010.07.020. [DOI] [PubMed] [Google Scholar]
- Tiziani S, Lopes V, Gunther UL. Early stage diagnosis of oral cancer using 1H NMR-based metabolomics. Neoplasia. 2009;8:269–276. doi: 10.1593/neo.81396. [DOI] [PMC free article] [PubMed] [Google Scholar]
- Holmes E, Nicholls AW, Lindon JC, Connor SC, Connelly JC, Haselden JN, Damment SJ, Spraul M, Neidig P, Nicholson JK. Chemometric models for toxicity classification based on NMR spectra of biofluids. Chem Res Toxicol. 2000;8:471–478. doi: 10.1021/tx990210t. [DOI] [PubMed] [Google Scholar]
- An DZ, Zhang Q, Wu SM, Wei JY, Yang JJ, Dong FL, Yan XZ, Guo CJ. Changes of metabolic profiles in urine after oral administration of quercetin in rats. Food Chem Toxicol. 2010;8:1521–1527. doi: 10.1016/j.fct.2010.03.019. [DOI] [PubMed] [Google Scholar]
- Waters NJ, Waterfield CJ, Farrant RD, Holmes E, Nicholson JK. Metabonomic deconvolution of embedded toxicity: application to thioacetamide hepato and nephrotoxicity. Chem Res Toxicol. 2005;8:639–654. doi: 10.1021/tx049869b. [DOI] [PubMed] [Google Scholar]
- Lei RH, Wu CQ, Yang BH, Ma HZ, Shi C, Wang QX, Wang Q, Yuan Y, Liao MY. Integrated metabolomic analysis of the nano-sized copper particle-induced hepatotoxicity and nephrotoxicity in rats: a rapid in vivo screening method for nanotoxicity. Toxicol Appl Pharmacol. 2008;8:292–301. doi: 10.1016/j.taap.2008.06.026. [DOI] [PubMed] [Google Scholar]
- Wang QJ, Jiang Y, Wu CQ, Zhao JY, Yu SZ, Yuan B, Yan XZ, Liao MY. Study of a novel indolin-2-ketone compound Z24 induced hepatotoxicity by NMR-spectroscopy-based metabonomics of rat urine, blood plasma, and liver extracts. Toxicol Appl Pharmacol. 2006;8:71–82. doi: 10.1016/j.taap.2006.02.012. [DOI] [PubMed] [Google Scholar]
- Coen M, Ruepp SU, Lindon JC, Nicholson JK, Pognan F, Lenz EM, Wilson ID. Integrated application of transcriptomics and metabonomics yields new insight into the toxicity due to paracetamol in the mouse. J Pharm Biomed Anal. 2004;8:93–105. doi: 10.1016/j.jpba.2003.12.019. [DOI] [PubMed] [Google Scholar]
- Kleno TG, Kiehr B, Baunsgaard D, Sidelmann UG. Combination of ‘omics’ data to investigate the mechanism(s) of hydrazine-induced hepatotoxicity in rats and to identify potential biomarkers. Biomarkers. 2004;8:116–138. doi: 10.1080/13547500410001728408. [DOI] [PubMed] [Google Scholar]
- Azmi J, Griffin JL, Shore RF, Holmes E, Nicholson JK. Chemometric analysis of biofluids following toxicant induced hepatotoxicity: a metabonomic approach to distinguish the effects of 1-naphthylisothiocyanate from its products. Xenobiotica. 2005;8:839–852. doi: 10.1080/00498250500297940. [DOI] [PubMed] [Google Scholar]
- Bollard ME, Stanley EG, Lindon JC, Nicholson JK, Holmes E. NMR-based metabonomic approaches for evaluating physiological influences on biofluid composition. NMR Biomed. 2005;8:143–162. doi: 10.1002/nbm.935. [DOI] [PubMed] [Google Scholar]
- Wei L, Liao PQ, Wu HF, Li XJ, Pei FK, Li WS, Wu YJ. Metabolic profiling studies on the toxicological effects of realgar in rats by 1H NMR spectroscopy. Toxicol Appl Pharmacol. 2009;8:314–325. doi: 10.1016/j.taap.2008.11.010. [DOI] [PubMed] [Google Scholar]
- Connor SC, Wu W, Sweatman BC, Manini J, Haselden JN, Crowther DJ, Waterfield CJ. Effects of feeding and body weight loss on the 1H-NMR-based urine metabolic profiles of male Wistar Han rats: implications for biomarker discovery. Biomarkers. 2004;8:156–179. doi: 10.1080/13547500410001720767. [DOI] [PubMed] [Google Scholar]