

Abstract
Alzheimer’s disease (AD) is a multifactorial disorder of unknown etiology. Mechanistically, beta amyloid peptides (Aβ) and elevated Ca2+ have been implicated as proximal and likely interactive features of the disease process. We tested the hypothesis that proximity to Aβ plaque might exacerbate activity-dependent neuronal Ca2+ signaling in hippocampal pyramidal neurons from APPSWE/PS1M146V mice. Using combined approaches of whole cell patch clamp recording and 2-photon imaging of neuronal Ca2+ signals with thioflavin-S plaque labeling in hippocampal slices, we found no correlation between thioflavin-S labeled Aβ plaque proximity and Ca2+ responses triggered by ryanodine receptor (RyR) activation or action potentials in either dendrites or somata of AD mice, regardless of age. Baseline and RyR-stimulated spontaneous excitatory postsynaptic potentials also showed little difference in relation to Aβ plaque proximity. Consistent with previous studies, RyR-evoked Ca2+ release in APPSWE/PS1M146V mice was greater than in nontransgenic controls. Within the soma, RyR-evoked Ca2+ release was elevated in older APPSWE/PS1M146V mice compared with younger APPSWE/PS1M146V mice, but was still independent of plaque proximity. The results indicate that early Ca2+ signaling disruptions can become yet more severe with age through mechanisms independent of Aβ plaques, suggesting that alternative pathogenic mechanisms might contribute to AD-associated dysfunction.
Keywords: Alzheimer’s disease, Calcium signaling, Beta-amyloid protein, Hippocampus, Transgenic mice, Patch clamp, 2-photon imaging
1. Introduction
Alzheimer’s disease (AD), an age-related neurodegenerative disorder progressing from cognitive dysfunction to death, is associated with multiple risk factors and potential mechanisms (Querfurth and LaFerla, 2010). Considerable research has focused on the neurotoxicity of beta amyloid peptides (Aβ) since they were identified in plaques from AD patients decades ago (Goate and Hardy, 2012; Holtzman et al., 2011; Selkoe, 1993), yet therapeutic studies targeting Aβ have yielded disappointing or counterproductive results (Aisen et al., 2011; Galimberti and Scarpini, 2011; Karran et al., 2011; Selkoe, 2011b; Stone et al., 2011). Among other things, impediments to progress in this arena might reflect uncertainty regarding the relevant Aβ species to target (Benilova et al., 2012), the use of inconsistent model systems or supraphysiologic Aβ peptide concentrations (Castellani and Smith, 2011; Waters, 2010), incomplete understanding of physiologic versus pathologic roles of Aβ and amyloid precursor protein (APP) (Chasseigneaux and Allinquant, 2012; Guo et al., 2012; Zhang et al., 2012), and incomplete consideration of alternative pathogenic mechanisms, particularly those affecting synapses (Chakroborty and Stutzmann, 2011).
Because the mechanisms driving AD pathology appear disparate, effective therapeutic strategies might derive from a confluence of targets that are synergistic with, or alternative to, monopathic Aβ-centric therapies. Ca2+ dysregulation is one feature to consider in that it emerges during the aging process (Disterhoft and Oh, 2007; Foster, 2007; Thibault et al., 2007), accelerates Aβ pathology (Demuro et al., 2010; Itkin et al., 2011), and is integral to multiple feed-forward pathologic cascades in AD (Berridge, 2010; Bezprozvanny, 2009; Camandola and Mattson, 2011; Gibson et al., 2010; Hermes et al., 2010; Stutzmann, 2007). Indeed, presenilin mutations associated with familial AD (FAD) cause profound Ca2+ signaling exaggerations as one of the earliest, if not the earliest, pathogenic event (Muller et al., 2011a; Stutzmann and Mattson, 2011; Stutzmann et al., 2006; Supnet and Bezprozvanny, 2011) followed by accelerated Aβ deposition when combined with mutant APP (Auffret et al., 2010; Lazarov et al., 2006). In vivo studies in mutant APP and presenilin-1 (PS1) transgenic mouse models have suggested associations between Aβ plaque proximity and abnormal cellular Ca2+ in cortex. These include Ca2+ influx with synaptic hyperactivity (Busche et al., 2008, 2012), triggering of astrocytic Ca2+ waves (Kuchibhotla et al., 2009), and elevation of resting Ca2+ in neurites (Kuchibhotla et al., 2008). Interestingly, the effect on resting Ca2+ was observed in only a fraction of neurites, with ≥70% of neurites within 25 μm of Aβ plaque appearing unaffected (Kuchibhotla et al., 2008). Likely because of the in vivo preparation in these and related studies, evoked and activity-dependent Ca2+ responses, electrophysiological membrane properties, synaptic properties, and spiking activity were not investigated. These neurophysiological components are fundamental for neuronal signaling and synaptic plasticity—the cellular mechanisms supporting learning and memory (Berridge, 2010). Indeed, AD mice with early Ca2+ signaling abnormalities exhibit marked synaptic deficits and shifts toward synaptic depression before the onset of amyloid deposits (Chakroborty et al., 2012; Goussakov et al., 2010; Palop and Mucke, 2010). Understanding the underlying mechanisms driving early synaptic pathophysiology is key to developing effective therapeutic strategies, because it is the breakdown in synaptic integrity that best correlates with cognitive loss in AD (Scheff and Price, 2006; Selkoe, 2002; Terry et al., 1991).
To accelerate progress in AD therapeutics, it might be productive to regard Ca2+ dyshomeostasis as part of a pathologic cycle including Aβ as a component. Here, we considered if close proximity to Aβ plaques can further exacerbate neuronal Ca2+ signaling, possibly accounting for the age-related progression of AD as Aβ deposits accumulate. To test this hypothesis, we measured activity-dependent Ca2+ signaling and membrane properties in hippocampal CA1 pyramidal neurons and correlated the magnitude of Ca2+ responses with distance from Aβ plaques. We used adult APPSWE/PS1M146V mice (APP/PS1), 3–14 months of age, representing the range through which Aβ initially deposits and cognitive deficits develop (Howlett et al., 2004). We found that Aβ plaque proximity did not significantly affect the magnitude of ryanodine receptor (RyR)-mediated Ca2+ release or the depolarization-activated Ca2+ influx responses, nor did we observe a consistent effect of Aβ plaque proximity on spontaneous synaptic potentials or membrane properties. However, we did observe an age-related increase in RyR-evoked Ca2+ release in the somata of APP/PS1 mice. The results suggest that early-onset disruptions of intracellular Ca2+ signaling can accelerate with age through mechanisms unrelated to Aβ plaques, and highlight the idea that pathogenic mechanisms other than Aβ might be contributing to AD-associated neuronal pathophysiology and Ca2+ dysregulation.
2. Methods
2.1. Animals
APPSWE/PS1M146V transgenic mice were initially obtained from GlaxoSmithKline R&D (Howlett et al., 2004) and subsequently bred in-house. Nontransgenic control mice included J29/C57BL6 bred in-house and C57Bl/6 mice purchased from The Jackson Laboratory (Bar Harbor, ME, USA). Male and female mice between 3 and 14 months old were used. Animals were cared for and used in accordance with protocols approved by the Rosalind Franklin University of Medicine and Science Animal Care and Use Committee.
2.2. Histochemistry
For an overview of Aβ plaque deposits, immunohistochemical and thioflavin-S staining were performed using 40 μm thick sections from paraformaldehyde-fixed brain tissue. Mice were anesthetized with halothane (inhalation) and 8% chloral hydrate (5 mL/kg intraperitoneally) and perfused with cold phosphate-buffered saline (PBS; Invitrogen, Grand Island, NY, USA) followed by 4% paraformaldehyde (5–8 mL at 5 mL/min). The brain was removed, incubated overnight at 4 °C in 30% sucrose (UltraPure; Invitrogen)/4% paraformaldehyde in PBS, and then transferred to 30% sucrose in PBS at 4 °C. Coronal sections were cryostat cut at −23 °C (Thermo Scientific Microm HM 550) and stored at −30 °C in a cryoprotectant mixture of glycerin:ethylene glycol:0.1 M sodium phosphate buffer (pH 7.0): 25:30:50.
Further incubations were conducted at room temperature using a rotary shaker, unless otherwise indicated. For thioflavin-S staining, free-floating sections were washed with Tris-buffered saline (TBS; 0.1 M Tris, 0.9% NaCl, pH 7.5; Sigma-Aldrich) 3 times for 10 minutes, incubated in 0.5% thioflavin-S (Sigma-Aldrich) in 50% ethanol for 10 minutes, and finally washed 2 times in 50% ethanol for 3 minutes followed by double-distilled water for 10 minutes. Stained sections were mounted on glass slides and sealed with 9.6% wt/vol polyvinyl alcohol, 24% wt/vol glycerol, 0.1 M Tris-Cl buffer pH 8.0 (PVA-DABCO; Sigma-Aldrich) under glass coverslips. Slides were dried overnight at room temperature (23 °C) protected from light and stored covered at 4 °C until imaged.
For immunohistochemical staining, free-floating slices were washed in TBS as above, incubated in 70% formic acid for 5 minutes, and then washed in TBS 2 times for 3 minutes each. Slices were blocked by incubation in 5% goat serum for 1 hour (Equitech Bio, Kerrville, TX, USA) plus 0.1% Triton-X 100 (Fluka) in PBS followed by 1 hour in 0.12 mg/mL goat anti-mouse F(ab′)2 (Jackson ImmunoResearch, West Grove, PA, USA). Slices were immunostained by incubation in 1:1000 dilution of 4G8 anti-Aβ 1° antibody (Covance, Madison, WI, USA) in 1% goat serum plus 0.0025% Triton-X 100 in PBS for 72 hours at 4 °C, then washed 3 times in TBS for 10 minutes each, then incubated with 1:1000 goat anti-mouse A488 2° antibody (Invitrogen) in 1% goat serum in TBS for 1 hour, and finally washed in TBS 2 times for 5 minutes each. Stained slices were mounted on glass slides and stored as above. Sections were imaged with a Zeiss 510 confocal microscope with a 10× objective and 1024 × 1024 digital resolution.
2.3. Patch-clamp electrophysiology
The preparation of hippocampal brain slices (300 μm) was modified from methods previously described (Goussakov et al., 2010). Mice were anesthetized with halothane, decapitated, and the brain removed into ice-cold sucrose cutting solution (200 mM sucrose, 1.5 mM KCl, 0.5 mM CaCl2, 4.0 mM MgCl2, 1.0 mM KH2PO4, 25 mM NaHCO3, 10 mM Na-ascorbate (Sigma-Aldrich), and 20 mM dextrose, equilibrated with 95% O2/5% CO2). Horizontal hippocampal slices were prepared in a Camden Instruments vibratome with the chamber filled with ice-cold sucrose cutting solution and then transferred to and maintained in standard artificial cerebrospinal fluid (aCSF; 130 mM NaCl, 2.5 mM KCl, 2.0 mM CaCl2, 1.2 mM MgSO4, 1.25 mM NaH2PO4, 25 mM NaHCO3, and 10 mM dextrose [305–310 mOsm], equilibrated with 95% O2/5% CO2, pH 7.3–7.4) at 32 °C for at least 1 hour before use. Before recording, each slice was stained with 0.0005% thioflavin-S in aCSF for 2 minutes at room temperature (23 °C). Patch-clamp recordings were conducted at room temperature (23.5 °C) in continuously superfused aCSF (1.5–2.0 mL/min). Drugs were applied via bath superfusion. Caffeine (20 mM for 1 minute) was used to activate RyR, and although caffeine also has antagonistic effects on the adenosine 1A receptor, we have previously tested and controlled for this (Chakroborty et al., 2009). Patch pipettes (5–7 MΩ) were filled with intracellular solution containing 135 mM K-gluconate, 2.0 mM MgCl2, 4.0 mM Na2ATP, 0.4 mM Na-GTP, 10 mM Na-phosphocreatine, 10 mM 4-(2-Hydroxyethyl)piperazine-1-ethanesulfonic acid, N-(2-Hydroxyethyl)piperazine-N′-(2-ethanesulfonic acid) (HEPES) (pH adjusted to 7.3 with KOH; materials from Sigma-Aldrich), and 50 μM bis-fura-2 hexapotassium (Invitrogen). Hippocampal CA1 pyramidal neurons were identified visually via infrared differential interference contrast (IR-DIC) optics, and electrophysiologically by their passive membrane properties and spike frequency accommodation. Membrane potentials were obtained in current-clamp mode, acquired at 10 kHz with a Digidata 1322 A-D converter and Multiclamp 700B amplifier, and recorded and analyzed using pClamp 10.2 (Molecular Devices). Spontaneous excitatory postsynaptic potentials (sEPSPs) were recorded in the absence of tetrodotoxin, because previous studies demonstrated that tetrodotoxin did not affect their frequency or amplitude properties in this preparation, consistent with the low occurrence of spontaneous action potentials in this slice preparation (Chakroborty et al., 2012; Goussakov et al., 2010). Minianalysis 6.0.7 (Synaptosoft, Fort Lee, NJ, USA) was used to detect and measure sEPSP events with a minimal amplitude of 0.2 mV and minimal area of 3 mV*msec. Baseline was determined from a 1 msec average immediately before each event, or in the case of overlapping events, from the peak and decay kinetics of the preceding event using “complex peak detection” in Minianalysis. Each recording was reviewed manually to reject baseline fluctuations and inhibitory postsynaptic potential decay tails mistakenly scored as events by the software. 6-Cyano-7-nitroquinoxaline-2,3-dione (Sigma-Aldrich) was used to confirm sEPSPs as glutamatergic synaptic potentials. Series resistance (<10 MΩ) was monitored throughout the experiment.
2.4. Ca2+ and fluorescence imaging
Ca2+ imaging within individual neurons was performed using a custom-made multiphoton-imaging system based on an upright Olympus BX51 microscope frame (Stutzmann and Parker, 2005). Individual neurons were filled with the Ca2+ indicator bis-fura-2 (50 μM) via the patch pipette. Laser excitation was provided by pulse trains (100 fs, 80 MHz) at 780 nm from a Ti:sapphire laser (Mai Tai Broadband, Spectra-Physics). The laser beam was scanned by a resonant galvanometer (General Scanning Lumonics), allowing rapid (7.9 kHz) bidirectional scanning in the x-axis, and by a conventional linear galvanometer in the y-axis, to provide a full-frame scan rate of 30 frames per second. The laser beam was focused on the tissue through a 40× water-immersion objective (numerical aperture 0.8). Emitted fluorescence was detected by a wide-field photomultiplier (Electron Tubes) to derive a video signal that was captured and analyzed by Video Savant 5.0 software (IO Industries). Analysis of background-corrected images was performed using MetaMorph 7.0 and Excel 2007 software. To ensure consistency between evoked responses within and between groups, the action potential-generating protocol was conducted first, before any drug exposure. Ca2+ measurements were acquired from the peak of the evoked response. During exposure to caffeine, data were acquired in a duty cycle comprising 1 second on every 3 seconds to minimize photobleaching. Each brain slice was exposed to only 1 application of caffeine. For clarity, results are expressed as inverse ratios so that increases in [Ca2+] correspond to increasing ratios. The spatial determination of thioflavin-S stained plaques in relation to the fura-2 filled neuron was first gauged by imaging the 3-dimensional space in the vicinity of the neuron by focusing approximately 100 μm above and below the neuron to establish the proximity of thioflavin-S staining in 3-dimensional space. We also generated 3-D stack movies to confirm and measure off-line the distances between filled neurons and the surrounding plaques. In the images shown in the figures, the closest plaques were in the X-Y plane. The dendritic regions imaged in the CA1 stratum radiatum were 20–100 μm from the soma. The stated Ca2+ values reflect the peak amplitude to most accurately measure the initial response. Ca2+ dynamics also are influenced through active extrusion across the plasma membrane, reuptake into intracellular stores, and buffering by Ca2+ binding proteins. These processes impact the kinetics and integral of the response and might be affected by Aβ or aging independently of intracellular Ca2+ release. Therefore, initial peak values were considered for this study.
2.5. Statistics
Differences were assessed using analysis of variance (ANOVA) with Tukey post hoc test or 2-tail Student t test, as indicated. For spontaneous postsynaptic potentials, the Kolmogorov–Smirnov (K-S) test was used. Significance was assessed at p < 0.05. Parametric data are shown as mean ± standard error of the mean.
3. Results
While Aβ deposits are demonstrable histochemically in APP/PS1 mice by 4 months of age, behavioral deficits emerge at approximately 7 months of age (Howlett et al., 2004; Minkeviciene et al., 2004; Sadowski et al., 2004). Whether this delay is simply because of the degree of Aβ plaque burden, or an age-related change in neuronal function is not clear. Accordingly, to determine whether the effect of Aβ plaque on Ca2+ responses might be age-dependent, data were acquired from animals 7–14 months old, an age range where behavioral deficits should be apparent, and from animals 3–6 months of age which is before cognitive impairment. We have previously shown that in young (6-week-old) APP/PS1 mice, RyR-mediated Ca2+ release is elevated in somata and dendrites compared with non-Tg controls (Goussakov et al., 2010). However, the implications of Ca2+ signaling dysregulation in soma, which might include apoptotic mechanisms and memory functions mediated via gene transcription regulation, differ significantly from those in dendrite and synaptic spines, which might include aberrant synaptic excitability and plasticity (Chakroborty and Stutzmann, 2011; Goussakov et al., 2010). In the following, therefore, soma and dendrite Ca2+ responses are measured separately.
3.1. Soluble and insoluble Aβ staining patterns
Fig. 1 shows the histochemical pattern of Aβ peptides stained with 4G8 antibody and Aβ dense-core plaques stained with thioflavin-S in hippocampal slices from 4.5- (Fig. 1A and C) and 7-month-old (Fig. 1B and D) APP/PS1 mice. Hippocampal Aβ deposits were routinely observed at the histochemical level in 4-month-old animals, and became more prevalent after 6 months of age. The 4G8 antibody, which is directed toward residues 17–24 within the Aβ peptide, detects soluble and insoluble Aβ species, and therefore reveals Aβ plaques, fibrils, and a corona around plaques containing soluble monomers, dimers, and oligomers (Aho et al., 2010; Goussakov et al., 2011). Staining with thioflavin-S, in contrast, selects for dense-core insoluble plaque deposits (Bussiere et al., 2004). For Ca2+ imaging and electrophysiology studies using live slices and 2-photon imaging, thioflavin-S was used to visualize extracellular Aβ plaques concurrently with Ca2+ imaging from individual patch-clamped neurons. Examples of this are shown in Fig. 1E and F for slices from 3–6-month-old mice and Fig. 1G and H for slices from 7–14-month-old mice at various distances from Aβ plaque. In the live, acutely-stained slices, the distance between plaque and neuron was measured relative to the edge of detectable thioflavin-S staining in X, Y, and Z planes. Unstained soluble Aβ could extend closer to the cell, however, at present, fluorescent markers for soluble Aβ within our living tissue preparations are not yet available. A fraction of soluble Aβ can diffuse from slices in vitro (Waters, 2010) and therefore, it should be noted that the present experiments address mechanisms that might be triggered through proximity to Aβ plaques and sustained exposure to soluble Aβ species, but might be less sensitive to the acute effects of soluble Aβ species.
Fig. 1.
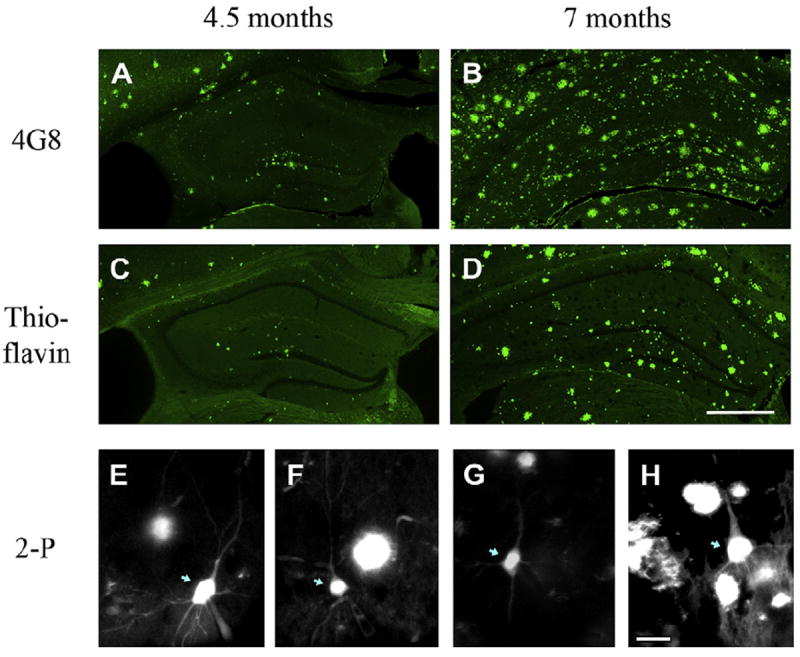
Aβ and dense-core plaques in APP/PS1 mouse hippocampus. (A–D) Representative images comparing amyloid staining with 4G8 Aβ antibody (A and B) and thioflavin-S (C and D) in 40 μm hippocampal slices from 4.5-month-old (A and C) and 7-month-old (B and D) APP/PS1 mice. Slices from the same animal (A and C, and B and D) were taken 120 μm from each other. Scale bar in (D) = 500 μm. (E–H) Representative 2-photon microscopy images of hippocampal CA1 pyramidal neurons in live slices stained with thioflavin-S. (E and F) Images from the younger cohort (3 and 4 months of age, respectively) with representative neurons far and near plaques, respectively. (G and H) Images from the older cohort (8 and 11 months of age, respectively). Pyramidal neurons are indicated with blue arrows; remaining fluorescent images are thioflavin-S stained plaques. Scale bar = 25 μm. Abbreviations: 2-P, 2-photon; Aβ, beta amyloid peptide.
3.2. Somal Ca2+ responses in relation to distance from Aβ plaques
Representative images in Fig. 2 show a fura-filled CA1 neuron soma from an 11-month-old APP/PS1 mouse. The RyR-evoked Ca2+ response elicited by caffeine (20 mM for 1 minute) is depicted by the pseudocolor images in Fig. 2A and trace in Fig. 2B. To evaluate possible effects of Aβ plaque proximity, individual peak RyR Ca2+ responses were plotted as a function of plaque distance, irrespective of age of the APP/PS1 mouse, as shown in Fig. 2C. Ca2+ responses were not significantly correlated with distance from plaque, whether the correlation was drawn against log (distance) as in Fig. 2C, linear distance (not shown), or 1/distance2 (not shown); slopes of these correlations were not significantly different from 0 (p > 0.05, F(1,38) = 0.013, 0.58, and 0.12, respectively). Fig. 2D shows these data grouped by age (3–6 and 7–14 months) and plaque proximity (≤25 μm and >25 μm from the nearest plaque), together with comparison with data from age-matched non-transgenic (non-Tg) controls. Within APP/PS1, 2-way ANOVA indicated no effect of plaque proximity (F(1,36) = 0.41; p > 0.05) in either age group, but did detect a significant effect of age (F(1,36) = 7.09; p < 0.05). In neurons >25 μm from Aβ plaque, RyR Ca2+ responses in slices from 7–14-month-old mice were 2.6-fold larger than those from 3–6-month-old mice (p < 0.05, Tukey posttest).
Fig. 2.
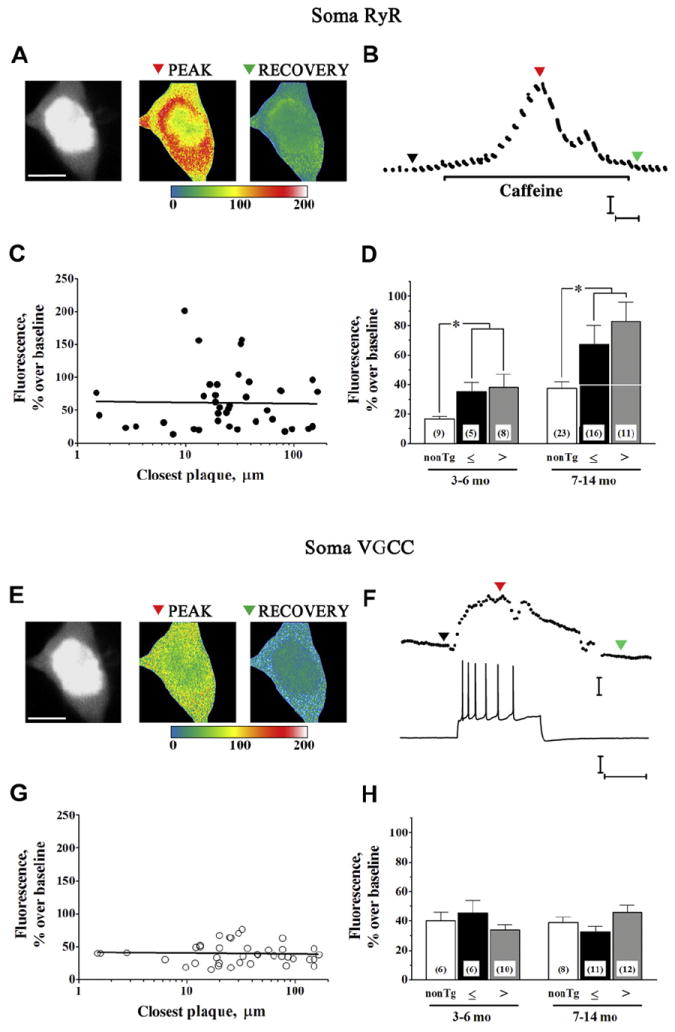
Somal Ca2+ responses to RyR and VGCC activation. (A) Two-photon Ca2+ images show representative RyR-evoked Ca2+ responses in a CA1 pyramidal neuron 33 μm from the nearest plaque from an 11-month-old APP/PS1 mouse (see also Fig. 1H). Monochromatic morphologic image at rest (left), relative fluorescence change in response to 20 mM (1 minute) caffeine (middle; pseudocolored), and recovery after caffeine (right, pseudocolored) are shown from a representative neuron (scale bar = 10 μm). Color scale bar = % fluorescence change from baseline. (B) Time scale of RyR-evoked Ca2+ response from dendrite shown in (A). Colored triangles correspond to baseline, peak, and recovery images in (A). Calibration bars = 25% ΔF and 10 seconds. (C) Regression plot shows individual somal RyR Ca2+ responses (n = 40) plotted as a function of log (plaque distance). Linear regression data were not statistically significant. (D) Bar graph summarizes data separated according to mouse strain, age, and proximity of soma to Aβ plaque, depicting (left to right) RyR Ca2+ responses in nontransgenic somata (white bars) and APP/PS1 somata ≤25 μm (black bars) and >25 μm (gray bars) from Aβ plaque in slices from 3–6-month-old mice (left grouping) and 7–14-month-old mice (right grouping). * p < 0.05. Number of cells per group are shown within bars. (E) Pseudocolored images show relative fluorescence change because of Ca2+ influx triggered by spike train at the peak of the response and recovery to baseline. (F) Representative spike train generated by depolarizing current pulse (bottom) and corresponding Ca2+ response (top), with colored triangles corresponding to images in (E). Calibration bars = 25% ΔF over baseline, 25 mV and 0.5 seconds. (G) Regression plot shows individual somal VGCC Ca2+ responses (n = 39) plotted as a function of log (plaque distance). Each point represents responses from a single neuron from 1 slice. Linear regression data were not statistically significant. (H) Bar graph summarizes action potential-evoked Ca2+ responses (left to right) in nontransgenic somata (white bars) and APP/PS1 somata ≤25 μm (black bars) and >25 μm (gray bars) from Aβ plaque in slices from 3–6-month-old mice (left grouping) and 7–14-month-old mice (right grouping). Abbreviations: ΔF, change in fluorescence; Aβ, beta amyloid peptide; RyR, ryanodine receptor; VGCC, voltage-gated calcium channel.
The voltage-gated calcium channel (VGCC) Ca2+ influx response elicited by injection of depolarizing current is represented by images and trace in Fig. 2E and F, and data are summarized in Fig. 2G and H. VGCC Ca2+ responses, as for RyR Ca2+ responses, showed no correlation with log plaque distance (Fig. 2G; slope not significantly different from 0; F(1,39) = 0.08; p > 0.05). Similar correlations drawn against linear plaque distance (not shown) and 1/distance2 (not shown) likewise were not significant (F(1,37) = 0.67 and 0.002, respectively; p > 0.05). Two-way ANOVA showed no significant effect of plaque proximity in either age group (Fig. 2H; F(1,35) = 0.024; p > 0.05). Unlike RyR, VGCC Ca2+ responses showed no effect of age (F(1,35) = 0.007; p > 0.05). Thus, although RyR-evoked Ca2+ responses are elevated beyond 6 months of age, when cognitive deficits emerge, we did not find a relationship between Aβ plaque proximity and the magnitude of the Ca2+ response in the soma.
APP/PS1 mice continue to deposit Aβ plaques with age. In view of the age-related increase in somal RyR Ca2+ responses in APP/PS1, we wished to determine whether this might be related to plaque deposition or some other age-related process and therefore also measured somal Ca2+ responses in age-matched non-Tg mice. As shown in Fig. 2D and Table 1, somal RyR Ca2+ responses, irrespective of plaque distance, exhibited significant differences by age (F(1,68) = 11.21; p < 0.01) as well as by strain (F(1,68) = 10.91; p < 0.01). Responses in 7–14-month-old APP/PS1 mice were approximately 2-fold larger than those in the younger APP/PS1 (p < 0.01) and those in the age-matched non-Tg mice (p < 0.01). Additionally, however, an age-related increase in somal RyR Ca2+ responses also was observed in the non-Tg mice (p < 0.05), suggesting that this difference might be unrelated to Aβ plaque deposition. VGCC Ca2+ responses, in contrast, showed no significant difference by mouse strain (F(1,49) = 0.009; p > 0.05) or age (F(1,49) = 0.0007; p > 0.05).
Table 1.
Ca2+ responses in somal and dendritic compartments of APP/PS1 and non-Tg pyramidal neurons
| Ca2+ response | Region | Age, mo | Strain | Fluorescence, % greater than baseline |
|---|---|---|---|---|
| RyR | Soma | 3–6 | Non-Tg | 17 ± 2 (9) |
| APP/PS1 | 37 ± 6 (13)a | |||
| 7–14 | Non-Tg | 37 ± 4 (23)b | ||
| APP/PS1 | 74 ± 9 (27)a,b | |||
| Dendrite | 3–6 | Non-Tg | 30 ± 4 (10) | |
| APP/PS1 | 117 ± 28 (13)a | |||
| 7–14 | Non-Tg | 55 ± 9 (10) | ||
| APP/PS1 | 120 ± 19 (19)a | |||
| VGCC | Soma | 3–6 | Non-Tg | 40 ± 6 (6) |
| APP/PS1 | 38 ± 4 (16) | |||
| 7–14 | Non-Tg | 39 ± 4 (8) | ||
| APP/PS1 | 40 ± 3 (23) | |||
| Dendrite | 3–6 | Non-Tg | 45 ± 7 (13) | |
| APP/PS1 | 63 ± 7 (13) | |||
| 7–14 | Non-Tg | 35 ± 9 (14) | ||
| APP/PS1 | 45 ± 9 (17) |
Statistical comparisons were made using 2-way analysis of variance, Tukey posttest, and unpaired t test. Number of measurements is shown in parentheses.
Key: RyR, ryanodine receptor; Tg, transgenic; VGCC, voltage-gated calcium channel.
p < 0.05 strain difference; APP/PS1 compared with non-Tg mice in the same age group.
p < 0.05 age difference: 7–14- compared with 3–6-mo-old mice within strain.
3.3. Dendritic Ca2+ responses in relation to distance from Aβ plaques
Representative RyR Ca2+ response measurements from a CA1 dendrite segment 6 μm from the edge of a thioflavin-stained plaque are shown in Fig. 3A and B; the neuron and plaque are shown at lower magnification in Fig. 1F. No significant correlation was observed between dendritic RyR Ca2+ responses and log Aβ plaque distance, irrespective of animal age (Fig. 3C; slope not significantly different from 0; F(1,30) = 0.401; p > 0.05) nor was there a significant correlation when responses were to a linear function of distance or to 1/distance2 (not shown; F(1,30) = 0.54 and 0.089, respectively). These data are averaged and grouped by age and Aβ plaque proximity and compared with non-Tg controls in Fig. 3D. Within APP/PS1, 2-way ANOVA showed no significant effect of plaque proximity (F(1,28) = 1.18; p > 0.05) or age (F(1,28) = 0.30; p > 0.05) on the dendritic RyR Ca2+ responses. Responses in APP/PS1 were, however, significantly larger than those in age-matched non-Tg controls (F(1,48) = 13.36; p < 0.01) as shown in Fig. 3D and Table 1.
Fig. 3.
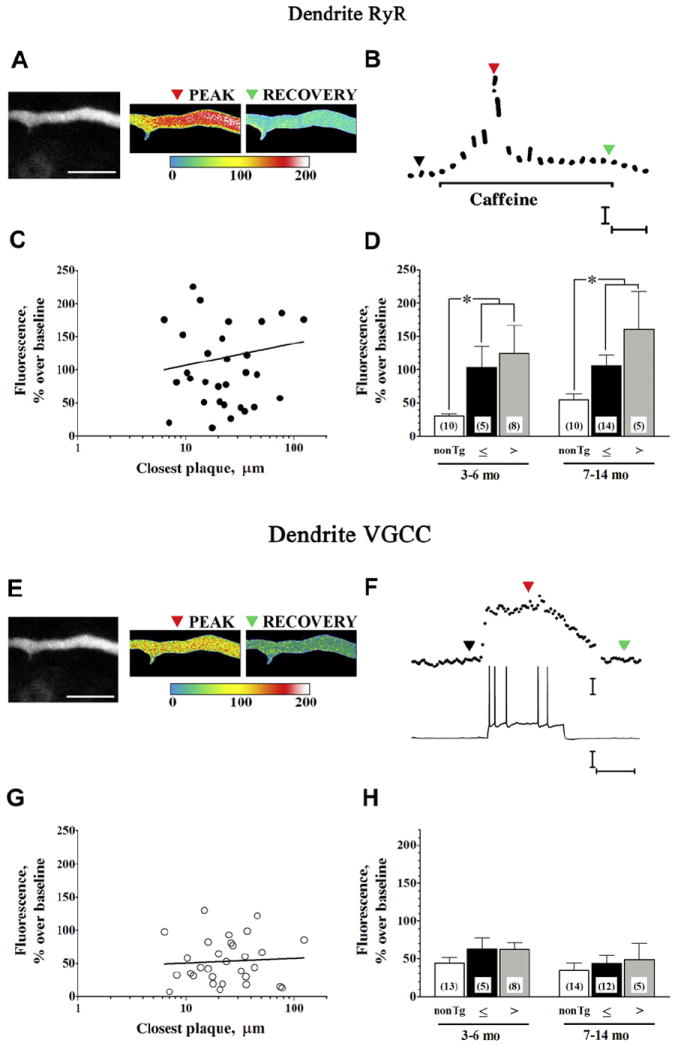
Dendritic Ca2+ responses to RyR and VGCC activation. (A) Two-photon images show representative RyR-evoked Ca2+responses from a CA1 pyramidal neuron dendrite 6 μm from a thioflavin-S stained plaque from a 3.7-month-old APP/PS1 mouse (see also Fig. 1F). Baseline fluorescence (monochrome), relative fluorescence change in response to caffeine (20 mM, 1 minute; pseudocolored), and recovery (pseudocolored) are shown from left to right, respectively (scale bar = 10 μm). Color scale bar = % fluorescence change from baseline. (B) Time scale of RyR-evoked Ca2+ response from dendrite shown in (A). Colored triangles correspond to baseline, peak, and recovery images in (A). Calibration = 50% ΔF and 10 seconds. (C) Line graph shows individual dendritic RyR Ca2+ responses (n = 32) plotted as a function of log (plaque distance). Linear regression data were not statistically significant. (D) Bar graph summarizes RyR-evoked Ca2+ responses (left to right) in nontransgenic (white bars) and APP/PS1 dendrite segments ≤25 μm (black bars) and >25 μm (gray bars) from Aβ plaque in slices from 3–6-month-old mice (left grouping) and 7–14-month-old mice (right grouping). * p < 0.05. (E) Pseudocolored dendritic images show relative fluorescence change becaise of Ca2+ influx triggered by spike train at the peak of the response and recovery to baseline. (F) Representative spike train generated by depolarizing current pulse (bottom) and corresponding Ca2+ response (top), with markers corresponding to images in (E). Calibration bars = 25% ΔF over baseline, 25 mV and 0.5 seconds. (G) Line graph shows individual dendritic VGCC Ca2+ responses (n = 30) plotted as a function of log (plaque distance). Linear regression data were not statistically significant. (H) Bar graph summarizes VGCC Ca2+ responses (left to right) in nontransgenic (white bars) and APP/PS1 dendrite segments ≤25 μm (black bars) and >25 μm (gray bars) from Aβ plaque in slices from 3–6-month-old mice (left grouping) and 7–14-month-old mice (right grouping). Abbreviations: ΔF, change in fluorescence; Aβ, beta amyloid peptide; RyR, ryanodine receptor; VGCC, voltage-gated calcium channel.
VGCC Ca2+ responses from the same dendrite segment are shown in Fig. 3E and F, and averaged data are presented in Fig. 3G and H. Again, there was no significant correlation between the dendritic VGCC Ca2+ response and log plaque distance (Fig. 3G; slope not significantly different from 0; F(1,28) = 0.108; p > 0.05), linear plaque distance (not shown; F(1,28) = 0.08), nor 1/distance2 (not shown; F(1,28) = 0.038). Two-way ANOVA of the grouped data (Fig. 3H) showed no significant effect of plaque proximity (F(1,26) = 0.026; p > 0.05) or age (F(1,26) = 1.51; p > 0.05) within APP/PS1, and no significant difference between APP/PS1 and age-matched non-Tg controls (F(1,53) = 2.79; p > 0.05).
3.4. Spontaneous synaptic activity
Previous studies have demonstrated that RyR activation stimulates glutamatergic spontaneous sEPSP activity in APP/PS1 and other FAD mice, likely through RyR-evoked Ca2+ release from endoplasmic reticulum extending into presynaptic terminals, with little effect in non-Tg control mice (Bouchard et al., 2003; Chakroborty et al., 2009; Goussakov et al., 2010). In view of the surprising lack of effect of Aβ plaque proximity on somatic and dendritic Ca2+ responses, we also evaluated RyR activation on sEPSP frequency and amplitude in neurons ≤25 μm and >25 μm from Aβ plaque to determine whether these synaptic responses might be more sensitive to the presence of Aβ plaques. AMPA-sensitive receptor blockade with 6-cyano-7-nitroquinoxaline-2,3-dione (10 μM) confirmed the sEPSPs as glutamatergic (Fig. 4A; 9 recordings from cells ≤25 μm and >25 μm from plaques).
Fig. 4.
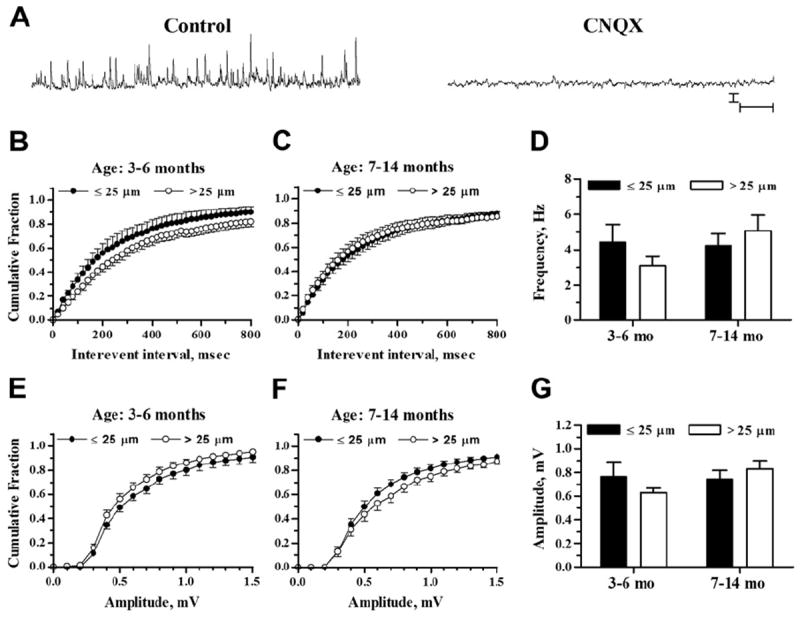
sEPSP frequencies and amplitudes in relation to plaque proximity. (A) Representative traces show sEPSP recordings in a pyramidal neuron 48 μm from an Aβ plaque (10-month-old APP/PS1 mouse). Recordings were taken before (left trace) and after (right trace) exposure to 10 μM CNQX. Scale bars = 1 mV and 1 second. (B and C) Plots show sEPSP interevent intervals graphed as cumulative probability histograms from 3–6- and 7–14-month-old mice, respectively. (D) Bar graph shows mean sEPSP frequencies from neurons ≤25 μm and >25 μm from Aβ plaque from 3–6-month-old (left) and 7–14-month-old mice (right). (E and F) sEPSP amplitude distributions are shown as cumulative probability histograms from 3–6- and 7–14-month-old mice, respectively. (G) Bar graph shows mean sEPSP amplitude from neurons ≤25 μm and >25 μm from Aβ plaque from 3–6-month-old (left) and 7–14-month-old mice (right). Sample sizes were n = 7 for ≤25 μm, 3–6 months; n = 15 for >25 μm, 3–6 months; n = 19 for ≤25 μm, 7–14 months; and n = 18 for >25 μm, 7–14 months. Abbreviations: Aβ, beta amyloid peptide; CNQX, 6-cyano-7-nitroquinoxaline-2,3-dione; sEPSP, spontaneous excitatory postsynaptic potential.
Before exposure to caffeine, the interevent interval distribution of sEPSP events was leftward shifted in APP/PS1 pyramidal neurons with somata ≤25 μm from plaques versus neurons >25 μm from plaques in the 3–6 month age group, indicating a greater proportion of events with reduced interevent intervals (Fig. 4B; K-S test Z = 4.53; p < 0.05 comparing 1-minute recording epochs). However, a similar comparison in the 7–14 month age group (Fig. 4C) showed a small, opposite shift toward larger intervals in cells ≤25 μm from plaques (Z = 1.75; p < 0.05). Mean parametric data (Fig. 4D) reflect the average frequency of sEPSPs and are less sensitive to the distribution of events. In this analysis, the averaged sEPSP frequencies were not significantly affected by Aβ plaque proximity (2-way ANOVA, F(1,55) = 0.09; p > 0.05) or by age (F(1,55) = 1.19; p > 0.05). The distributions of sEPSP amplitudes likewise showed small differences as a function of plaque proximity with opposite shifts in the 2 age groups. In neurons from 3–6-month-old mice, the cumulative amplitude distribution histogram (Fig. 4E) was rightward shifted in neurons ≤25 μm from Aβ plaque (Z = 2.6077; p < 0.05) and a similar comparison in slices from 7–14-month-old mice (Fig. 4F) showed a leftward shift in neurons ≤25 μm from Aβ plaque (Z = 2.29; p = 0.05). Mean amplitudes (Fig. 4G), however, were not significantly affected by plaque proximity (2-way ANOVA, F(1,55) = 0.12; p > 0.5) or age (F(1,55) = 1.27; p > 0.05). Thus, though there might be some effect of plaque proximity to shift patterns of sEPSP frequency and amplitude in the younger mice (Busche et al., 2012), the difference we observed was subtle and not observed in the older group.
The effects of caffeine application (20 mM, 1 minute) are shown in Fig. 5 for 3–6-month-old and Fig. 6 for 7–14-month-old APP/PS1 mice. In the younger mice, caffeine stimulated an increase in sEPSP frequency in neurons ≤25 μm from Aβ plaque and in neurons >25 μm from Aβ plaque, as reflected by the leftward shift in the cumulative interevent interval histogram (Fig. 5B and C) and as demonstrated by a significant increase in the mean frequency (Fig. 5D). The effect of caffeine was significant by K-S test (Z = 4.47; p < 0.001 for ≤25 μm and Z = 4.73; p < 0.001 for >25 μm plaque proximity). Mean frequencies (Fig. 5D) were increased by 148 ± 50% in cells ≤25 μm from Aβ plaque (p < 0.05; n = 7; 2-tailed paired t test) and by 166 ± 20% in cells >25 μm from Aβ plaque (p < 0.001; n = 15). Two-way ANOVA showed a significant effect of caffeine (F(1,40) = 24.65; p < 0.001) but no main effect of plaque proximity alone (F(1,40) = 2.97; p > 0.05) nor an interaction between plaque proximity and RyR stimulation by caffeine (F(1,40) = 0.02; p > 0.5).
Fig. 5.
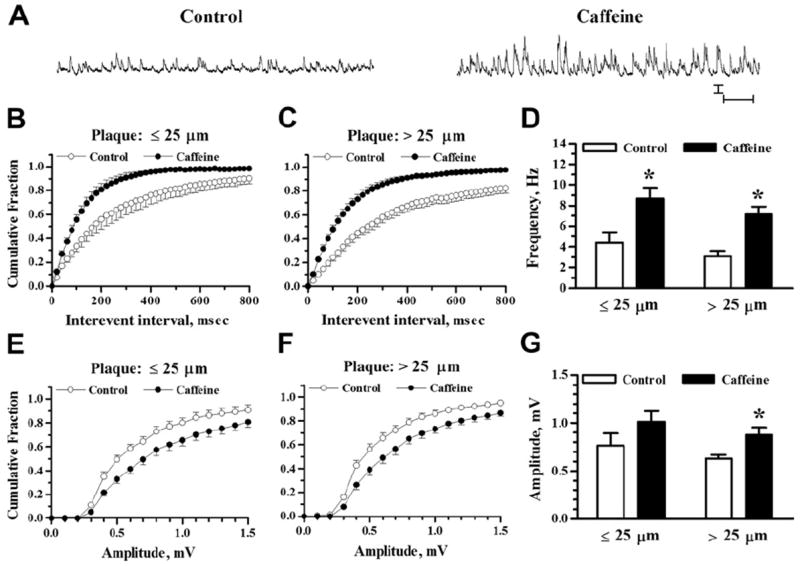
Increased sEPSP activity by RyR activation in 3–6-month-old APP/PS1 mice. (A) Representative traces of sEPSP recordings in a pyramidal neuron 167 μm from an Aβ plaque (3-month-old APP/PS1 mouse). Recordings were taken before (left) and 5 minutes after (right) 1 minute exposure to 20 mM caffeine. Scale bars = 1 mV and 1 second. (B and C) Cumulative probability histograms of sEPSP interevent intervals before and after caffeine application for neurons near and far from plaques, respectively. (D) Bar graph shows mean sEPSP frequencies before and after caffeine for neurons ≤25 μm and >25 μm from Aβ plaque. (E and F) sEPSP amplitude cumulative probability distributions before and after caffeine are shown for neurons near and far from plaques, respectively. (G) Bar graph shows mean sEPSP amplitude before and after caffeine for neurons ≤25 μm and >25 μm from Aβ plaque. Sample sizes were n = 7 neurons ≤25 μm from Aβ plaque and n = 15 neurons >25 μm from Aβ plaque. * p < 0.05. Abbreviations: Aβ, beta amyloid peptide; RyR, ryanodine receptor; sEPSP, spontaneous excitatory postsynaptic potential.
Fig. 6.
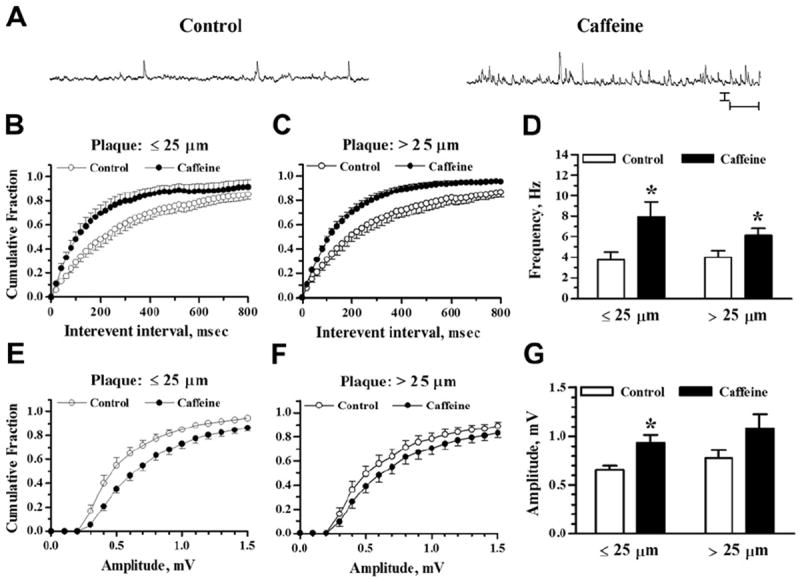
Increased sEPSP activity by RyR activation in 7–14-month-old APP/PS1 mice. (A) Representative traces show sEPSP recordings in a pyramidal neuron 77 μm from an Aβ plaque (9-month-old APP/PS1 mouse). Recordings were taken before (left trace) and after (right trace) 1 minute exposure to 20 mM caffeine. Scale bars = 1 mV and 1 second. (B and C) Cumulative probability histograms of sEPSP interevent intervals before and after caffeine application for neurons near and far from plaques, respectively. (D) Bar graph shows mean sEPSP frequency before and after caffeine application from neurons ≤25 μm and >25 μm from Aβ plaque. (E and F) sEPSP amplitude cumulative probability distributions are shown for neurons near and far from plaques, respectively. (G) Bar graph shows mean sEPSP amplitude before and after caffeine for neurons ≤25 μm and >25 μm from Aβ plaque. Sample sizes were n = 13 neurons ≤25 μm and n = 13 neurons >25 μm from Aβ plaque. * p < 0.05. Abbreviations: Aβ, beta amyloid peptide; RyR, ryanodine receptor; sEPSP, spontaneous excitatory postsynaptic potential.
The distribution plots of sEPSP amplitudes after RyR activation also were altered in neurons ≤25 μm and >25 μm from Aβ plaque in the younger mice (Fig. 5E–G). The shift to larger amplitudes was statistically significant for both plaque proximity groups (Z = 3.30; p < 0.001 for ≤25 μm; Z = 2.13; p < 0.001 for >25 μm). Mean amplitudes (Fig. 5G) were increased by 39 ± 9% in the >25 μm plaque proximity group (p < 0.05; n = 15) but the 38 ± 9% increase in the ≤25 μm group did not reach statistical significance (p > 0.05; n = 7). Two-way ANOVA showed a significant effect of caffeine (F(1,40) = 8.21; p < 0.01) but not a significant effect of plaque proximity alone (F(1,40) = 2.58; p > 0.05) nor an interaction between plaque proximity and caffeine effect (F(1,40) = 0.00; p > 0.5).
Similarly, in slices from 7–14-month-old mice (Fig. 6), RyR activation shifted the distribution of sEPSP intervals leftward in neurons ≤25 μm and >25 μm from Aβ plaque. The shifts to shorter interevent intervals (Fig. 6B and C) were statistically significant by K-S test (Z = 3.33; p < 0.001 for ≤25 μm; Z = 5.17; p < 0.001 for >25 μm). Mean frequencies (Fig. 6D) were increased by 125 ± 30% in neurons ≤25 μm from Aβ plaque (p < 0.05; n = 13) and by 92 ± 27% in those >25 μm from plaque (p < 0.05; n = 13). By 2-way ANOVA, the main effect of caffeine was statistically significant (F(1,48) = 11.14; p < 0.002) but there was no main effect of plaque proximity (F(1,48) = 0.61; p > 0.05) nor an interaction effect (F(1,48) = 1.04; p > 0.05).
The sEPSP amplitudes also were increased after RyR activation in 7–14-month-old mice. Cumulative amplitude histograms (Fig. 6E and F) show shifts to larger amplitudes that were significant by K-S test in both plaque proximity groups (Z = 3.91; p < 0.001 for ≤25 μm; Z = 2.26; p < 0.001 for >25 μm). Mean amplitudes (Fig. 6G) were increased by 45 ± 10% in the ≤25 μm plaque proximity group (p < 0.01; n = 13) but in the >25 μm group the 44 ± 13% increase was not statistically significant (p > 0.05; n = 13). Two-way ANOVA showed a significant effect of caffeine (F(1,48) = 9.76; p < 0.01) and plaque proximity did not significantly affect mean amplitude (F(1,48) = 1.92; p > 0.05) nor did it interact with the effect of caffeine (F(1,48) = 0.03; p > 0.5).
In sum, though there was some evidence for shifts in the distribution of glutamatergic sEPSP properties in CA1 pyramidal neurons near Aβ plaque in the younger animals, we observed no clear effect of Aβ plaque proximity on mean frequency or amplitude of glutamatergic sEPSPs, nor was there a significant interaction of Aβ plaque proximity with the RyR stimulation of sEPSPs. What was consistently observed was an increase in the frequency and amplitude of sEPSPs after RyR stimulation with caffeine, as demonstrated in previous studies (Chakroborty et al., 2012; Goussakov et al., 2010).
3.5. Passive and active membrane properties
Electrophysiological properties for neurons contributing Ca2+ and sEPSP data are shown in Tables 2 and 3. The measurements included resting membrane potential, membrane input resistance, and the threshold, amplitude, and half-width of the initial action potential in depolarization-induced spike trains. Comparisons were made between the younger and older cohorts of APP/PS1 and non-Tg mice (Table 2), and we broke out plaque proximity as a variable for the APP/PS1 mice (Table 3). Among these, there were no significant differences in membrane properties among the groups, with the exceptions of (1) shorter action potential half-width in older APP/PS1 compared with age-matched non-Tg neurons (Table 2) and compared with younger APP/PS1 neurons further from plaques (Table 3); and (2) higher input resistance in older APP/PS1 neurons further from plaques (Table 3). Interestingly, the action potential half-width also is reduced in CA1 hippocampal neurons of CRND8 (APPSWE/IND) mice, apparently because of upregulation of Kv3.1b potassium channels (Wykes et al., 2012). The differences in action potential half-width we observed might also be related to the increased RyR-mediated intracellular Ca2+ release in the older animals, as we have also observed increased coupling of RyR-evoked Ca2+ to Ca2+-activated K+ currents invoked during trains of action potentials (Chakroborty et al., 2012; Stutzmann et al., 2006).
Table 2.
Passive and active membrane properties of CA1 pyramidal neurons from APP/PS1 compared with non-Tg control mice
| Age (mo) | Strain | Vm (mV) | Rin (MΩ) | Threshold (mV) | Amplitude (mV) | Half width (ms) |
|---|---|---|---|---|---|---|
| 3–6 | Non-Tg | −71.8 ± 0.1 (21) | 162 ± 11 (21) | −47 ± 1 (17) | 90 ± 2 (17) | 1.99 ± 0.06 (17) |
| APP/PS1 | −71.4 ± 0.1 (30) | 141 ± 9 (30) | −44 ± 1 (28) | 92 ± 2 (28) | 1.86 ± 0.05 (28) | |
| 7–14 | Non-Tg | −71.6 ± 0.2 (31) | 160 ± 8 (31) | −47 ± 1 (28) | 93 ± 2 (28) | 1.96 ± 0.05 (28) |
| APP/PS1 | −71.5 ± 0.2 (41) | 162 ± 11 (41) | −45 ± 1 (40) | 89 ± 2 (40) | 1.62 ± 0.05 (40)a,b |
Columns represent mouse strain, age at time of sacrifice, cell potential (Vm), input resistance (Rin), and properties of the first action potential in the spike train (threshold potential for spike initiation, spike amplitude measured from threshold, and spike width measured at half amplitude). Statistical comparisons were made using 2-way analysis of variance followed by Tukey posttest. Number of measurements is shown in parentheses.
Key: Tg, transgenic.
p < 0.01 strain difference; APP/PS1 compared with non-Tg mice in the same age group.
p < 0.01 age difference; 7–14- compared with 3–6-mo-old mice within strain.
Table 3.
Passive and active membrane properties of CA1 pyramidal neurons from APP/PS1 mice
| Strain and age (mo) | Plaque proximity (μm) | Vm (mV) | Rin (MΩ) | Threshold (mV) | Amplitude (mV) | Half width (ms) |
|---|---|---|---|---|---|---|
| APP/PS1 3–6 | 3.3–25 | −71.8 ± 0.3 (10) | 135 ± 17 (10) | −48 ± 2 (8) | 94 ± 2 (8) | 1.74 ± 0.08 (8) |
| 28–180 | −71.2 ± 0.2 (20) | 145 ± 11 (20) | −43 ± 1 (20) | 91 ± 2 (20) | 1.90 ± 0.06 (20) | |
| APP/PS1 7–14 | 1.5–24 | −71.7 ± 0.4 (22) | 138 ± 13 (22) | −44 ± 2 (22) | 89 ± 2 (22) | 1.61 ± 0.06 (22) |
| 26–150 | −71.3 ± 0.2 (19) | 189 ± 17 (19)a,b | −45 ± 2 (18) | 89 ± 3 (18) | 1.63 ± 0.09 (18)b |
Columns represent age at time of sacrifice, distance between soma and the nearest Aβ plaque, cell potential (Vm), input resistance (Rin), and properties of the first action potential in the spike train (threshold potential for spike initiation, spike amplitude measured from threshold, and spike width measured at half amplitude). Statistical comparisons were made using 2-way analysis of variance followed by Tukey posttest. Number of measurements is shown in parentheses.
p < 0.01 plaque proximity difference; 7–14-mo-old compared within age group.
p < 0.05 age difference; 7–14-mo-old compared with 3–6-mo-old mice within plaque proximity group.
4. Discussion
Considerable emphasis has been placed on the pathologic role of Aβ in Alzheimer’s disease, in part because of historical context and identification of Aβ as a principle component of the plaques that define AD histopathologically (Selkoe, 2011a). However, the pathogenic mechanisms of Aβ remain incompletely understood (Benilova et al., 2012; Castellani and Smith, 2011; Herrup, 2010; Karran et al., 2011; Spires-Jones and Knafo, 2012) and the fractured correlation between Aβ deposits and cognitive dysfunction is perplexing (Arnold et al., 2013; Arriagada et al., 1992; Goldman et al., 2001; Kazee and Johnson, 1998; Schmitt et al., 2000). At the cellular mechanisms level, similar uncertainties exist and are confounded by studies using exogenous application of Aβ peptides at concentrations significantly greater than what is found endogenously in brains of AD models (Waters, 2010) and uncertainty as to the structure of Aβ species most critical to AD pathogenesis (Benilova et al., 2012; Larson and Lesne, 2012). In vivo studies investigating effects of amyloid plaques on resting Ca2+ have yielded remarkable information, but further studies are needed to establish a clear association between endogenous amyloid deposits and neuronal signaling, because only a subset of cortical cells or neurites in close proximity to plaques demonstrate Ca2+ alterations (Kuchibhotla et al., 2008, 2009). Though in vivo studies allow for the opportunity to observe effects of endogenous amyloid plaques in superficial brain regions, there are inherent accessibility constraints that limit the ability to closely monitor evoked responses and probe neurophysiological parameters at the single cell and subcellular resolution levels. Therefore we used the hippocampal brain slice preparation and patch clamp recordings to examine the effects of endogenously generated Aβ plaques on activity-dependent Ca2+ signaling at the cellular and synaptic levels in hippocampal neurons, with an initial hypothesis consistent with the in vitro literature demonstrating marked Ca2+ increases with exogenous Aβ application and the in vivo studies suggesting associations between Aβ plaque proximity and resting Ca2+ levels (Kuchibhotla et al., 2008). There is a considerable body of literature demonstrating that mutant presenilin FAD mice express dysregulated intracellular Ca2+ signaling, and this alters synaptic transmission properties and Ca2+-regulated signaling cascades that control synaptic plasticity (Chakroborty et al., 2012; Foskett, 2010; Goussakov et al., 2010; Muller et al., 2011a, 2011b; Shilling et al., 2012; Stutzmann et al., 2006; Supnet and Bezprozvanny, 2011). Though the aberrant Ca2+ responses can occur in the absence of Aβ plaque, we hypothesized that proximity to Aβ plaque might further exacerbate aberrant Ca2+ signaling, and underlie progressive aberrations in neuronal function as Aβ deposits are elaborated.
Rather, we found no evidence that neuronal proximity to Aβ plaque affected either dendritic or somal intracellular RyR-mediated Ca2+ release or VGCC-mediated Ca2+ influx in neurons of APP/PS1 mice. These studies used aged animals in which cognitive deficits have been described (Howlett et al., 2004) and younger animals to represent a presymptomatic stage, yet neither cohort revealed a profound influence of Aβ plaque under our experimental conditions. The recordings were conducted at ambient room temperature, which might affect response kinetics, yet we were able to resolve differences in signaling because of age and mouse strain. As we are not aware of reports establishing a temperature-dependent effect of Aβ on Ca2+ responses, we reason it likely that if there were a significant effect of plaques on any of the signaling parameters we examined, this would have been detected. In contrast to the lack of Aβ plaque effect, we did observe a 2- to 4-fold elevation of RyR Ca2+ responses in APP/PS1 compared with non-Tg pyramidal neurons, and age-related elevations of the RyR-evoked Ca2+ response in pyramidal neuron somata from both APP/PS1 and non-Tg mice. This observation is consistent with studies in the aging field (Bodhinathan et al., 2010; Kumar et al., 2009; Thibault et al., 2007), and might reflect documented age-related increases in oxidative stress and shifts in the intracellular redox state which enhance responsiveness of RyRs to intracellular Ca2+ (Bull et al., 2007; Hidalgo et al., 2005). In AD mice, the shift in oxidative state might occur earlier, and in conjunction with a lower antioxidant defense, further increasing RyR signaling (Ghosh et al., 2012).
Aberrant RyR Ca2+ signaling has been shown to disrupt synaptic plasticity mechanisms linked with memory and cognitive performance (Chakroborty et al., 2012) and it is of interest that the Ca2+ signaling becomes further imbalanced at ages when cognitive deficits become apparent. Additionally, other studies have demonstrated an age-related increase in Ca2+ channel currents in wild type animals of various species (Gant et al., 2011; Oh et al., 2010). However, the normal upregulation of Ca2+ channels might be diminished in APP/PS1 transgenic mice, as suggested by the recent discovery that L-type Ca2+ currents are reduced in aged APPNlh/PS1P264L mice compared with non-Tg controls (Thibault et al., 2012). Though we did not detect a significant age- or transgene-related difference in VGCC Ca2+ influx, an effect selective for L-type Ca2+ channels could be obscured by Ca2+ influx through other Ca2+ channel types.
In addition to the direct measure of Ca2+ responses, glutamatergic sEPSPs were monitored as an index of presynaptic activity. Neither mean frequency, mean amplitude, nor the sEPSP response to the RyR stimulation was significantly affected by proximity of the postsynaptic neuron to Aβ plaque. The distribution of resting sEPSP frequencies was shifted in neurons within 25 μm from Aβ plaque in slices from 3–6-month-old APP/PS1 mice, however, a similar effect was not observed in slices from 7–14-month-old mice. Cortical and hippocampal hyperactivity has been found in the vicinity of Aβ plaque in vivo in APP23×PS45 FAD transgenic mice (Busche et al., 2008) and this effect, too, appears to be reduced in 6–7-month-old mice with Aβ plaque deposits compared with younger, 1–2-month-old mice before Aβ deposition (Busche et al., 2012). Though a reduction in hyperactivity appears to contrast with the age-related progression of AD, the loss of spine synapses is prominent in AD and correlates strongly with cognitive dysfunction (Clare et al., 2010; Penzes et al., 2011; Scheff and Price, 2003; Spires-Jones and Knafo, 2012). Whether loss of synaptic input explains the age-related decrements in sEPSP and firing activity, however, is not known.
RyR activation increases sEPSP activity in APP/PS1 and other FAD transgenic mice, likely because of enhanced intraterminal endoplasmic reticulum Ca2+ release triggering spontaneous vesicle release (Chakroborty et al., 2009; Goussakov et al., 2011; Stutzmann and Mattson, 2011). After RyR activation, we observed a 2–3-fold increase in sEPSP mean frequency and a 40%–50% increase in sEPSP mean amplitude in slices from younger and older APP/PS1 mice. These responses were not significantly different in neurons near or far from Aβ plaques, suggesting that nerve terminal and somatic and dendritic RyR-mediated intracellular Ca2+ release, though upregulated in APP/PS1 mice, was not additionally altered by proximity to Aβ plaque. Taken together, these data show no profound relationship between Aβ plaque proximity and RyR-evoked Ca2+ release or VGCC Ca2+ influx responses in pyramidal neuron soma or dendrites in APP/PS1 mice. Because soluble forms of Aβ might diffuse out of the tissue during slice preparation or incubation (Waters, 2010), these studies do not exclude an acute influence of soluble Aβ, but do argue against triggering of a prolonged effect on Ca2+ responses near loci of plaque deposition. The results of this study highlight the need for broader perspectives when searching for mechanistic causes and effective therapeutic strategies in AD.
Acknowledgments
Funding sources supporting this project are NIH AG030205, and the Alzheimer’s Association.
Footnotes
Disclosure statement
J.R. is an employee of, and shareholder in, GSK.
Animals were cared for and used in accordance with protocols approved by the Rosalind Franklin University of Medicine and Science Animal Care and Use Committee.
References
- Aho L, Pikkarainen M, Hiltunen M, Leinonen V, Alafuzoff I. Immunohistochemical visualization of amyloid-β protein precursor and amyloid-β in extra- and intracellular compartments in the human brain. J Alzheimers Dis. 2010;20:1015–1028. doi: 10.3233/JAD-2010-091681. [DOI] [PubMed] [Google Scholar]
- Aisen PS, Andrieu S, Sampaio C, Carrillo M, Khachaturian ZS, Dubois B, Feldman HH, Petersen RC, Siemers E, Doody RS, Hendrix SB, Grundman M, Schneider LS, Schindler RJ, Salmon E, Potter WZ, Thomas RG, Salmon D, Donohue M, Bednar MM, Touchon J, Vellas B. Report of the task force on designing clinical trials in early (predementia) AD. Neurology. 2011;76:280–286. doi: 10.1212/WNL.0b013e318207b1b9. [DOI] [PMC free article] [PubMed] [Google Scholar]
- Arnold SE, Louneva N, Cao K, Wang LS, Han LY, Wolk DA, Negash S, Leurgans SE, Schneider JA, Buchman AS, Wilson RS, Bennett DA. Cellular, synaptic, and biochemical features of resilient cognition in Alzheimer’s disease. Neurobiol Aging. 2013;34:157–168. doi: 10.1016/j.neurobiolaging.2012.03.004. [DOI] [PMC free article] [PubMed] [Google Scholar]
- Arriagada PV, Marzloff K, Hyman BT. Distribution of Alzheimer-type pathologic changes in nondemented elderly individuals matches the pattern in Alzheimer’s disease. Neurology. 1992;42:1681–1688. doi: 10.1212/wnl.42.9.1681. [DOI] [PubMed] [Google Scholar]
- Auffret A, Mariani J, Rovira C. Age-related progressive synaptic dysfunction: the critical role of presenilin 1. Rev Neurosci. 2010;21:239–250. doi: 10.1515/revneuro.2010.21.4.239. [DOI] [PubMed] [Google Scholar]
- Benilova I, Karran E, De Strooper B. The toxic Aβ oligomer and Alzheimer’s disease: an emperor in need of clothes. Nat Neurosci. 2012;15:349–357. doi: 10.1038/nn.3028. [DOI] [PubMed] [Google Scholar]
- Berridge MJ. Calcium hypothesis of Alzheimer’s disease. Pflugers Arch. 2010;459:441–449. doi: 10.1007/s00424-009-0736-1. [DOI] [PubMed] [Google Scholar]
- Bezprozvanny I. Calcium signaling and neurodegenerative diseases. Trends Mol Med. 2009;15:89–100. doi: 10.1016/j.molmed.2009.01.001. [DOI] [PMC free article] [PubMed] [Google Scholar]
- Bodhinathan K, Kumar A, Foster TC. Redox sensitive calcium stores underlie enhanced after hyperpolarization of aged neurons: role for ryanodine receptor mediated calcium signaling. J Neurophysiol. 2010;104:2586–2593. doi: 10.1152/jn.00577.2010. [DOI] [PMC free article] [PubMed] [Google Scholar]
- Bouchard R, Pattarini R, Geiger JD. Presence and functional significance of presynaptic ryanodine receptors. Prog Neurobiol. 2003;69:391–418. doi: 10.1016/s0301-0082(03)00053-4. [DOI] [PubMed] [Google Scholar]
- Bull R, Finkelstein JP, Humeres A, Behrens MI, Hidalgo C. Effects of ATP, Mg2+, and redox agents on the Ca2+ dependence of RyR channels from rat brain cortex. Am J Physiol Cell Physiol. 2007;293:C162–C171. doi: 10.1152/ajpcell.00518.2006. [DOI] [PubMed] [Google Scholar]
- Busche MA, Chen X, Henning HA, Reichwald J, Staufenbiel M, Sakmann B, Konnerth A. Critical role of soluble amyloid-β for early hippocampal hyperactivity in a mouse model of Alzheimer’s disease. Proc Natl Acad Sci U S A. 2012;109:8740–8745. doi: 10.1073/pnas.1206171109. [DOI] [PMC free article] [PubMed] [Google Scholar]
- Busche MA, Eichhoff G, Adelsberger H, Abramowski D, Wiederhold KH, Haass C, Staufenbiel M, Konnerth A, Garaschuk O. Clusters of hyperactive neurons near amyloid plaques in a mouse model of Alzheimer’s disease. Science. 2008;321:1686–1689. doi: 10.1126/science.1162844. [DOI] [PubMed] [Google Scholar]
- Bussiere T, Bard F, Barbour R, Grajeda H, Guido T, Khan K, Schenk D, Games D, Seubert P, Buttini M. Morphological characterization of thioflavin-S-positive amyloid plaques in transgenic Alzheimer mice and effect of passive Aβ immunotherapy on their clearance. Am J Pathol. 2004;165:987–995. doi: 10.1016/s0002-9440(10)63360-3. [DOI] [PMC free article] [PubMed] [Google Scholar]
- Camandola S, Mattson MP. Aberrant subcellular neuronal calcium regulation in aging and Alzheimer’s disease. Biochim Biophys Acta. 2011;1813:965–973. doi: 10.1016/j.bbamcr.2010.10.005. [DOI] [PMC free article] [PubMed] [Google Scholar]
- Castellani RJ, Smith MA. Compounding artefacts with uncertainty, and an amyloid cascade hypothesis that is ‘too big to fail’. J Pathol. 2011;224:147–152. doi: 10.1002/path.2885. [DOI] [PubMed] [Google Scholar]
- Chakroborty S, Goussakov I, Miller MB, Stutzmann GE. Deviant ryanodine receptor-mediated calcium release resets synaptic homeostasis in presymptomatic 3xTg-AD mice. J Neurosci. 2009;29:9458–9470. doi: 10.1523/JNEUROSCI.2047-09.2009. [DOI] [PMC free article] [PubMed] [Google Scholar]
- Chakroborty S, Kim J, Schneider C, Jacobson C, Molgó J, Stutzmann GE. Early pre- and postsynaptic calcium signaling abnormalities mask underlying synaptic depression in presymptomatic Alzheimer’s disease mice. J Neurosci. 2012;32:8341–8353. doi: 10.1523/JNEUROSCI.0936-12.2012. [DOI] [PMC free article] [PubMed] [Google Scholar]
- Chakroborty S, Stutzmann GE. Early calcium dysregulation in Alzheimer’s disease: setting the stage for synaptic dysfunction. Sci China Life Sci. 2011;54:752–762. doi: 10.1007/s11427-011-4205-7. [DOI] [PubMed] [Google Scholar]
- Chasseigneaux S, Allinquant B. Functions of Aβ, sAPPα and sAPPβ: similarities and differences. J Neurochem. 2012;120(Suppl 1):99–108. doi: 10.1111/j.1471-4159.2011.07584.x. [DOI] [PubMed] [Google Scholar]
- Clare R, King VG, Wirenfeldt M, Vinters HV. Synapse loss in dementias. J Neurosci Res. 2010;88:2083–2090. doi: 10.1002/jnr.22392. [DOI] [PMC free article] [PubMed] [Google Scholar]
- Demuro A, Parker I, Stutzmann GE. Calcium signaling and amyloid toxicity in Alzheimer disease. J Biol Chem. 2010;285:12463–12468. doi: 10.1074/jbc.R109.080895. [DOI] [PMC free article] [PubMed] [Google Scholar]
- Disterhoft JF, Oh MM. Alterations in intrinsic neuronal excitability during normal aging. Aging Cell. 2007;6:327–336. doi: 10.1111/j.1474-9726.2007.00297.x. [DOI] [PubMed] [Google Scholar]
- Foskett JK. Inositol trisphosphate receptor Ca2+ release channels in neurological diseases. Pflugers Arch. 2010;460:481–494. doi: 10.1007/s00424-010-0826-0. [DOI] [PMC free article] [PubMed] [Google Scholar]
- Foster TC. Calcium homeostasis and modulation of synaptic plasticity in the aged brain. Aging Cell. 2007;6:319–325. doi: 10.1111/j.1474-9726.2007.00283.x. [DOI] [PubMed] [Google Scholar]
- Galimberti D, Scarpini E. Disease-modifying treatments for Alzheimer’s disease. Ther Adv Neurol Disord. 2011;4:203–216. doi: 10.1177/1756285611404470. [DOI] [PMC free article] [PubMed] [Google Scholar]
- Gant JC, Chen KC, Norris CM, Kadish I, Thibault O, Blalock EM, Porter NM, Landfield PW. Disrupting function of FK506-binding protein 1b/12.6 induces the Ca2+-dysregulation aging phenotype in hippocampal neurons. J Neurosci. 2011;31:1693–1703. doi: 10.1523/JNEUROSCI.4805-10.2011. [DOI] [PMC free article] [PubMed] [Google Scholar]
- Ghosh D, LeVault KR, Barnett AJ, Brewer GJ. A reversible early oxidized redox state that precedes macromolecular ROS damage in aging nontransgenic and 3xTg-AD mouse neurons. J Neurosci. 2012;32:5821–5832. doi: 10.1523/JNEUROSCI.6192-11.2012. [DOI] [PMC free article] [PubMed] [Google Scholar]
- Gibson GE, Starkov A, Blass JP, Ratan RR, Beal MF. Cause and consequence: mitochondrial dysfunction initiates and propagates neuronal dysfunction, neuronal death and behavioral abnormalities in age-associated neurodegenerative diseases. Biochim Biophys Acta. 2010;1802:122–134. doi: 10.1016/j.bbadis.2009.08.010. [DOI] [PMC free article] [PubMed] [Google Scholar]
- Goate A, Hardy J. Twenty years of Alzheimer’s disease-causing mutations. J Neurochem. 2012;120:3–8. doi: 10.1111/j.1471-4159.2011.07575.x. [DOI] [PubMed] [Google Scholar]
- Goldman WP, Price JL, Storandt M, Grant EA, McKeel DW, Jr, Rubin EH, Morris JC. Absence of cognitive impairment or decline in preclinical Alzheimer’s disease. Neurology. 2001;56:361–367. doi: 10.1212/wnl.56.3.361. [DOI] [PubMed] [Google Scholar]
- Goussakov I, Chakroborty S, Stutzmann GE. Generation of dendritic Ca2+ oscillations as a consequence of altered ryanodine receptor function in AD neurons. Channels (Austin) 2011;5:9–13. doi: 10.4161/chan.5.1.14124. [DOI] [PubMed] [Google Scholar]
- Goussakov I, Miller MB, Stutzmann GE. NMDA-mediated Ca2+ influx drives aberrant ryanodine receptor activation in dendrites of young Alzheimer’s disease mice. J Neurosci. 2010;30:12128–12137. doi: 10.1523/JNEUROSCI.2474-10.2010. [DOI] [PMC free article] [PubMed] [Google Scholar]
- Guo Q, Wang Z, Li H, Wiese M, Zheng H. APP physiological and patho-physiological functions: insights from animal models. Cell Res. 2012;22:78–89. doi: 10.1038/cr.2011.116. [DOI] [PMC free article] [PubMed] [Google Scholar]
- Hidalgo C, Donoso P, Carrasco MA. The ryanodine receptors Ca2+ release channels: cellular redox sensors? IUBMB Life. 2005;57:315–322. doi: 10.1080/15216540500092328. [DOI] [PubMed] [Google Scholar]
- Hermes M, Eichhoff G, Garaschuk O. Intracellular calcium signalling in Alzheimer’s disease. J Cell Mol Med. 2010;14:30–41. doi: 10.1111/j.1582-4934.2009.00976.x. [DOI] [PMC free article] [PubMed] [Google Scholar]
- Herrup K. Reimagining Alzheimer’s disease – an age-based hypothesis. J Neurosci. 2010;30:16755–16762. doi: 10.1523/JNEUROSCI.4521-10.2010. [DOI] [PMC free article] [PubMed] [Google Scholar]
- Holtzman DM, Morris JC, Goate AM. Alzheimer’s disease: the challenge of the second century. Sci Transl Med. 2011;3:77sr1. doi: 10.1126/scitranslmed.3002369. [DOI] [PMC free article] [PubMed] [Google Scholar]
- Howlett DR, Richardson JC, Austin A, Parsons AA, Bate ST, Davies DC, Gonzalez MI. Cognitive correlates of Aβ deposition in male and female mice bearing amyloid precursor protein and presenilin-1 mutant transgenes. Brain Res. 2004;1017:130–136. doi: 10.1016/j.brainres.2004.05.029. [DOI] [PubMed] [Google Scholar]
- Itkin A, Dupres V, Dufrêne YF, Bechinger B, Ruysschaert JM, Raussens V. Calcium ions promote formation of amyloid β-peptide(1-40) oligomers causally implicated in neuronal toxicity of Alzheimer’s Disease. PLoS One. 2011;6:e18250. doi: 10.1371/journal.pone.0018250. [DOI] [PMC free article] [PubMed] [Google Scholar]
- Karran E, Mercken M, De Strooper B. The amyloid cascade hypothesis for Alzheimer’s disease: an appraisal for the development of therapeutics. Nat Rev Drug Discov. 2011;10:698–712. doi: 10.1038/nrd3505. [DOI] [PubMed] [Google Scholar]
- Kazee AM, Johnson EM. Alzheimer’s Disease pathology in non-demented elderly. J Alzheimers Dis. 1998;1:81–89. doi: 10.3233/jad-1998-1202. [DOI] [PubMed] [Google Scholar]
- Kuchibhotla KV, Goldman ST, Lattarulo CR, Wu HY, Hyman BT, Bacskai BJ. Aβ plaques lead to aberrant regulation of calcium homeostasis In vivo resulting in structural and functional disruption of neuronal networks. Neuron. 2008;59:214–225. doi: 10.1016/j.neuron.2008.06.008. [DOI] [PMC free article] [PubMed] [Google Scholar]
- Kuchibhotla KV, Lattarulo CR, Hyman BT, Bacskai BJ. Synchronous hyperactivity and intercellular calcium waves in astrocytes in Alzheimer mice. Science. 2009;323:1211–1215. doi: 10.1126/science.1169096. [DOI] [PMC free article] [PubMed] [Google Scholar]
- Kumar A, Bodhinathan K, Foster TC. Susceptibility to calcium dysregulation during brain aging. Front Aging Neurosci. 2009;1:2. doi: 10.3389/neuro.24.002.2009. [DOI] [PMC free article] [PubMed] [Google Scholar]
- Larson ME, Lesne SE. Soluble Aβ oligomer production and toxicity. J Neurochem. 2012;120(Suppl 1):125–139. doi: 10.1111/j.1471-4159.2011.07478.x. [DOI] [PMC free article] [PubMed] [Google Scholar]
- Lazarov O, Peterson LD, Peterson DA, Sisodia SS. Expression of a familial Alzheimer’s disease-linked presenilin-1 variant enhances perforant pathway lesion-induced neuronal loss in the entorhinal cortex. J Neurosci. 2006;26:429–434. doi: 10.1523/JNEUROSCI.3961-05.2006. [DOI] [PMC free article] [PubMed] [Google Scholar]
- Minkeviciene R, Banerjee P, Tanila H. Memantine improves spatial learning in a transgenic mouse model of Alzheimer’s disease. J Pharmacol Exp Ther. 2004;311:677–682. doi: 10.1124/jpet.104.071027. [DOI] [PubMed] [Google Scholar]
- Muller M, Cardenas C, Mei L, Cheung KH, Foskett JK. Constitutive cAMP response element binding protein (CREB) activation by Alzheimer’s Disease presenilin-driven inositol trisphosphate receptor (InsP3R) Ca2+ signaling. Proc Natl Acad Sci U S A. 2011a;108:13293–13298. doi: 10.1073/pnas.1109297108. [DOI] [PMC free article] [PubMed] [Google Scholar]
- Muller M, Cheung KH, Foskett JK. Enhanced ROS generation mediated by Alzheimer’s Disease presenilin regulation of InsP3R Ca2+ signaling. Antioxid Redox Signal. 2011b;14:1225–1235. doi: 10.1089/ars.2010.3421. [DOI] [PMC free article] [PubMed] [Google Scholar]
- Oh MM, Oliveira FA, Disterhoft JF. Learning and aging related changes in intrinsic neuronal excitability. Front Aging Neurosci. 2010;3:2. doi: 10.3389/neuro.24.002.2010. [DOI] [PMC free article] [PubMed] [Google Scholar]
- Palop J, Mucke L. Synaptic depression and aberrant excitatory network activity in Alzheimer’s disease: two faces of the same coin? Neuromolecular Med. 2010;12:48–55. doi: 10.1007/s12017-009-8097-7. [DOI] [PMC free article] [PubMed] [Google Scholar]
- Penzes P, Cahill ME, Jones KA, VanLeeuwen JE, Woolfrey KM. Dendritic spine pathology in neuropsychiatric disorders. Nat Neurosci. 2011;14:285–293. doi: 10.1038/nn.2741. [DOI] [PMC free article] [PubMed] [Google Scholar]
- Querfurth HW, LaFerla FM. Alzheimer’s disease. N Engl J Med. 2010;362:329–344. doi: 10.1056/NEJMra0909142. [DOI] [PubMed] [Google Scholar]
- Sadowski M, Pankiewicz J, Scholtzova H, Ji Y, Quartermain D, Jensen CH, Duff K, Nixon RA, Gruen RJ, Wisniewski T. Amyloid-β deposition is associated with decreased hippocampal glucose metabolism and spatial memory impairment in APP/PS1 mice. J Neuropathol Exp Neurol. 2004;63:418–428. doi: 10.1093/jnen/63.5.418. [DOI] [PubMed] [Google Scholar]
- Scheff SW, Price DA. Synaptic pathology in Alzheimer’s disease: a review of ultrastructural studies. Neurobiol Aging. 2003;24:1029–1046. doi: 10.1016/j.neurobiolaging.2003.08.002. [DOI] [PubMed] [Google Scholar]
- Scheff SW, Price DA. Alzheimer’s disease-related alterations in synaptic density: neocortex and hippocampus. J Alzheimers Dis. 2006;9:101–115. doi: 10.3233/jad-2006-9s312. [DOI] [PubMed] [Google Scholar]
- Schmitt FA, Davis DG, Wekstein DR, Smith CD, Ashford JW, Markesbery WR. “Preclinical” AD revisited: neuropathology of cognitively normal older adults. Neurology. 2000;55:370–376. doi: 10.1212/wnl.55.3.370. [DOI] [PubMed] [Google Scholar]
- Selkoe DJ. Physiological production of the β-amyloid protein and the mechanism of Alzheimer’s disease. Trends Neurosci. 1993;16:403–409. doi: 10.1016/0166-2236(93)90008-a. [DOI] [PubMed] [Google Scholar]
- Selkoe DJ. Alzheimer’s disease is a synaptic failure. Science. 2002;298:789–791. doi: 10.1126/science.1074069. [DOI] [PubMed] [Google Scholar]
- Selkoe DJ. Alzheimer’s disease. Cold Spring Harb Perspect Biol. 2011a;3:a004457. doi: 10.1101/cshperspect.a004457. [DOI] [PMC free article] [PubMed] [Google Scholar]
- Selkoe DJ. Resolving controversies on the path to Alzheimer’s therapeutics. Nat Med. 2011b;17:1060–1065. doi: 10.1038/nm.2460. [DOI] [PubMed] [Google Scholar]
- Shilling D, Mak DO, Kang DE, Foskett JK. Lack of evidence for presenilins as endoplasmic reticulum Ca2+ leak channels. J Biol Chem. 2012;287:10933–10944. doi: 10.1074/jbc.M111.300491. [DOI] [PMC free article] [PubMed] [Google Scholar]
- Spires-Jones T, Knafo S. Spines, plasticity, and cognition in Alzheimer’s model mice. Neural Plast. 2012;2012:319836. doi: 10.1155/2012/319836. [DOI] [PMC free article] [PubMed] [Google Scholar]
- Stone JG, Casadesus G, Gustaw-Rothenberg K, Siedlak SL, Wang X, Zhu X, Perry G, Castellani RJ, Smith MA. Frontiers in Alzheimer’s disease therapeutics. Ther Adv Chronic Dis. 2011;2:9–23. doi: 10.1177/2040622310382817. [DOI] [PMC free article] [PubMed] [Google Scholar]
- Stutzmann GE. The pathogenesis of Alzheimers disease: is it a lifelong “calciumopathy”? Neuroscientist. 2007;13:546–559. doi: 10.1177/1073858407299730. [DOI] [PubMed] [Google Scholar]
- Stutzmann GE, Mattson MP. Endoplasmic reticulum Ca2+ handling in excitable cells in health and disease. Pharmacol Rev. 2011;63:700–727. doi: 10.1124/pr.110.003814. [DOI] [PMC free article] [PubMed] [Google Scholar]
- Stutzmann GE, Parker I. Dynamic multiphoton imaging: a live view from cells to systems. Physiology (Bethesda) 2005;20:15–21. doi: 10.1152/physiol.00028.2004. [DOI] [PubMed] [Google Scholar]
- Stutzmann GE, Smith I, Caccamo A, Oddo S, LaFerla FM, Parker I. Enhanced ryanodine receptor recruitment contributes to Ca2+ disruptions in young, adult, and aged Alzheimer’s disease mice. J Neurosci. 2006;26:5180–5189. doi: 10.1523/JNEUROSCI.0739-06.2006. [DOI] [PMC free article] [PubMed] [Google Scholar]
- Supnet C, Bezprozvanny I. Presenilins function in ER calcium leak and Alzheimer’s disease pathogenesis. Cell Calcium. 2011;50:303–309. doi: 10.1016/j.ceca.2011.05.013. [DOI] [PMC free article] [PubMed] [Google Scholar]
- Terry RD, Masliah E, Salmon DP, Butters N, DeTeresa R, Hill R, Hansen LA, Katzman R. Physical basis of cognitive alterations in Alzheimer’s disease: synapse loss is the major correlate of cognitive impairment. Ann Neurol. 1991;30:572–580. doi: 10.1002/ana.410300410. [DOI] [PubMed] [Google Scholar]
- Thibault O, Gant JC, Landfield PW. Expansion of the calcium hypothesis of brain aging and Alzheimer’s disease: minding the store. Aging Cell. 2007;6:307–317. doi: 10.1111/j.1474-9726.2007.00295.x. [DOI] [PMC free article] [PubMed] [Google Scholar]
- Thibault O, Pancani T, Landfield PW, Norris CM. Reduction in neuronal L-type calcium channel activity in a double knock-in mouse model of Alzheimer’s disease. Biochim Biophys Acta. 2012;1822:546–549. doi: 10.1016/j.bbadis.2012.01.004. [DOI] [PMC free article] [PubMed] [Google Scholar]
- Waters J. The concentration of soluble extracellular amyloid-β protein in acute brain slices from CRND8 mice. PLoS One. 2010;5:e15709. doi: 10.1371/journal.pone.0015709. [DOI] [PMC free article] [PubMed] [Google Scholar]
- Wykes R, Kalmbach A, Eliava M, Waters J. Changes in the physiology of CA1 hippocampal pyramidal neurons in preplaque CRND8 mice. Neurobiol Aging. 2012;33:1609–1623. doi: 10.1016/j.neurobiolaging.2011.05.001. [DOI] [PMC free article] [PubMed] [Google Scholar]
- Zhang H, Ma Q, Zhang YW, Xu H. Proteolytic processing of Alzheimer’s β-amyloid precursor protein. J Neurochem. 2012;120(Suppl 1):9–21. doi: 10.1111/j.1471-4159.2011.07519.x. [DOI] [PMC free article] [PubMed] [Google Scholar]