

Abstract
Purpose
To describe and characterize a new approach to first-pass myocardial perfusion utilizing balanced steady-state free precession acquisition without the use of saturation recovery or other magnetization preparation.
Theory
The balanced steady-state free precession sequence is inherently sensitive to contrast agent enhancement of the myocardium. This sensitivity can be used to advantage in first-pass myocardial perfusion imaging by eliminating the need for magnetization preparation.
Methods
Bloch equation simulations, phantom experiments, and in vivo 2D imaging studies were run comparing the proposed technique with three other methods: saturation recovery spoiled gradient echo, saturation recovery steady-state free precession, and steady-state spoiled gradient echo without magnetization preparation. Additionally, an acquisition-reconstruction strategy for 3D perfusion imaging is proposed and initial experience with this approach is demonstrated in healthy subjects and one patient.
Results
Phantom experiments verified simulation results showing the sensitivity of the balanced steady-state free precession sequence to contrast agent enhancement in solid tissue is similar to that of magnetization-prepared acquisitions. Images acquired in normal volunteers showed the proposed technique provided superior signal and signal-to-noise ratio compared with all other sequences at baseline as well as post-contrast.
Conclusion
A new approach to first-pass myocardial perfusion is presented that obviates the need for magnetization preparation and provides high signal-to-noise ratio.
Keywords: cardiac MRI, first-pass myocardial perfusion, steady-state
Introduction
Assessment of myocardial perfusion is important in the diagnosis and evaluation of ischemic heart disease. In current clinical practice, single photon emission tomography (SPECT) is most often used to non-invasively assess perfusion; however, SPECT uses radioactive tracers and has significant limitations such as poor spatial resolution and soft tissue attenuation artifacts.
In 1989, Miller and colleagues first demonstrated the detection of myocardial perfusion changes using spin echo MRI with a bolus plus infusion of gadolinium (Gd) contrast agent (1). Thereafter, in 1990, Atkinson et al. demonstrated a more practical approach for myocardial perfusion imaging using an ultrafast MRI acquisition, relying on the T1 shortening that occurs during the first-pass wash-in of Gd contrast agent through the myocardium (2); in that technique, the T1 sensitivity of a fast spoiled gradient echo (SPGR) sequence was enhanced with an inversion recovery (IR) preparation. Sensitivity of IR to heart-rate variations eventually led to its replacement by saturation recovery (SR) preparation in later studies, albeit with a contrast-to-noise ratio (CNR) penalty (3). While the SR preparation is still most widely used, first-pass cardiovascular magnetic resonance (CMR) perfusion has also been demonstrated using an SPGR sequence with a magnetization driven steady-state preparation (4), and more recently with the continuous maintenance of steady-state (5). Since its inception, CMR perfusion techniques have evolved and benefitted from improved scanner hardware, advanced pulse sequences, faster imaging techniques, new contrast agents, and analysis methods (6). The advent of ultrafast imaging strategies that combine techniques such as parallel imaging, non-Cartesian trajectories, spatio-temporal undersampling, and compressed sensing have dramatically increased the speed of image data readout, to the point that true three-dimensional acquisition may now be feasible (7–9).
Despite continuous improvements, myocardial first-pass perfusion imaging has not yet been widely adopted as a routine clinical tool because of several unsolved problems, the most notorious of them being the dark rim artifact (DRA). This artifact appears as a transient dark rim in the subendocardium (6) during the first-pass kinetics, thus mimicking a region of hypoperfusion. Several factors have been shown to contribute to DRA including Gibbs ringing (10), cardiac motion (11), low spatial resolution and filtering effects (3). Besides DRA, other limitations include poor CNR, inadequate spatial coverage and resolution, and insufficient contrast between normal and ischemic myocardium. Of these, poor CNR can be attributed in part to the use of an SR preparation, whereas the inefficiency introduced by the SR delay time is at least partially responsible for others. In addition to these limitations, quantitative analysis of CMR perfusion studies can be problematic and time consuming, with one study reporting ~30 minutes analysis time per patient (12).
The objective of this work is to present a new approach to myocardial first-pass perfusion imaging that potentially addresses some of the limitations of current methods. This technique is based on the balanced steady-state free precession (bSSFP) sequence, and is called steady state first-pass perfusion (SSFPP). The underlying theory of SSFPP is first discussed, followed by a proof-of-concept of this new technique using (i) Bloch equation simulations (ii) phantom and (iii) in vivo 2D imaging studies comparing SSFPP with 3 other techniques – SR-SPGR, SR-SSFP, and SPGR. Finally, an acquisition-reconstruction strategy for 3D perfusion imaging is proposed, followed by the initial experience in healthy subjects and one patient.
Theory
As the name implies, SSFPP uses the steady-state signal characteristics of bSSFP instead of the traditional SR preparation pulse for first-pass perfusion imaging. The bSSFP sequence has emerged as one of the most important sequences in CMR due primarily to its speed, high SNR, and high contrast between myocardium and blood; these characteristics have rendered it the gold-standard technique for the assessment of systolic function. A particularly interesting feature is the dependence of steady-state contrast on the ratio of relaxation times . Given that T1 & ≥ T2, the maximum value for this ratio is 1, which is the case only for pure water. The dependence of contrast on has unique implications in the presence of Gd contrast agents which simultaneously reduce both T1 and T2. Scheffler and Lehnhardt (13) showed water-filled bottles doped with different concentrations of a Gd-based contrast agent exhibit nearly identical bSSFP signal intensities. To better understand this signal behavior, consider the relation between tissue relaxation times and gadolinium concentration [Gd] (14):
| [1] |
| [2] |
where T1N and T2N are the native (pre-contrast) relaxation times, T1C and T2C are the tissue relaxation times in the presence of Gd contrast agent, r1 and r2 are the longitudinal and transverse relaxivities (in mM−1sec−1) of the Gd chelate. The r1 and r2 values of three common contrast agents are listed in Table 1 (15). Note that r1 and r2 are roughly equivalent for all agents, although the ratio r1 / r2 is somewhat lower for Multihance.
Table 1.
r1 and r2 relaxivities in human blood plasma (at 37°C) for three common MRI contrast agents at 1.5T. Reference (15).
| Generic name | Product name | r1 (mM−1sec−1) | r2 (mM−1sec−1) |
|---|---|---|---|
|
| |||
| Gadopentetate | Magnevist | 3.9 | 5.3 |
| Gadobutrol | Gadovist | 4.7 | 6.8 |
| Gadobenate | MultiHance | 8.1 | 18.7 |
For water or saline, T1N and T2N are both relatively high, making the contribution from Gd the dominant factor in post-contrast relaxation times; therefore the ratio . Given that r1 ≈ r2 for most Gd-based agents, water-filled bottles doped with different concentrations of Gd exhibit nearly identical b-SSFP signal intensities, as was demonstrated by Scheffler and Lehnhardt (13).
The signal for blood, with long native relaxation times (T1 ≈ 1200 ms and T2 ≈ 250 ms at 1.5T (16,17)), would be expected to increase slightly for lower values of [Gd] while at higher [Gd] T2C would be dominated by the presence of contrast agent; at that point , and the signal intensity would remain relatively constant for increasing values of [Gd]. It must be noted that the LV blood signal in bSSFP can be modulated by inflow effects (18). Inflowing blood may not reach steady state, although the decay towards steady-state, which depends on T1 and T2, is much faster in the presence of contrast agent. The relative influences of these effects on blood signal in vivo are difficult to model in simulation and to control in human experiments. We empirically show in in vivo studies that the net effect is that the blood signal remains nearly constant before and during first-pass contrast agent wash-in.
The situation is expected to be different, however, for a tissue such as myocardium where T2N is much smaller than T1N (T1 ≈ 900 ms; T2 ≈ 50 ms), leading to a much lower relative change in T2 with changing [Gd] compared with that of T1. Thus, the ratio, and consequently the steady-state signal, is anticipated to be dependent on [Gd] in myocardium. This mechanism offers the potential opportunity to image myocardial perfusion using the steady-state characteristics of bSSFP without the need for any additional magnetization preparation pulses, thereby taking advantage of the high SNR efficiency of bSSFP.
The proposed SSFPP acquisition scheme is depicted in Figure 1. The sequence consists of a linear ramped flip angle catalyzation to expedite the approach to steady-state, followed by maintenance of the steady-state by the continuous application of the bSSFP kernel (Figure 1, inset) throughout the scan. The signal acquisition is gated to mid-diastole, the only time in each cardiac cycle when the analog-to-digital converter (ADC) is turned on and data are acquired. The acquired images thus possess the steady-state contrast of bSSFP. It is important to note that the necessity to maintain magnetization in steady-state by continuous application of bSSFP precludes sequential multi-slice imaging. Consequently, either single-slice or single-slab imaging with 3D encoding must be employed; the former was used to demonstrate the signal behavior, whereas one approach to 3D encoding was implemented and tested to demonstrate the clinical potential of this technique.
Figure 1.

Acquisition scheme for SSFPP. The magnetization is maintained in steady-state by continuously applying the SSFP kernel (inset). The analog-to-digital converter (ADC) is turned ON in mid-diastole for signal read-out; at all other times, it is turned off.
Methods
Simulations and phantom study
Bloch equation simulations and phantom studies were performed to investigate the bSSFP steady-state signal dependency on [Gd] for two phantom materials having different native (pre-contrast) relaxation times. The first phantom consisted of distilled water, representing the case where both native relaxation times are high (T1 ≈ T2 > 2500 ms at room temperature), whereas the second phantom was made of nickel-doped agarose gel, with native relaxation times approximating those of normal myocardium (T1 ≈ 900 ms; T2 ≈ 50 ms). Gd-DTPA (Magnevist; Schering, Berlin, Germany) was then added to both phantom materials at concentrations expected in the myocardium during first-pass perfusion. In the gel phantom, Ni can potentially displace Gd from Gd-DTPA, resulting in different relaxivities than would be explained by Eqs. 1 and 2; to prevent this, (Ni-DTPA + Agarose) was used as the baseline material. The exact procedure for constructing these phantoms was described by Tofts et al. (19). The relaxation times of the phantoms thus created were calibrated using inversion recovery and spin echo sequences (TR = 10 s; acquisition time per image ~19 minutes). A schematic of select phantom vials, along with [Gd], relaxation times, and T1/T2 ratio, is depicted in Figure 2. Note, in particular, that the T1/T2 ratio changes with [Gd] in gel phantoms, whereas it remains nearly constant in the liquid phantom.
Figure 2.

Schematic of select phantom vials used in this study. Each circle represents a vial. Top row shows gel phantoms, whereas the bottom row shows liquid (water) phantoms. The [Gd], T1, T2, and ratio of T1/T2 is given for each phantom.
Simulations and imaging experiments were performed to study the signal in these two sets of phantoms with four different pulse sequences: saturation recover prepared SR-SPGR and SR-SSFP; and steady-state sequences SPGR and SSFPP. Of these, SR-SPGR and SR-SSFP being commonly used in CMR perfusion studies, were run with recommended imaging parameters (3). Imaging parameters for SPGR and SSFPP were matched with those of SR-SPGR and SR-SSFP respectively. Table 2 lists the imaging parameters that were set as close as possible to enable a fair comparison. A single slice was imaged multiple times (n = 10) with each sequence using simulated ECG-gating, and the last image in each case was used to report phantom signals; this was done to ensure that SPGR and SSFPP reached their respective steady-states. Parallel imaging was purposefully not used in order to simplify SNR and CNR measurements.
Table 2. Imaging parameters for phantom & simulation experiments and human studies comparing 4 sequences: SR-TrueFISP, SR-TurboFLASH, SSFPP, SPGR.
The imaging parameters for SR-TrueFISP and SR-TurboFLASH were suggested in a recent review by Kellman and Arai (JCMR: 2007; 9(3):525–537). Parallel imaging was avoided to facilitate SNR computations. For fair comparison, the other parameters were matched as close as possible among the 4 sequences.
| Parameter name | SR-TrueFISP | SR-TurboFLASH | SSFPP | SPGR |
|---|---|---|---|---|
| Image Matrix | 80 × 128 | 80 × 128 | 80 × 128 | 80 × 128 |
| Resolution (phantom study) mm3 | 1.9 × 2.3 × 10 | 1.9 × 2.3 × 10 | 1.9 × 2.3 × 10 | 1.9 × 2.3 × 10 |
| Resolution (human study) mm3 | 2.8 × 3 × 8 | 2.8 × 3 × 8 | 3.1 × 3.4 × 8 | 3 × 3.2 × 8 |
| Parallel acquisition | None | None | None | None |
| Flip angle (degree) | 50 | 12 | 50 | 12 |
| Inversion time (ms) | 145 | 145 | NA | NA |
| Delay time (ms) | 53 | 53 | NA | NA |
| TR (ms) | 2.3 | 2.3 | 2.3 | 2.3 |
| TE (ms) | 1.16 | 1.28 | 1.16 | 1.28 |
| Readout bandwidth (Hz/Pixel) | 1395 | 781 | 1395 | 781 |
| Readout duration (ms) | 184 | 184 | 184 | 184 |
| Trigger delay (ms) | 200 | 200 | 200 | 200 |
In simulation studies Eqs. 1 and 2 were used to compute relaxation times at different concentrations of Gd-DTPA (range: 0 to 2 mM). Iterative Bloch equations were used to model the signal in SR-SSFP and SR-SPGR, whereas steady-state signal equations were used for SPGR and SSFPP (20). Other parameters in simulations were matched with those in phantom experiments.
In vivo study
A total of 11 healthy volunteers and 1 patient participated in this study. Of these, 4 subjects were scanned using 2D sequences for in vivo confirmation of the phantom and simulation results. The remaining seven subjects were scanned with the 3D implementation of SSFPP described later. All subjects voluntarily consented to participate in this study that was approved by the institution’s ethics committee. A single dose (0.1 mmol/kg body weight) of Gd-BOPTA (Multihance; Bracco-Byk Gulden, Konstanz, Germany) was administered intravenously at 3 ml/s in each subject. The volunteers were instructed to hold their breath for as long as possible, and continue thereafter with light and shallow breathing until the end of the scan.
Part 1: Proof of concept of SSFPP in 2D imaging
To test the applicability of the phantom and simulation results to in vivo imaging, 4 subjects were scanned, each with one of the 4 sequences used in the phantom experiment. Sequence parameters were matched between phantom and in vivo studies (except spatial resolution; see Table 1). A single mid-ventricular short axis (SAX) slice was acquired during systole in each case.
The acquired images were registered to correct for motion caused by diaphragm drift or respiration (21). Thereafter, a region of interest (ROI) was drawn in the septum to compute the signal changes across the dynamic frames. For noise calculation, a region of similar size was drawn in the background, and the standard deviation of this region was used as noise; the absence of parallel imaging reconstruction justifies this approach. The following parameters were computed and plotted across the dynamic frames:
Signal intensity in arbitrary units (a.u.) for myocardium and LV blood pool.
Signal to noise ratio (SNR)
Signal intensity adjusted for voxel size and bandwidth (a.u.)
CNR, as defined by the relation: CNR = SNR[i] – SNRbaseline, where SNR[i] is the SNR of ith dynamic frame, and SNRbaseline is the SNR of baseline frame (22,23).
The calculation of signal intensity and noise was done using ImageJ software (National Institutes of Health, Bethesda, MD).
Part 2: Initial experience with 3D imaging
As mentioned earlier, maintenance of steady-state by continuous application of the bSSFP kernel precludes sequential multi-slice imaging, limiting the options for image acquisition to either single-slice or single-slab with 3D encoding. Fortuitously, the use of a 3D slab covering all of the LV myocardium should make the approach robust against perturbation of the steady-state due to through-plane motion. To achieve the required acceleration to reconstruct a 3D volume for every cardiac cycle, Time Resolved Imaging with Stochastic Projections (TWIST) (24) was combined with GRAPPA, as depicted in Figure 3.
Figure 3.

Strategy for three-dimensional acquisition using SSFPP. Magnetization is maintained in steady-state throughout. K-space acquisition scheme combines TWIST and GRAPPA to increase efficiency.
To achieve a reasonable slab profile, the RF pulse was optimized empirically; the selected pulse had duration of 1 ms and time-bandwidth product of 10. In addition, a slab oversampling of 33% was used. The maximum flip angle allowed by transmitter voltage and SAR limits was used. Other sequence parameters are listed in Table 3.
Table 3.
Imaging parameters for 3D SSFPP using TWIST and GRAPPA
| Parameter name | Value |
|---|---|
| Size of Region A | 4% |
| Undersampling rate for region B | 33%. |
| RF pulse duration | 1 ms |
| RF time-bandwidth | 10 |
| product | |
| TR | ~2.7 ms |
| TE | 1.04 ms |
| Asymmetric echo | ON |
| In-plane FOV | ~350 × ~280 |
| # of slices | 6, with 33% oversampling |
| resolution | ~2.2 × 2.8 × 8 mm3 |
| Acquired matrix | 160 × 103 × 8 |
| Bandwidth | ~1200 Hz/Pixel |
| Parallel imaging | Rate 3 GRAPPA, with 24 integrated reference lines; only in PE direction |
| Acquisition window | ~300–380 ms |
| Flip angle | 34–40 degrees |
| Field strength | 1.5 T |
| Total acquisition time | 40–50 heart beats |
| Partial Fourier | 7/8 in both directions. Used only on subjects with high heart rates. |
| Trigger Delay | ~300–550 ms; derived from a cine image. |
7 healthy subjects and one patient with non-ischemic cardiomyopathy (myocarditis) participated in this study.
Post-processing and Image analysis
Three-dimensional non-rigid registration was used to correct for motion between heartbeats (25,26). Thereafter, automatic myocardial contours were drawn in a baseline frame and these contours were copied to the other motion-corrected images in the frames spanning the first-pass of contrast agent through the myocardium.
To improve visualization of contrast agent wash-in kinetics in the myocardium, dynamic contrast enhancement ratio (CER) images were generated in which each pixel represents the percent enhancement over baseline (27):
| (3) |
where CER(i) is the contrast enhancement ratio of a pixel in the ith dynamic image, SI(i) the signal intensity of a pixel in ith dynamic image, and SI(baseline) is pixel intensity at baseline (pre-contrast).
Results
Simulations and phantom studies
Figure 4 shows the phantom images from all 4 sequences, whereas Figure 5 shows the absolute and differential signal as a function of [Gd] for the simulation and phantom studies. Note in Figure 4 that the SSFPP signal exhibited different behavior in gel and liquid phantoms due to its dependence on the ratio of T2 and T1 rather than T1 alone; specifically, the signal in liquid phantoms was nearly identical for different [Gd], whereas the signal in gel phantoms increased with [Gd]. The other sequences, however, showed similar behavior between gel and liquid phantoms due to their sensitivity predominantly to T1 rather than the ratio T2/T1, i.e. the signal in both sets of phantoms increased with [Gd]. Figure 5 shows that the baseline (pre-contrast) signal for SSFPP was higher than for any other sequence, and so was the rate of change of signal with respect to [Gd]. The former could be attributed to the absence of SR preparation that is designed to suppress signal, whereas the latter indicates increased sensitivity at lower [Gd]. At lower concentrations, the SSFPP signal varied approximately linearly with [Gd], however, both simulation and phantom results show that the relationship between signal and [Gd] is more non-linear for SSFPP than for the other three sequences over the entire range of [Gd].
Figure 4.
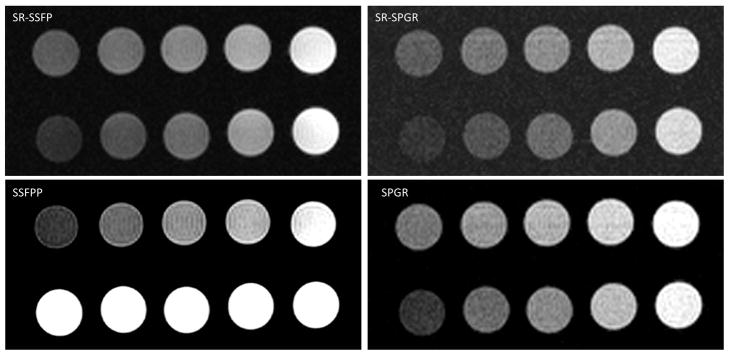
Imaging results for the two sets of phantoms depicted in Figure 2 shown for all sequences. Note for SSFPP that the signal increases with [Gd] in row 1 (gel), whereas it remains constant in row 2 (liquid). This is due to the contrast dependency in SSFPP on the ratio of T2 to T1. The other sequences demonstrate T1 weighting in both gel and liquid phantoms.
Figure 5.

Signal behavior as a function of [Gd] shown as absolute (graphs on the left) and difference from baseline (graphs on the right) for all four sequences. Simulation (top row) and phantom experiments (bottom row) show substantially similar results. [Color figure can be viewed in the online issue, which is available at wileyonlinelibrary.com]
In vivo: Proof-of-concept of SSFPP in 2D imaging
Pre-contrast (baseline) and peak-contrast images during first-pass for all 4 sequences are shown in Figure 6. Note the low SNR of the baseline images with SR-SSFP, SR-SPGR, and SPGR sequences, especially the two sequences with SR preparation. SSFPP, on the other hand, gave a very high signal in the baseline image. In fact, the contrast in this image is expected to be identical to that of a standard bSSFP cine image (not shown). Note also the step in signal change between myocardium and LV blood pool, which is decreased for SSFPP relative to SR prepared sequences; this step size is believed to be partly responsible for DRA.
Figure 6.

In vivo comparison of all four sequences. (a) Images acquired at baseline (pre-contrast) and at peak signal enhancement. (b) Myocardial signal intensities (septal ROI), and (c) LV blood pool signal intensities plotted for each frame. Note in particular the high baseline signal and LV-myocardium contrast in SSFPP, resembling that of cine images. Note also the near constancy of LV blood pool signal with SSFPP. [Color figure can be viewed in the online issue, which is available at wileyonlinelibrary.com]
The dynamic myocardial signal characteristics in SSFPP were similar to those of the other sequences, with a notable increase in baseline signal (Figure 6B). LV blood pool, on the other hand, did not enhance in SSFPP whereas it did in the other sequences (Figure 6C). The near constancy of LV blood pool signal with SSFPP is in agreement with the effect seen with SSFPP in water phantoms doped with different concentrations of Gd (Figure 4).
Figure 7 shows a comparison of signal intensities adjusted for voxel size and bandwidth, SNR and CNR among the 4 sequences. Note that SSFPP is superior in SI and SNR compared with all other sequences at baseline as well as post-contrast, whereas both SSFPP and SR-SSFP have nearly equal CNR, which is higher than that in the SPGR-based sequences.
Figure 7.

Comparison of signal adjusted for voxel-size and receiver bandwidth (a), SNR (b) and CNR relative to baseline (c) for the four sequences. Note that SSFPP gives the highest signal and SNR across all frames, and CNR is roughly equivalent to SR-SSFP. Overall, the nature of dynamic contrast enhancement of SSFPP is similar to the other three sequences, whereas signal and SNR are higher. [Color figure can be viewed in the online issue, which is available at wileyonlinelibrary.com]
In vivo: Initial experience with 3D imaging
The TWIST acquisition strategy utilized a temporal footprint of 3 heart-beats, along with a relatively small region A, i.e., the central k-space region unique to each reconstructed frame. These factors rendered the technique sensitive to respiratory motion, resulting in non-diagnostic images in 2 volunteers who could not breath-hold sufficiently long to capture first-pass dynamics. In the remaining 5 volunteers, no sub-endocardial DRA was observed during first-pass wash-in kinetics, and the maximum CER in healthy subjects varied between 120–160%. Figure 8 shows representative original and CER images from a healthy subject. Note that the insensitivity of blood signal to [Gd] results in suppression of the blood pool in the CER image.
Figure 8.
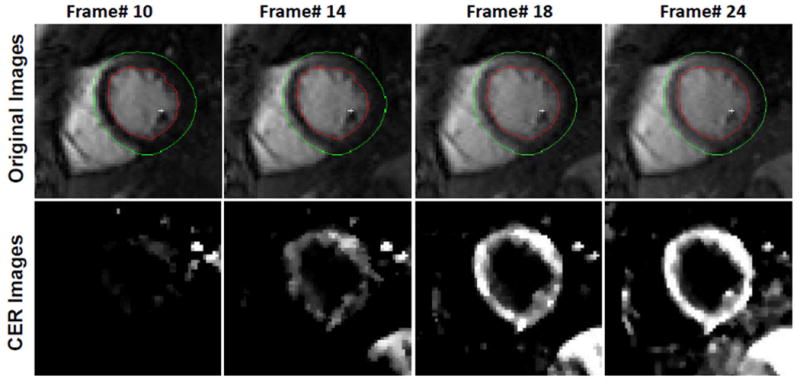
Select myocardial frames acquired during first-pass enhancement (top row) and their corresponding pixel-wise contrast enhancement ratio (CER) maps (bottom row). Note that the SNR and CNR of original frames permits automatic contouring that, along with registration, can facilitate image analysis. In this case, the contours were drawn automatically in the first frame, and then automatically generated on other frames. Also note that blood pool signal remains almost constant with changing [Gd] and is therefore suppressed in the CER map. [Color figure can be viewed in the online issue, which is available at wileyonlinelibrary.com]
Fig 9A depicts a late gadolinium enhanced (LGE) image from the patient, whereas Figure 9B shows the raw and CER images from the same patient during first-pass dynamics. Time intensity curves from the CER images for the pathologic region (as defined by the bright region in LGE image) and remote regions are shown in Fig 9C. Note the difference in curves between pathologic myocardium and normal myocardium.
Figure 9.

Images from single patient with diagnosed cardiomyopathy (myocarditis). (a) Short-axis late gadolinium enhancement (LGE) image showing elevated signal in the epicardium of the lateral wall of the left ventricle. (b) Original SSFPP images (top row) and CER map (bottom row) overlaid on myocardium in select frames. Contours were drawn automatically in Frame 1 and automatically transferred to other frames. (c) Time-Intensity curves showing difference in rate of enhancement in remote (septal) and pathologic (lateral free wall) regions. Pathologic region was defined as the region of enhancement in late gadolinium enhancement (LGE) images. [Color figure can be viewed in the online issue, which is available at wileyonlinelibrary.com]
Discussion
A new approach to myocardial first-pass perfusion imaging was proposed and evaluated through simulations, phantom and human studies. The new method avoids the use of SR preparation, and thereby bypasses several limitations of CMR first-pass perfusion imaging that have thus far prevented it from coming into widespread clinical use. The most vexing of these limitations is the DRA, which occurs in the sub-endocardium during the signal up-slope and can mimic a perfusion defect. Several effects have been shown to influence DRA, including cardiac bulk motion, Gibbs ringing, low resolution, and filtering effects due to the modulation of k-space as signal is acquired during SR recovery. SSFPP can potentially mitigate some of these effects, as discussed below.
Unlike much of the contemporary research on perfusion imaging, which focuses on advanced acceleration and reconstruction strategies, this work focuses instead on a novel acquisition scheme. It should be noted that the SSFPP approach could be combined with any acceleration techniques. The high intrinsic SNR of this technique could be advantageously traded for imaging speed. One such approach – a combination of TWIST and GRAPPA - was successfully applied and demonstrated.
Phantom and simulation studies
At [Gd] values expected in myocardium for typical contrast agents and doses, SSFPP showed higher signal and contrast in simulation and phantom experiments than the other sequences (Figure 5). Furthermore, at these [Gd], SSFPP also showed higher sensitivity to changes in [Gd] than other sequences, as is evident from the slope of the curves in Figure 5; the high sensitivity may allow first pass perfusion imaging to be performed with reduced contrast agent dose.
The SSFPP signal remained approximately constant with [Gd] in water phantoms (Figure 4) and similar results were empirically shown for blood in vivo (Figure 6C); this was expected based on the long T1 and T2 of water and blood. As a result, the blood signal would not be appropriate for derivation of an arterial input function (AIF), and an alternative approach to quantification is needed. A recent study (28) showed that myocardial blood flow (MBF) estimate using dual-bolus technique (29) was comparable to that using dual-sequence technique (30), and the results from both techniques matched well with microsphere reference. In that study, the dual-sequence approach used a low-resolution SR-SPGR sequence for AIF measurement, whereas a SR-SSFP sequence for myocardial signal dynamics; the dual-bolus approach, however, used the same sequence (SR-SSFP) for both AIF and myocardial signal dynamics. The concordance of MBF estimates using these two approaches suggests that quantitative perfusion with SSFPP may be possible using a hybrid approach whereby AIF is estimated using a low-dose SR-SPGR acquisition prior to high-dose SSFPP acquisition. Further investigation is required to determine the feasibility of this hybrid approach combining dual-bolus and dual-sequence techniques.
Both simulation and phantom results show an approximately linear relationship between [Gd] and signal for SSFPP at lower concentrations of Gd. The linearity is compromised, however, as [Gd] increases. Previous studies have reported the peak value of [Gd] in myocardium during first-pass to be ~0.5 mM at rest (31) and up to 1.32 mM during stress (32) for dosages typically administered in human subjects. SSFPP showed somewhat greater non-linearity at the upper end of this range than the other sequences, potentially requiring the use of lower contrast agent dose for absolute perfusion quantification with SSFPP. Note, however, that the high signal and contrast of SSFPP may improve qualitative visualization of perfusion images, and potentially offset the limitation of non-linearity. Visual assessment may be further improved by generating CER images, as was shown in human studies. The resulting suppression of blood pool signal in the CER images may also assist in the visual interpretation of the results.
In vivo: proof of concept
This experiment comparing steady-state first-pass perfusion with traditional approaches using SR preparation substantiated the findings of phantom and simulation studies. The general shape of the signal upslope for SSFPP was similar to the other sequences; furthermore, SSFPP yielded the highest SNR, and CNR that was among the highest of all sequences. Prior studies have reported higher SNR and CNR in SR-SSFP compared with other SR based techniques (23,33); our results are in concordance with those from earlier studies. Additionally, CNR of the new SSFPP sequence was similar to that of SR-SSFP in a single subject; additional studies are required to test the consistency of this finding.
Another potential advantage of acquisition in the steady-state is avoidance of k-space modulation caused by signal evolution following each SR pulse; this may also prove beneficial in mitigating DRA(3). Judd and colleagues (4) used a steady-state approach to first-pass imaging; in that work, the magnetization was driven to steady-state in every cardiac cycle. The steady-state preparation used a significant portion of each cardiac cycle, leaving only a fraction available for image acquisition. More recently, DiBella et al. proposed an approach using SPGR in the steady-state (5) without magnetization preparation or cardiac gating. SPGR is inherently T1-weighted at short TR; this was demonstrated in phantom studies by DiBella et al. and confirmed in this work. Instead of SPGR, we propose use of the bSSFP sequence which demonstrated superior performance in terms of higher SNR and higher contrast in phantoms and in vivo. The high SNR of baseline images is a unique characteristic of SSFPP; in fact, imaging in bSSFP steady-state offers the highest possible SNR per unit time of all sequences (13). This increased SNR can be traded for additional acceleration using advanced techniques, which in turn can be used to improve spatial resolution, providing yet another avenue to minimize DRA.
LV blood pool signal remained nearly constant in SSFPP. This effect could be explained by simultaneous reduction in blood T1 and T2 by Gd, keeping the ratio, and hence steady-state signal, nearly constant; this was demonstrated in liquid phantoms in Figure 4. The near constancy of blood signal, and the increase in myocardial signal, may be advantageous in that the step in intensity between blood-pool and myocardium decreases upon the arrival of contrast agent; in the traditional SR based techniques, this step increases during first-pass kinetics. A large step in intensity at the blood-myocardial interface increases Gibbs ringing, a key contributor to DRA as reported by Di Bella et al. (10). SSFPP should thus be more robust against DRA than SR based techniques. The very high signal and contrast of baseline SSFPP images may also support the use of automatic contouring algorithms (34,35), potentially reducing analysis time, which was reported to be as high as 30 minutes per subject in a recent study (12).
3D Imaging
The patient with myocarditis had LGE positive regions that were considered pathologic; furthermore, these regions had abnormally high T2 (not reported), suggestive of edema. Although the mechanism for perfusion abnormalities in such a tissue is unknown, it is speculated that capillary compression may lead to hypoperfusion (36,37).
Central k-space, which was acquired every cardiac cycle, was only 4% of the full k-space. Consequently, the temporal footprint with this technique is 3 heart beats, which has two implications: (i) the upslope will be temporally smoothed, and (ii) the acquisition-reconstruction was found to be sensitive to respiratory motion which cannot be corrected by non-rigid registration. Increasing the size of central region will likely mitigate these issues. This increase, however, would also increase the acquisition time per cardiac cycle – making the technique sensitive to cardiac motion. The possibility of using advanced acceleration to achieve this goal, together with the feasibility of using central region A for motion compensation, is currently under investigation.
Acquisition of a three-dimensional slab covering the entire LV myocardium should avoid any impact that through-plane motion may have on the steady-state signal, except perhaps in the most basal slice. Likewise, the very short TE and motion refocusing between RF pulses inherent to balanced SSFP should minimize any motion induced dephasing.
Limitations
Technique limitations
While the efficiency gained by dropping the multiple SR preparations and associated delay times typically required in 2D perfusion acquisitions is significant, the 3D acquisition necessitated by the maintenance of steady-state and also resulted in a longer temporal footprint. Additional studies utilizing more advanced acceleration techniques are needed to determine the ultimate impact of this trade-off. With sufficient acceleration, the temporal window can potentially be limited to a single cardiac cycle, and short enough to avoid cardiac motion induced artifacts.
SSFPP may be sensitive to the changes in native T1 and T2 that accompany myocardial edema. Depending on the relative change of T1 and T2, baseline (pre-contrast) enhancement of myocardium may occur in edematous regions, potentially reducing the relative level of enhancement post-contrast. While post-contrast signal dynamics were shown to be dominated by the T1-shortening effects of the contrast agent, the potential confounding effects of edema warrant investigation.
Study limitations
The phantom study used Magnevist (Gd-DTPA) contrast agent following the formula for Ni-DTPA-Agarose phantoms previously described (19). On the other hand, all human studies used Multihance (Gd-BOPTA), the standard contrast agent used clinically in our institution. The different relaxivities of these two contrast agents makes an exact quantitative comparison between phantom and human studies impossible. However, a qualitative comparison of the general trends in signal behavior with [Gd] between the phantom and in vivo studies is still informative.
The in vivo experiment designed to show proof-of-concept used a different volunteer for each of the four sequences. Different degrees of myocardial perfusion in the four different volunteers would certainly impact these results; a larger cohort, randomized into four groups, is required to strengthen these findings. Nonetheless, this experiment was undertaken to demonstrate the feasibility of perfusion imaging using SSFPP, and to qualitatively evaluate the signal enhancement characteristics. Likewise, additional patient studies are warranted to investigate the capability of SSFPP to detect and delineate stress-induced perfusion defects.
Conclusion
A new approach to myocardial first-pass perfusion imaging was proposed, and its validity tested through simulations, phantoms, and human studies. This approach bypasses several sources of limitations of current techniques that use the SR preparation, and can potentially provide a means to utilize high acceleration rates for three-dimensional data acquisition. While perfusion quantification was not demonstrated, it may be feasible using a hybrid approach combining dual-bolus and dual-sequence techniques; this is the subject of ongoing investigation.
Acknowledgments
The project described was partially supported by Award Number R01HL102450 from the National Heart, Lung, And Blood Institute.
The authors thank the following individuals for helpful discussions on respective topics: Peter Kellman, PhD, at NIH on RF pulse optimization; Michael F. Tweedle, PhD, at The Ohio State University on preparation of phantoms, and Gerhard Laub, PhD, at Siemens Healthcare on TWIST sequence.
References
- 1.Miller DD, Holmvang G, Gill JB, Dragotakes D, Kantor HL, Okada RD, Brady TJ. MRI detection of myocardial perfusion changes by gadolinium-DTPA infusion during dipyridamole hyperemia. Magn Reson Med. 1989;10(2):246–255. doi: 10.1002/mrm.1910100209. [DOI] [PubMed] [Google Scholar]
- 2.Atkinson DJ, Burstein D, Edelman RR. First-pass cardiac perfusion: evaluation with ultrafast MR imaging. Radiology. 1990;174(3 Pt 1):757–762. doi: 10.1148/radiology.174.3.2305058. [DOI] [PubMed] [Google Scholar]
- 3.Kellman P, Arai AE. Imaging sequences for first pass perfusion --a review. J Cardiovasc Magn Reson. 2007;9(3):525–537. doi: 10.1080/10976640601187604. [DOI] [PubMed] [Google Scholar]
- 4.Judd RM, Reeder SB, Atalar E, Mcveigh ER, Zerhouni EA. A Magnetization-Driven Gradient-Echo Pulse Sequence for the Study of Myocardial Perfusion. Magnetic Resonance in Medicine. 1995;34(2):276–282. doi: 10.1002/mrm.1910340220. [DOI] [PMC free article] [PubMed] [Google Scholar]
- 5.DiBella EV, Chen L, Schabel MC, Adluru G, McGann CJ. Myocardial perfusion acquisition without magnetization preparation or gating. Magn Reson Med. 67(3):609–613. doi: 10.1002/mrm.23318. [DOI] [PubMed] [Google Scholar]
- 6.Gerber BL, Raman SV, Nayak K, Epstein FH, Ferreira P, Axel L, Kraitchman DL. Myocardial first-pass perfusion cardiovascular magnetic resonance: history, theory, and current state of the art. J Cardiovasc Magn Reson. 2008;10:18. doi: 10.1186/1532-429X-10-18. [DOI] [PMC free article] [PubMed] [Google Scholar]
- 7.Chen L, Adluru G, Schabel MC, McGann CJ, Dibella EV. Myocardial perfusion MRI with an undersampled 3D stack-of-stars sequence. Med Phys. 2012;39(8):5204–5211. doi: 10.1118/1.4738965. [DOI] [PMC free article] [PubMed] [Google Scholar]
- 8.Manka R, Jahnke C, Kozerke S, Vitanis V, Crelier G, Gebker R, Schnackenburg B, Boesiger P, Fleck E, Paetsch I. Dynamic 3-dimensional stress cardiac magnetic resonance perfusion imaging: detection of coronary artery disease and volumetry of myocardial hypoenhancement before and after coronary stenting. J Am Coll Cardiol. 2011;57(4):437–444. doi: 10.1016/j.jacc.2010.05.067. [DOI] [PubMed] [Google Scholar]
- 9.Shin T, Hu HH, Pohost GM, Nayak KS. Three dimensional first-pass myocardial perfusion imaging at 3T: feasibility study. J Cardiovasc Magn Reson. 2008;10(1):57. doi: 10.1186/1532-429X-10-57. [DOI] [PMC free article] [PubMed] [Google Scholar]
- 10.Di Bella EV, Parker DL, Sinusas AJ. On the dark rim artifact in dynamic contrast-enhanced MRI myocardial perfusion studies. Magn Reson Med. 2005;54(5):1295–1299. doi: 10.1002/mrm.20666. [DOI] [PMC free article] [PubMed] [Google Scholar]
- 11.Storey P, Chen Q, Li W, Edelman RR, Prasad PV. Band artifacts due to bulk motion. Magnetic Resonance in Medicine. 2002;48(6):1028–1036. doi: 10.1002/mrm.10314. [DOI] [PubMed] [Google Scholar]
- 12.Nagel E, Klein C, Paetsch I, Hettwer S, Schnackenburg B, Wegscheider K, Fleck E. Magnetic resonance perfusion measurements for the noninvasive detection of coronary artery disease. Circulation. 2003;108(4):432–437. doi: 10.1161/01.CIR.0000080915.35024.A9. [DOI] [PubMed] [Google Scholar]
- 13.Scheffler K, Lehnhardt S. Principles and applications of balanced SSFP techniques. Eur Radiol. 2003;13(11):2409–2418. doi: 10.1007/s00330-003-1957-x. [DOI] [PubMed] [Google Scholar]
- 14.Lauffer RB. Paramagnetic Metal-Complexes as Water Proton Relaxation Agents for Nmr Imaging - Theory and Design. Chemical Reviews. 1987;87(5):901–927. [Google Scholar]
- 15.Pintaske J, Martirosian P, Graf H, Erb G, Lodemann KP, Claussen CD, Schick F. Relaxivity of Gadopentetate Dimeglumine (Magnevist), Gadobutrol (Gadovist), and Gadobenate Dimeglumine (MultiHance) in human blood plasma at 0.2, 1. 5, and 3 Tesla. Invest Radiol. 2006;41(3):213–221. doi: 10.1097/01.rli.0000197668.44926.f7. [DOI] [PubMed] [Google Scholar]
- 16.Parker DL, Tsuruda JS, Goodrich KC, Alexander AL, Buswell HR. Contrast-enhanced magnetic resonance angiography of cerebral arteries. A review Invest Radiol. 1998;33(9):560–572. doi: 10.1097/00004424-199809000-00012. [DOI] [PubMed] [Google Scholar]
- 17.Barth M, Moser E. Proton NMR relaxation times of human blood samples at 1. 5 T and implications for functional MRI. Cell Mol Biol (Noisy-le-grand) 1997;43(5):783–791. [PubMed] [Google Scholar]
- 18.Hargreaves BA, Vasanawala SS, Pauly JM, Nishimura DG. Characterization and reduction of the transient response in steady-state MR imaging. Magn Reson Med. 2001;46(1):149–158. doi: 10.1002/mrm.1170. [DOI] [PubMed] [Google Scholar]
- 19.Tofts PS, Shuter B, Pope JM. Ni-Dtpa Doped Agarose-Gel - a Phantom Material for Gd-Dtpa Enhancement Measurements. Magnetic Resonance Imaging. 1993;11(1):125–133. doi: 10.1016/0730-725x(93)90420-i. [DOI] [PubMed] [Google Scholar]
- 20.Bernstein MA, King KF. Handbook of MRI pulse sequences. xxii. Amsterdam ; Oxford: Academic Press; 2004. p. 1017. [Google Scholar]
- 21.Xue H, Guehring J, Srinivasan L, Zuehlsdorff S, Saddi K, Chefdhotel C, Hajnal JV, Rueckert D. Evaluation of rigid and non-rigid motion compensation of cardiac perfusion MRI. Med Image Comput Comput Assist Interv Int Conf Med Image Comput Comput Assist Interv. 2008;11(Pt 2):35–43. doi: 10.1007/978-3-540-85990-1_5. [DOI] [PubMed] [Google Scholar]
- 22.Lauerma K, Virtanen KS, Sipila LM, Hekali P, Aronen HJ. Multislice MRI in assessment of myocardial perfusion in patients with single-vessel proximal left anterior descending coronary artery disease before and after revascularization. Circulation. 1997;96(9):2859–2867. doi: 10.1161/01.cir.96.9.2859. [DOI] [PubMed] [Google Scholar]
- 23.Fenchel M, Helber U, Simonetti OP, Stauder NI, Kramer U, Nguyen CN, Finn JP, Claussen CD, Miller S. Multislice first-pass myocardial perfusion imaging: Comparison of saturation recovery (SR)-TrueFISP-two-dimensional (2D) and SR-TurboFLASH-2D pulse sequences. J Magn Reson Imaging. 2004;19(5):555–563. doi: 10.1002/jmri.20050. [DOI] [PubMed] [Google Scholar]
- 24.Laub G, Kroeker R. syngo TWIST for Dynamic Time-Resolved MR Angiography. MAGNETOM Flash. 2006;34(3):92–95. [Google Scholar]
- 25.Hermosillo G, Chefdhotel C, Faugeras O. Variational methods for multimodal image matching. Int J Comp Vis. 2002;50:329–343. [Google Scholar]
- 26.Xue H, Zuehlsdorff S, Kellman P, Arai A, Nielles-Vallespin S, Chefdhotel C, Lorenz CH, Guehring J. Unsupervised inline analysis of cardiac perfusion MRI. Med Image Comput Comput Assist Interv. 2009;12(Pt 2):741–749. doi: 10.1007/978-3-642-04271-3_90. [DOI] [PubMed] [Google Scholar]
- 27.Epstein FH, London JF, Peters DC, Goncalves LM, Agyeman K, Taylor J, Balaban RS, Arai AE. Multislice first-pass cardiac perfusion MRI: validation in a model of myocardial infarction. Magn Reson Med. 2002;47(3):482–491. doi: 10.1002/mrm.10085. [DOI] [PubMed] [Google Scholar]
- 28.Hsu L-Y, Kellman P, Gatehouse P, Zuehlsdorff S, Glielmi C, Groves D, Aletras A, Bandettini P, Arai A. Comparison of arterial input function measured from dual-bolus and dual-sequence dynamic contrast-enhanced cardiac magnetic resonance imaging. Journal of Cardiovascular Magnetic Resonance. 13(Suppl 1):O8. [Google Scholar]
- 29.Christian TF, Rettmann DW, Aletras AH, Liao SL, Taylor JL, Balaban RS, Arai AE. Absolute myocardial perfusion in canines measured by using dual-bolus first-pass MR imaging. Radiology. 2004;232(3):677–684. doi: 10.1148/radiol.2323030573. [DOI] [PubMed] [Google Scholar]
- 30.Gatehouse PD, Elkington AG, Ablitt NA, Yang GZ, Pennell DJ, Firmin DN. Accurate assessment of the arterial input function during high-dose myocardial perfusion cardiovascular magnetic resonance. J Magn Reson Imaging. 2004;20(1):39–45. doi: 10.1002/jmri.20054. [DOI] [PubMed] [Google Scholar]
- 31.Larsson HBW, FritzHansen T, Rostrup E, Sondergaard L, Ring P, Henriksen O. Myocardial perfusion modeling using MRI. Magnetic Resonance in Medicine. 1996;35(5):716–726. doi: 10.1002/mrm.1910350513. [DOI] [PubMed] [Google Scholar]
- 32.Hsu LY, Kellman P, Arai AE. Nonlinear myocardial signal intensity correction improves quantification of contrast-enhanced first-pass MR perfusion in humans. Journal of Magnetic Resonance Imaging. 2008;27(4):793–801. doi: 10.1002/jmri.21286. [DOI] [PubMed] [Google Scholar]
- 33.Lyne JC, Gatehouse PD, Assomull RG, Smith GC, Kellman P, Firmin DN, Pennell DJ. Direct comparison of myocardial perfusion cardiovascular magnetic resonance sequences with parallel acquisition. Journal of Magnetic Resonance Imaging. 2007;26(6):1444–1451. doi: 10.1002/jmri.21167. [DOI] [PubMed] [Google Scholar]
- 34.Barkhausen J, Ruehm SG, Goyen M, Buck T, Laub G, Debatin JF. MR evaluation of ventricular function: True fast imaging with steady-state precession versus fast low-angle shot cine MR imaging: Feasibility study. Radiology. 2001;219(1):264–269. doi: 10.1148/radiology.219.1.r01ap12264. [DOI] [PubMed] [Google Scholar]
- 35.Carr JC, Simonetti O, Bundy J, Li DB, Pereles S, Finn JP. Cine MR angiography of the heart with segmented true fast imaging with steady-state precession. Radiology. 2001;219(3):828–834. doi: 10.1148/radiology.219.3.r01jn44828. [DOI] [PubMed] [Google Scholar]
- 36.Eitel I, von Knobelsdorff-Brenkenhoff F, Bernhardt P, Carbone I, Muellerleile K, Aldrovandi A, Francone M, Desch S, Gutberlet M, Strohm O, Schuler G, Schulz-Menger J, Thiele H, Friedrich MG. Clinical characteristics and cardiovascular magnetic resonance findings in stress (takotsubo) cardiomyopathy. JAMA. 306(3):277–286. doi: 10.1001/jama.2011.992. [DOI] [PubMed] [Google Scholar]
- 37.Abdel-Aty H, Boye P, Zagrosek A, Wassmuth R, Kumar A, Messroghli D, Bock P, Dietz R, Friedrich MG, Schulz-Menger J. Diagnostic performance of cardiovascular magnetic resonance in patients with suspected acute myocarditis: comparison of different approaches. J Am Coll Cardiol. 2005;45(11):1815–1822. doi: 10.1016/j.jacc.2004.11.069. [DOI] [PubMed] [Google Scholar]